Categories
Forex Elliott Wave Forex Market Analysis

GBPCAD Triangle Pattern Completion. What’s Next?

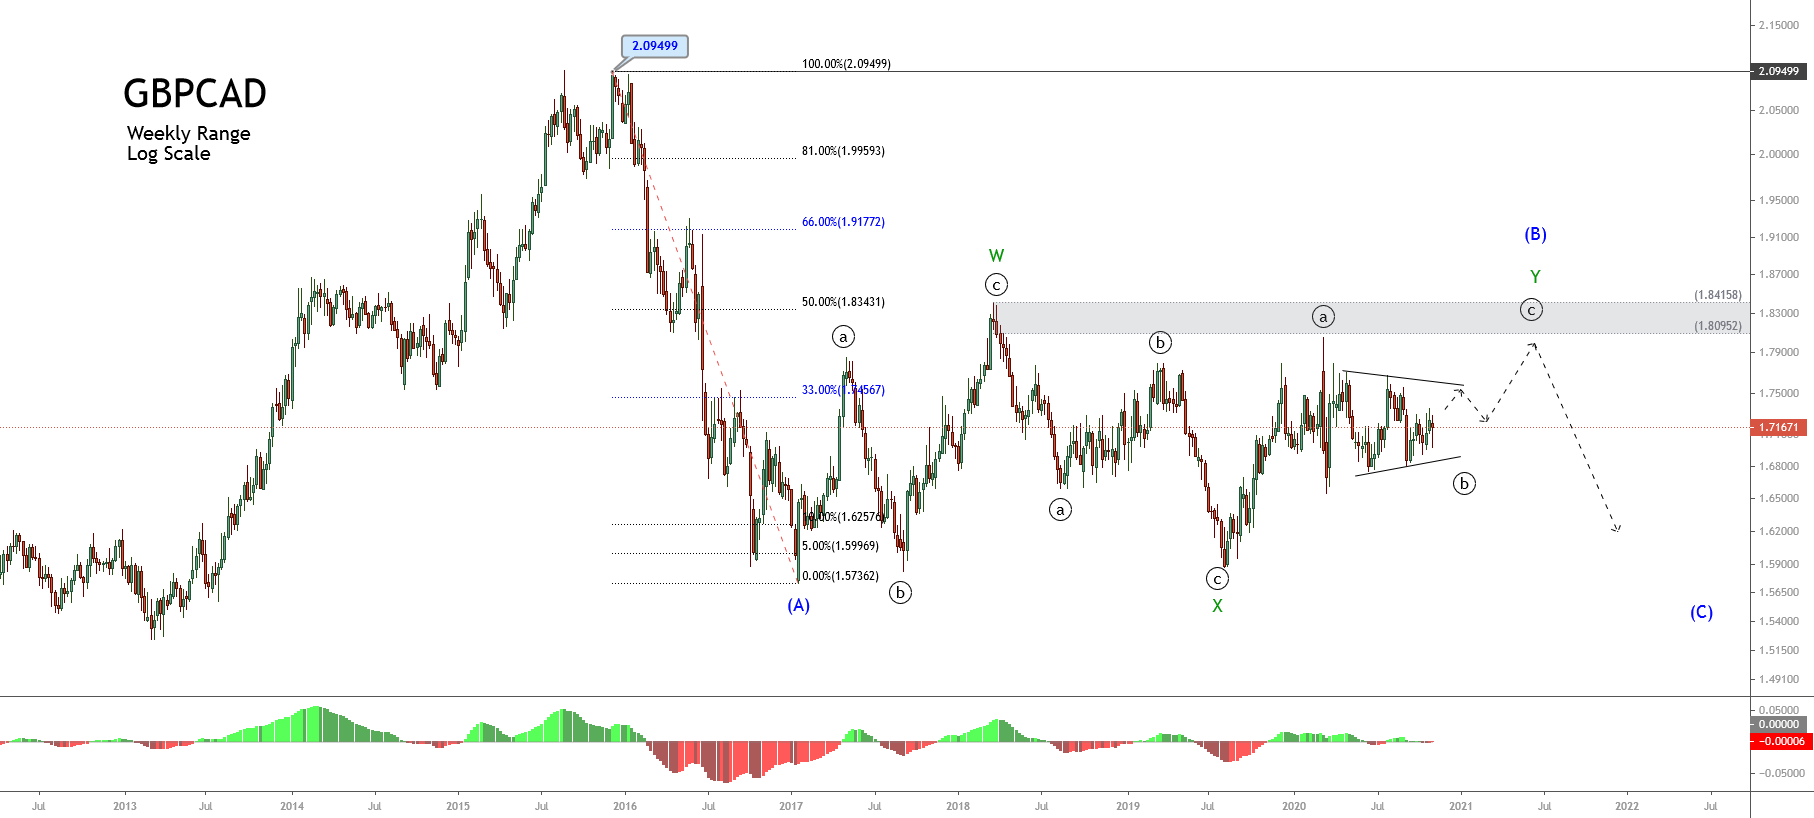
The GBPCAD cross shows the completion of an Elliott wave triangle developed in its wave ((b)) of Minute degree, which moves inside the incomplete wave 2 of Minor degree. 

Technical Overview

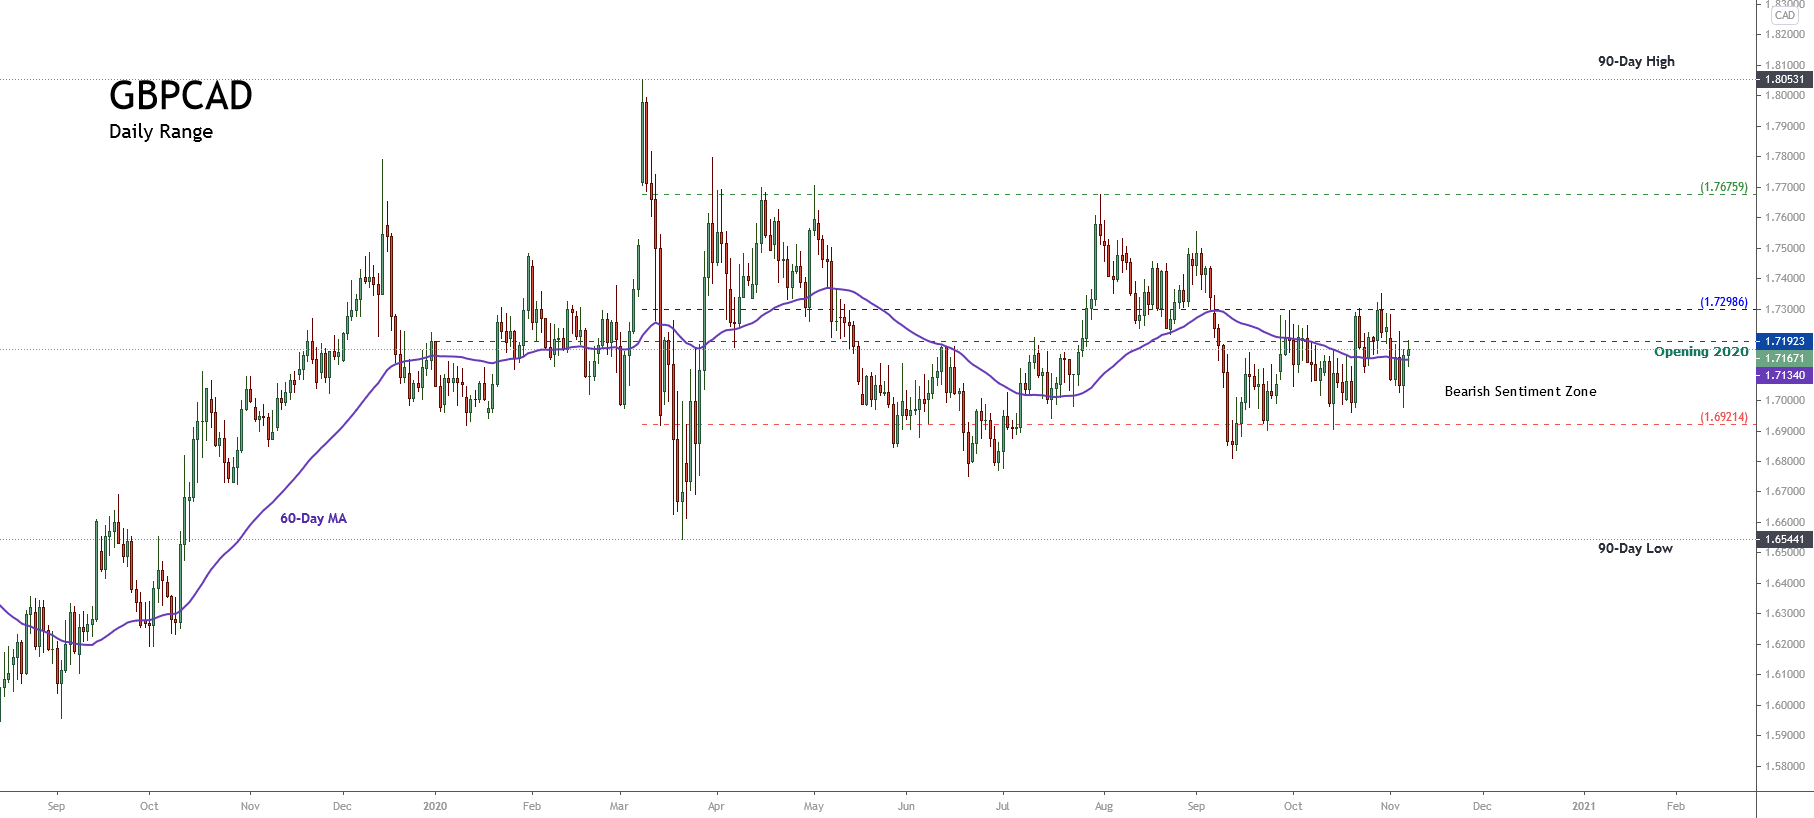
The big picture of GBPCAD cross under the Elliott Wave view exposed in the following daily chart shows the progress of a corrective structure that began on March 09th when the price found fresh sellers at 1.80531. Once the cross topped at 180531, the cross completed an impulsive wave identified as wave 1 of Minor degree labeled in green and began to develop its wave 2 of the same degree, which remains incomplete.

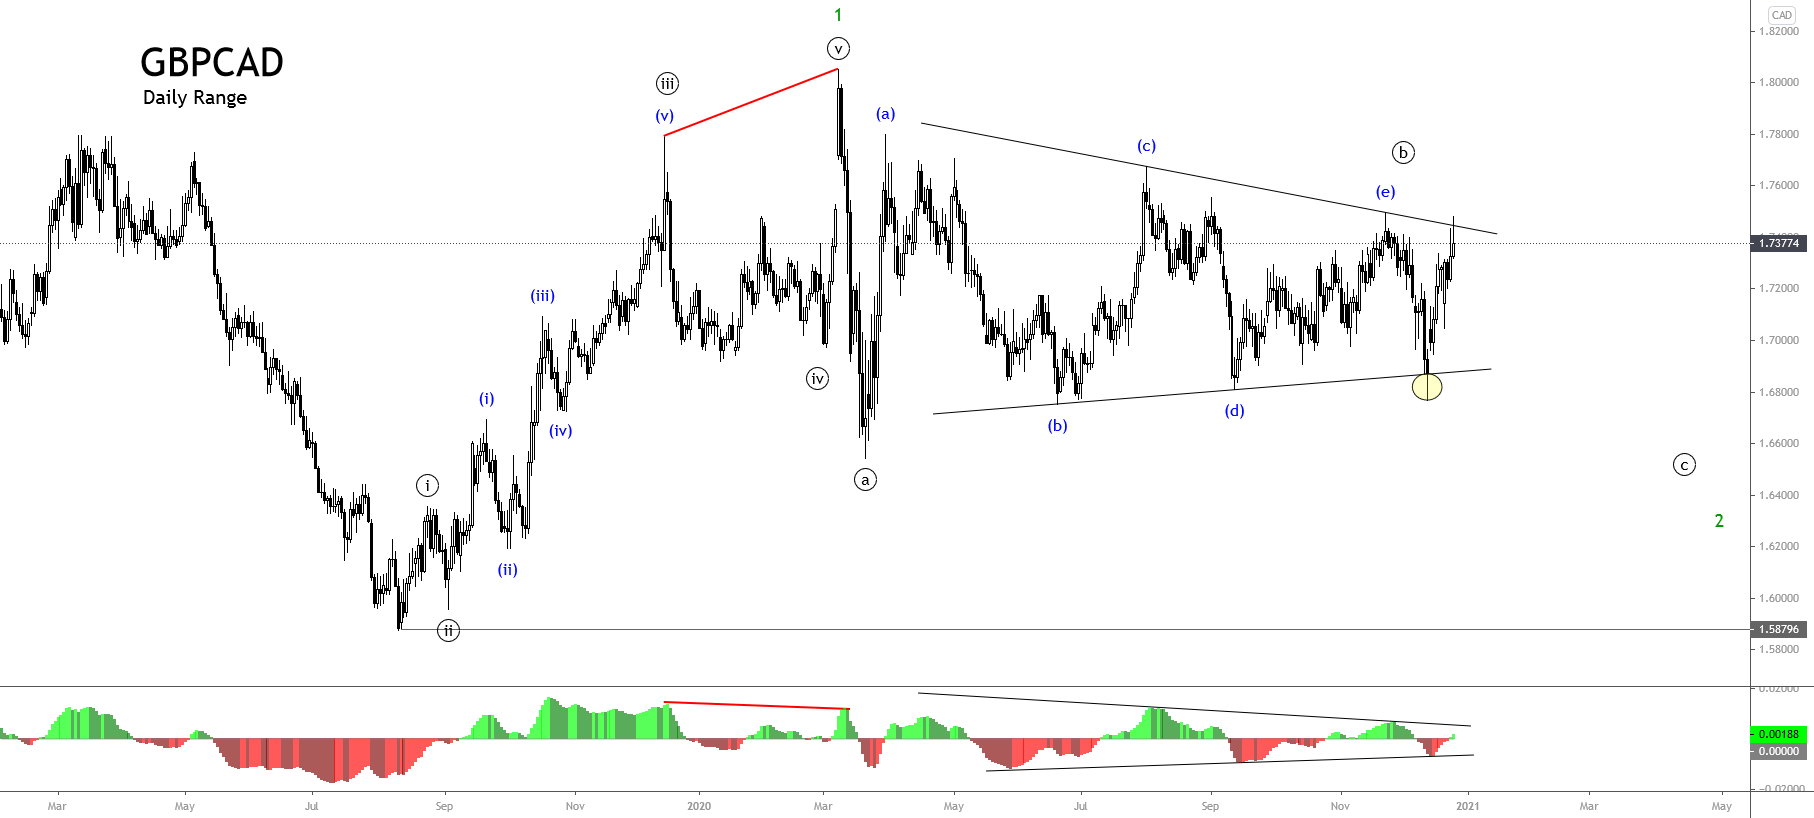
The previous chart also shows the price developed its wave ((a)) of Minute degree in black as a sharp decline, making its next path corresponding to wave ((b)) as a triangle pattern. This price context carries us to verify the alternation principle between waves inside a corrective pattern. In fact,  the speedy first corrective leg gave way to an elapsed second move in an extended time range compared with wave ((a)). Likewise, the next decline corresponding to wave ((c)) shouldn’t be as quick as wave ((a)).

On the other hand, the piercing below the base-line of the triangle that connects the end of waves (b) and (d) of Minuette degree labeled in blue suggests that the cross could see further declines in the following weeks. Additionally, considering that the price action didn’t surpass the end of wave (e), the likelihood of further drops increases.

Technical Outlook

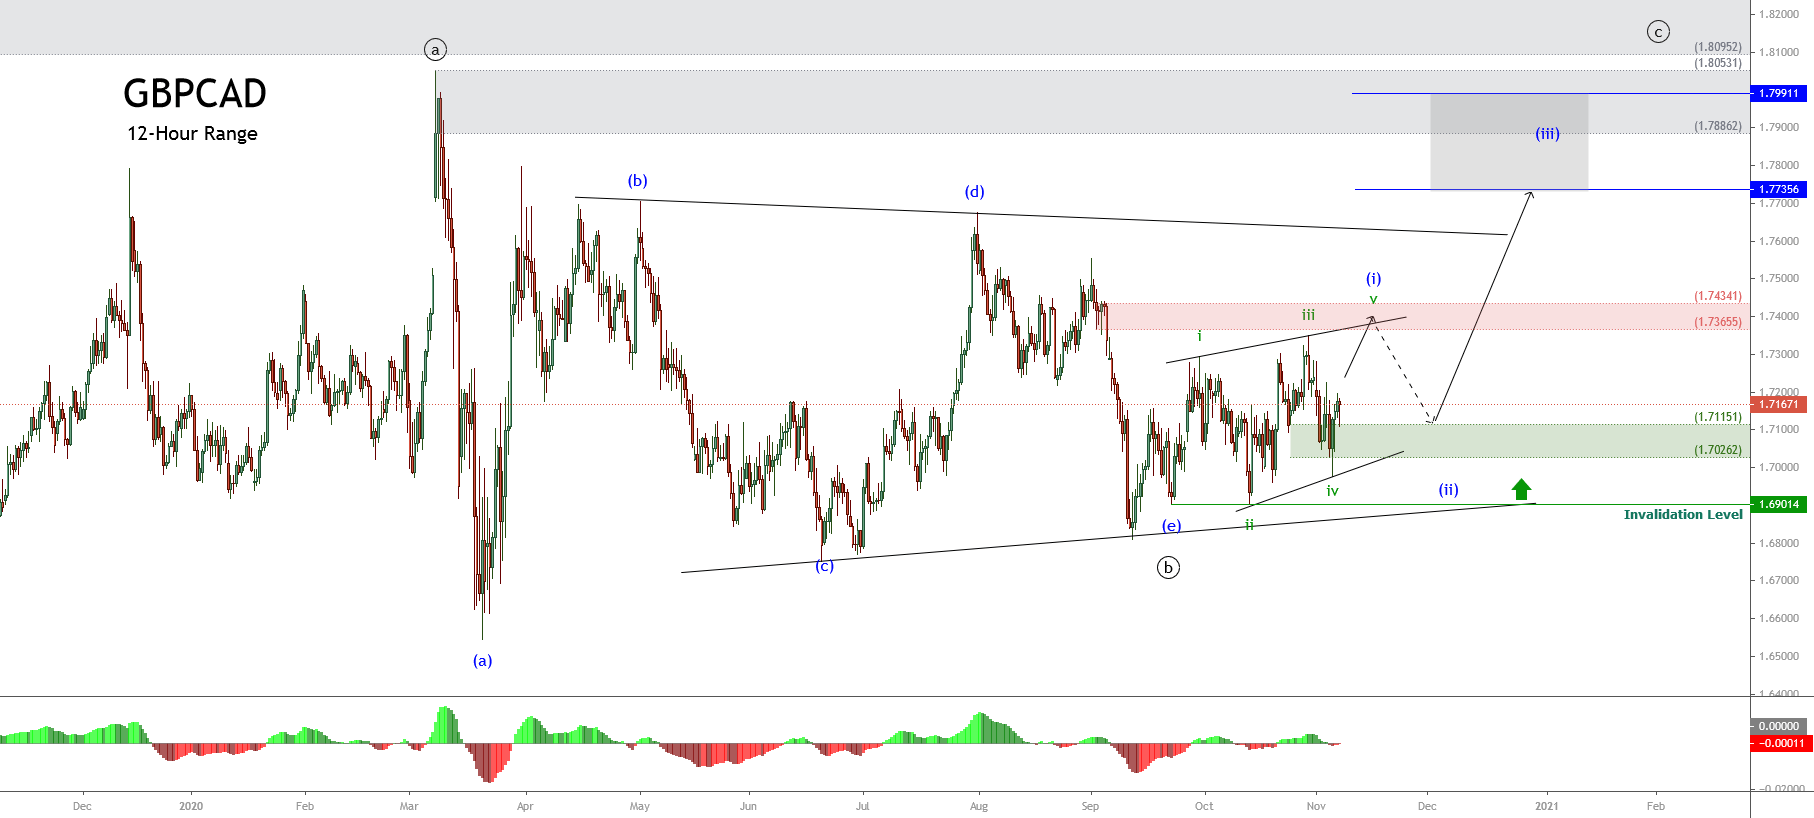
The next daily chart exposes the time segment of the corrective sequence corresponding to wave 2 of Minor degree, in which waves ((a)) and ((b)) in black were moving for 259 days, starting when the cross topped at 1.80531 and till the end of wave (e) in blue. Additionally, the piercing of the base-line that connects the end of waves (b) and (b) suggests that wave (c) should be in progress.

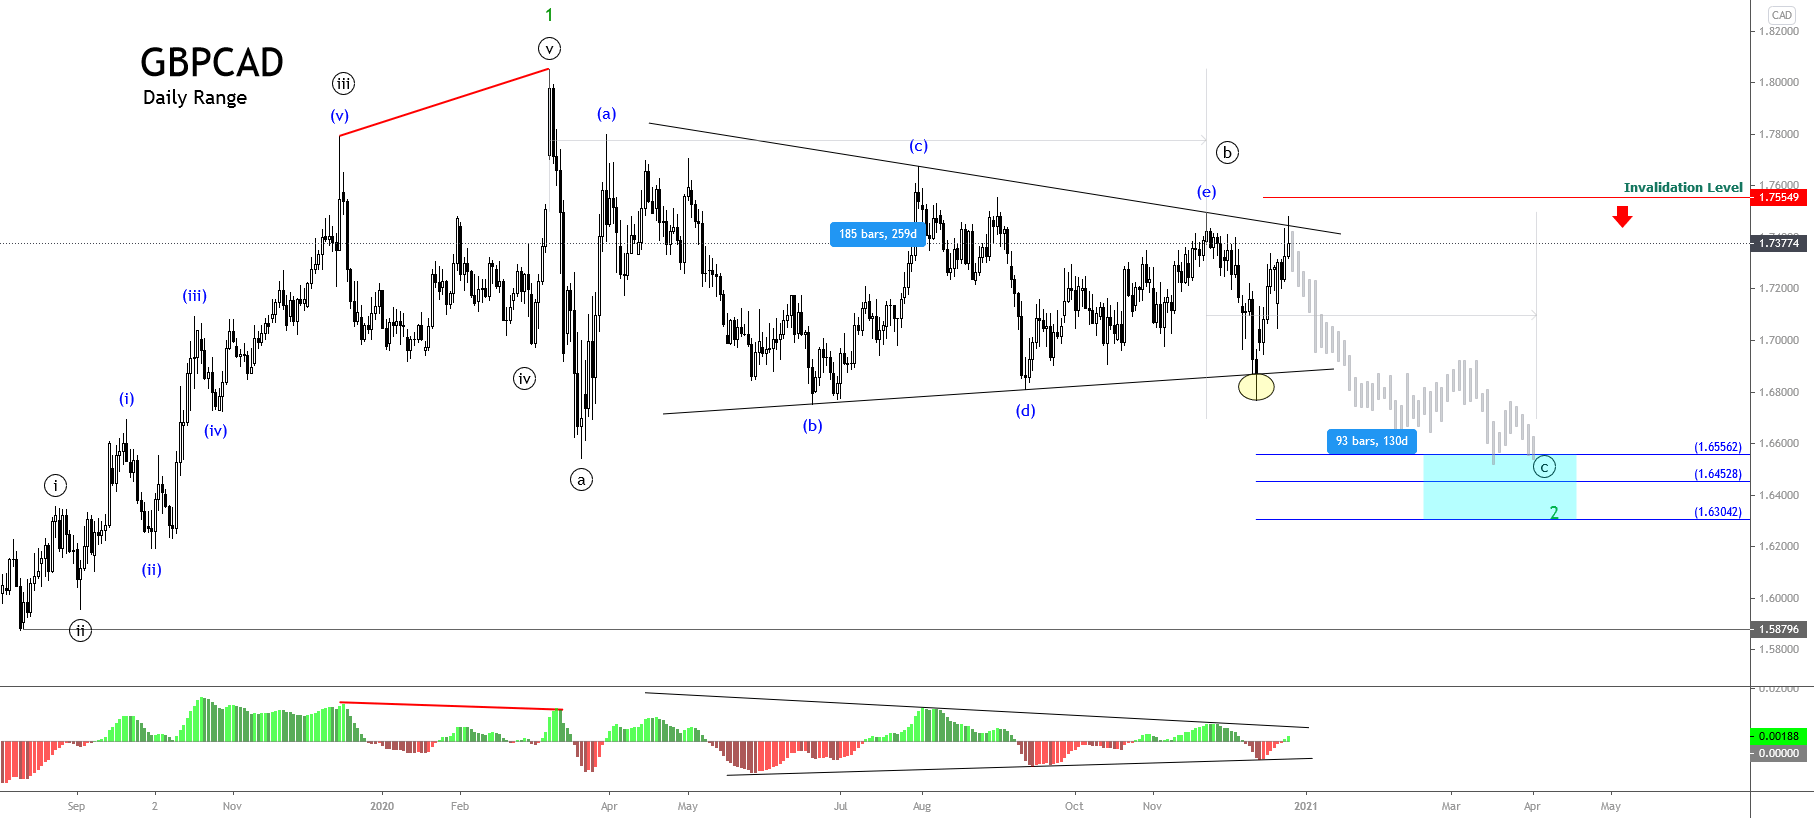
In this context, the incomplete bearish sequence in progress corresponding to wave ((c)) could extend in a fraction of 259 days, for example, 50 percent of that time or approximately 130 days, which carries us to foresee a downward correction in the GBPCAD cross till early April 2021. Likewise, the potential bearish target zone can be found between 1.65562 and 1.63042.

In summary, the GBPCAD cross advances in an incomplete corrective sequence corresponding to wave 2 of Minor degree. Simultaneously, its internal structure reveals the progress in its wave ((c)). The potential bearish target for this segment extends between 165562 and 1.63042. Also, the downward sequence could elapse until early April 2021. Finally, the invalidation level of the current bearish scenario is located at 1.75549.

Categories
Forex Elliott Wave Forex Market Analysis

GBPCAD Advances in a Double-Three Pattern

Overview

The GBPCAD cross advances in a sideways sequence corresponding to an incomplete double-three pattern. The mid-term Elliott Wave view foresees a potential rally that could boost the cross toward last March’s highs.

Market Sentiment

The mid-term market sentiment overview of the GBPCAD cross unfolded by the 90-day high and low range and illustrated in its daily chart, reveals the price action moving in the bearish sentiment zone (SZ).

The previous chart reveals the sideways movement bounded between the extreme bullish SZ located at 1.76759 and the extreme bearish SZ at 1.69214. Likewise, the 60-Day moving average looks flat, suggesting the balance between supply and demand, or bull and bear traders, which in turn, is indicative of sideways action.

On the other hand, considering the year’s opening price at 1.71923, we distinguish that the yearly candlestick pattern corresponds to a narrow body candle identified as a doji, revealing the next direction’s market participants’ indecision that the price will take.

In consequence, while the GBPCAD cross remains moving mostly sideways, the primary bias will continue neutral.

Elliott Wave Overview

The long-term Elliott Wave landscape of the GBPCAD cross reveals the price action is developing an incomplete three-wave sequence of Intermediate degree labeled in blue, which currently advances its wave (B). The internal structure unfolds in a double-three pattern as it exposes the next weekly chart on a log scale.

The previous chart reveals that the double-three pattern in progress looks incomplete. According to the Elliott wave theory, this complex formation follows an internal structural series subdivided as 3-3-3. In this context, the GBPCAD cross advances in its last “three” or the third component of the double-three pattern identified as wave Y of Minor degree labeled in green.

The internal structure of wave Y subdivided into another “three” sequence, which advances in its wave ((b)) of Minute degree labeled in black. Likewise, the wave ((b)) follows the arrangement of a triangle pattern. Thus, the GBPCAD cross should develop an upward movement subdivided into five-waves, corresponding to its wave ((c)) of Minute degree identified in black.

Elliott Wave Outlook

Considering the progress of the GBPCAD cross into a triangle pattern, the following 12-hour chart unveils that the price completed its wave ((b)) with the failure of reaching a new lower low at 1.69014, where the cross began to advance in an upward sequence that corresponds to its wave ((c)) of Minute degree identified in black.

The previous chart illustrates the end of the wave (e) of Minuette degree identified in blue and the upward sequence of a potential leading diagonal pattern, which could follow a 5-3-3-3-3 internal sequence. Simultaneously, the price seems to be advancing in its fifth wave of Subminuette degree labeled in blue, which belongs to the first wave of Minuette degree in blue. 

The first impulsive wave of Minuette degree could find resistance in the supply zone between 1.73665 and 1.74341, from where the cross could start to retrace until the demand zone is located between 1.71151 and 1.70262. Once GBPCAD completes its second wave, the third wave could become the upward cycle’s extended wave. This upward movement could drive the pair toward 1.77356 and continue until 1.79911.

The bullish scenario’s invalidation level locates at 1.69014, which coincides with the wave’s origin ((c)) that remains in progress.

Categories
Forex Assets

Exploring The Basics Of GBP/CAD Forex Pair

Introduction

GBPCAD pronounced as ‘pound cad” is minor/cross currency pair in forex. GBP refers to Great Britain Pound, and CAD refers to the Canadian Dollar. Since GBP is on the left, it becomes base currency, and CAD on the right becomes the quote currency.

Understanding GBP/CAD

The current market price has of GBPCAD is not similar to the prices in the stock market. The value of GBPCAD represents the value of CAD equivalent to one GBP. It is simply quoted as 1 GBP per X CAD. For example, if the value of GBPCAD is 1.7192, then 1.7192 Canadian dollars are required to purchase one pound.

GBP/CAD Specification

Spread

Spread is the difference between the bid price and the ask price in the market. These values are controlled by the brokers. So, it differs from broker to broker as well as the type of account.

ECN: 0.8 | STP: 1.9

Fees

There is a small levied by the broker on every trade a trader takes. There are a few pips of fee on ECN accounts, while the fee is nil on STP accounts. The fee is usually between 6 to 10 pips.

Slippage

Slippage is the difference between the trader’s demanded price and the real executed price. Slippage happens when orders are executed by the market price. It happens solely due to the volatility of the market and the broker’s execution speed.

Trading Range in GBP/CAD

A trading range is the representation of the pip movement of GBPCAD in different timeframes. These values are helpful in getting a rough idea of the profit/loss that can be made from the trade in a given timeframe. For example, if the min pip movement on the 1H timeframe is 3 pips, then a trader can expect to gain/lose at least $22.38 when one standard lot is traded.

Procedure to assess Pip Ranges

  1. Add the ATR indicator to your chart
  2. Set the period to 1
  3. Add a 200-period SMA to this indicator
  4. Shrink the chart so you can assess a large time period
  5. Select your desired timeframe
  6. Measure the floor level and set this value as the min
  7. Measure the level of the 200-period SMA and set this as the average
  8. Measure the peak levels and set this as Max.

GBP/CAD Cost as a Percent of the Trading Range

Now that we know how much profit/loss can be made within a given time frame let us also calculate the cost on each trade by considering the volatility and timeframe. For this, the ratio between the total cost and volatility calculated and expressed in percentages. The magnitude of these percentages will then be used to determine the timeframe with marginal costs.

ECN Model Account 

Spread = 0.8 | Slippage = 2 |Trading fee = 1

Total cost = Slippage + Spread + Trading Fee = 2 + 0.8 + 1 = 3.8

STP Model Account

Spread = 1.9 | Slippage = 2 | Trading fee = 0

Total cost = Slippage + Spread + Trading Fee = 2 + 1.9 + 0 = 3.9

The Ideal way to trade the GBP/CAD

From the above two tables, it can be ascertained that the percentages largest on the min column, moderate on the average column, and least on the max column. The higher the value of percentages, the higher is the cost of the trade. So with this, we can conclude that the costs are high during low volatility, and low during high volatility. Similarly, the costs are high on lower timeframes and considerably low on higher timeframes. Hence, to keep volatility and cost at a balance, it ideal to trade when the pip movement in the market is around the average values.

Market orders bring in an additional cost in the trade. To eliminate this, one can trade using limit orders. This will set the slippage value to 0, and eventually, reduce the total cost on the trade by a significant amount. An example supporting the statement is illustrated below.

Total cost = Spread + trading fee + slippage = 0.8 +1 + 0 = 1.8

Categories
Forex Market Analysis

Daily: Markets are Calmed Ahead of a New Fresh Wave of U.S Tariffs


NEWS COMMENTARY


The U.S.-China trade spat will likely remain a key driver of sentiment this week ahead after reports said U.S. President Donald Trump wants to move forward with tariffs on $200 billion in Chinese goods.

U.S.-China trade-war fears have been simmering for months. Neither side is showing any signs of backing off, fueling worries that the world’s two largest economies are spiraling towards a trade war that could shake the global economy.

Besides trade rhetoric, the U.S. will see a relatively quiet week in terms of economic releases, with a report on the housing sector expected to draw the most attention.

The tariff level will probably be about 10%, as the Wall Street Journal reported, quoting people familiar with the matter. This is below the 25% the administration said it was considering for this possible round of tariffs. The decision comes despite a Treasury invitation last week to senior Chinese officials, including Vice Premier Liu He, for further negotiations to reach a calm resolution of this matter. Trump has demanded that China cut its $375 billion trade surplus with the United States, end policies aimed at acquiring U.S. technologies and intellectual property and roll back high-tech industrial subsidies.

On other hand, in spite of disappointing inflation and retail sales data released on Thursday, the USD Index managed to recover some of the lost ground afterwards, closing the previous week with indecisiveness about future moves. However, such a recovery is expected to be short-lived as the underlying economic indicators lack of the strenght to represent any serious impact on monetary policy. In fact, last week we experienced a typical case of market participants using fundamentals as means to print more liquidity and to reposition themselves by given economics a contrarian reading


CHART ANALYSIS


EUR/GBP

On the daily chart, the price was moving strongly in ascending channel towards the key resistance 0.91 then it dropped to 0.8895 due to

1- breaking beneath the channel after completing the wave 5 (Eliot waves)

2- the AB=CD harmonic pattern

3- the overbought on RSI

The price is about to reach 0.8845 where the descending trend and moving average 200 collide

Then, it may retrace to the resistance 0.9025 before heading the C wave target at 0.873


GBP/CAD

On the daily chart, the pair has reached decisive resistance levels, as the zone 1.7165-1.7065 pushed the price lower along with the upper side of the descending channel from the high of 2018

An AB=CD harmonic pattern has been completed as the price stopped at the B level which is located at the same zone spot

An ascending channel had been formed as a reversal flag besides a divergence on RSI to reinforce the bearish bias to the support 1.657


Categories
Forex Educational Library

Forex.Academy 2018-2019 Outlook – CAD Group


Summary


Forex Daily News: In this post, we analyse the Canadian Dollar group against their main currencies. As a summary, the second half of the year and 2019, we foresee a corrective movement in the Canadian currency, which could come supported for a correction in oil prices to, then, give way to a new rally. After this correction, our central vision for the Canadian Dollar is a new appreciation scenario.

Additionally, we observe that it is likely that GBP and EUR would show the best performance against the CAD; on the opposite side, the Japanese currency and the Swiss Franc could have the worst performance against the Canadian Dollar.


USDCAD

The USDCAD is developing a complex corrective structure of a second bullish impulsive wave. The corrective structure has a bearish bias, which could find support in the area between 1.29607 to 1.28371. The key level to watch out is 1.2884, this level should convert on a critical pivot level (HHL).


EURCAD

EURCAD cross in the short-term has a bearish bias, probably could see new lows in 1.50 zone. In the mid-term, the cross moves sideways as a complex corrective. In the long-term, we foresee that the EURCAD could find fresh lows in the area between 1.47822 to 1.45662, from where the cross could start a new rally as a fifth bullish wave. Invalidation level is at 1.4442.


GBPCAD

Probably the GBPCAD cross shows the clearest movement of the CAD Group. The price is moving in a bearish A-B-C sequence, which could find support at 1.6410 level, from where the price could create a new connector and then initiate a rally. The new bullish sequence has a target the area between 1.8533 and 1.9266. Invalidation level is at 1.5837.


CADJPY

The CADJPY cross has been commented in a previous analysis, and we maintain the main idea which consists in to seek only long positions with a long-term profit target in the area between 94.69 and 95.30. Is probably that the cross makes a retrace to the area between 85.45 to 83.73 from where we could find new opportunities to incorporate us into the trend. Invalidation level is located at 82.17.


CADCHF

In the CADCHF cross, the lemma is “Buy the Dips” or “Watch the Breakout.” CADCHF is running sideways in an upper degree consolidation structure. The key level to control is 0.7636, after the breakout of this level, we expect more upsides to the zone between 0.7992 and 0.8245. In case that the price makes a false breakdown to the area between 0.7394 and 0.7289, it could be an attractive opportunity to look for the long side. Invalidation level is at 0.7124.


NZDCAD

In the long-term, NZDCAD is running sideways and making lower highs. The long-term pivot level is at 0.8640. For this cross, we expect only short positions; if the price makes a bullish move, the potential movement is limited to the area between 0.9253 to 0.9461. The long-term target area is between 0.8401 to 0.8098.


AUDCAD

Probably the AUDCAD cross is the less attractive to trade. As we can see in the weekly chart, it is running sideways since the second half of 2013. The price is moving inside a bearish cycle, which could find support in the “long-term pivot level” at 0.8919, from where AUDCAD could start to bounce. The invalidation level for the bearish cycle is at 1.0397.


Forex Daily News: Finally, as a technical note, considering that the AUDCAD is mostly bearish, by correlation, the CAD should perform better than the AUD for the period foreseen.

Categories
Forex Market Analysis

Forex and Indices – Daily Update 26.07.18


Fundamental Overview


Forex News: The market sentiment of the session was led by the US Dollar (DXY), which advanced against the main currencies group climbing 0.68 per cent. The Dollar boost was aided on the one hand, by the labour market data, in the Thursday session the Initial Jobless Claims data rose 217,000, which despite the increase of 9,000 from the previous week’s revised level, continue showing optimistic levels for the American economy. On the other hand, the ECB interest rate decision continues without changes for the common currency, contributing to the strength in the USD appreciation. The worst performer currency of the session was in the “commodities currencies group”; the Aussie (AUD) fell 1.04 per cent dragged by the dive in Copper price which retraced 1.59 per cent.

Forex News – Daily Performance

Forex News - Daily PerformanceSource: Forex.Academy Collection.


Technical Analysis


EURUSD

EURUSD made a false breakout which could not reach the first daily resistance, turning to the daily pivot and even falling below the weekly pivot point changing the market sentiment from bullish to bearish. For long positions, we need to see the breakout above the bearish breakdown candle at 1.1710, with a first potential profit target placed at the first daily resistance at 1.1756, the second potential target is the confluence level between the second daily resistance and the first weekly resistance at 1.1785. Short positions should be valued as a continuation of the breakdown, with a profit potential target at 1.1615. Pay attention to this area because the confluence with the third daily resistance at 1.16077 could be a potential buy zone.


GBPUSD

The GBPUSD pair in the 30-minutes chart tested the first daily resistance of the intraday trading session at 1.3214, After this, the price made a re-test, from where the pound started to fall and found support in the weekly pivot point at 1.31257. For long positions, the price should break over the daily pivot level at 1.31739 with a potential profit target at 1.3215 (first intraday resistance). Short positions should be valued as the continuation of the previous movement when the price breaks under the weekly pivot level (1.31257) with a potential target in second daily support at 1.31065.


USDCHF

The Swiss currency in the 30-minutes chart continues moving sideways between the first daily support (0.99007) and below the first daily resistance (0.9942). For long positions, the USDCHF should break above the first daily resistance at 0.9942 level with a short-term target at 0.9960 (weekly pivot level); for bearish positions, we need to see that the price to close below the intraday range at 0.9910 with a potential profit target in 0.9877 (first weekly support.)


EURCAD

The EURCAD cross in the 30-minutes chart is moving bearish, testing the second weekly support located at 1.52488. For bullish positions, the price should break and consolidate above 1.5278 with a potential target is at the first weekly support at 1.5325. For bearish positions, as a continuation of the trend, the price could drop to the third weekly support at 1.51778.


GBPCAD

The GBPAUD cross is moving bearish nearly above the first weekly support at 1.71211. For long positions, the price should breakdown candle at 1.7185 with a potential target on the daily pivot level at 1.7232. If we are looking bearish continuation, the price could see the bottom at the 1.70067 level (confluence zone between the third daily support and second weekly support.)


FTSE 100

FTSE 100 in the 30-minutes chart is moving in a narrow range below the daily pivot level (7,669.8 pts) and above the weekly pivot level (7,649 pts.) For bullish positions, the price should break above 7,686 pts, with a potential target on the first weekly resistance at 7,735 pts, which is the convergence zone with the second daily resistance. Bearish positions should be considered if FTSE 100 index breaks below the weekly pivot level at 7,649 with a potential profit target at the first weekly support (7,593 pts.), the second profit target is the HHL at 7,521 pts.


DAX 30

The DAX index 30 in the 30-minutes chart soared to the third daily resistance (12,827 pts), from this zone we have two options. Long positions could extend to the second weekly resistance at 12,912 pts, only if the price breaks above the 12,827 pts. The second option is for short trades; it could be considered if the price breaks below 12,715 pts with a profit target located at 12,604 pts.


Categories
Forex Market Analysis

Forex and Indices – Daily Update – 13.07.18


Fundamental Forex Trading Overview


BoE’s Deputy Governor Cunliffe suggests a delay in a rate hike.

The Bank of England’s (BoE) Deputy Governor, Sir Jonathan Cunliffe, said on Friday that we should be cautious in an interest rate increase and that there are still arguments for a “stodginess” policy. Cunliffe suggests a delay in a rate hike due, despite the economic growth, to the wage rate is not increasing to the 3 per cent that the BoE had initially forecasted.

The BoE’s next Monetary Policy Committee meeting will be on August 2, for this meeting most economists polled expect the rate to increase.


Technical Analysis


 EURUSD

The EURUSD in the 2-hour chart is bouncing from the Potential Buy Zone as expected in our previous Daily Update on Thursday 12th when we commented that EURUSD was making higher highs and higher lows. Now when the pair is testing support in the green box, we expect new upsides to 1.19067 (orange box – maturity area) completing a major degree connector. Invalidation level is 1.15080.


GBPUSD

The GBPUSD in this 2-hour chart is completing a new bearish leg in the Potential Buy Zone. We foresee a breakout of the short-term trendline and the continuation of the previous bullish cycle with a target placed in the 1.3475 area. Also, the exhaustion area is the target area of the inverted head and shoulders pattern which will be active once time the short-term pivot level was surpassed. Invalidation level of the new bullish cycle is 1.30494.


USDCHF

As noticed in our last Forex and Indices daily update, the Swiss currency is being the weakest currency. The USDCHF in the 2-hour chart soars to the highest level since May 2017. Using the correlations in the US Dollar group with DXY, EURUSD and GBPUSD, we could suspect that this is a false breakout.


EURCAD

The EURCAD cross in the 2-hour chart has broken down the short-term pivot level at 1.53684 and made a pullback to the same level turning the support into resistance. We expect more falls with a target placed in the area between 1.5144 to 1.5061. Invalidation level is 1.55225.


GBPCAD

The GBPCAD cross in the 2-hour chart is consolidating testing the 1.73 psychological support level. It is likely that the price moves bullish making a false breakout before to continue the previous bearish impulse. Invalidation level is at 1.76907.


FTSE 100

The FTSE 100 in the 2-hour chart continues to consolidate, developing a complex corrective structure and testing around the 7,700 level. We foresee a limited upside for the British index to 7,792 pts. Invalidation level is 7,508.


DAX 30

The DAX 30 in the 2-hour chart is moving bullish, testing the 12,600 pivot level. We expect more climbs to the area between 12,695 to 12,742. The critical level to watch is the 12,807 pts, from where if the price surpasses it, DAX could rise to 13,020 pts. Invalidation level is 12,104.


Categories
Forex Market Analysis

Analysts Expect Raises on Inflation and Retail Sales Data – Forex and Indices – Daily Update – 21.08.18


Fundamental Overview


Analysts expect raises on inflation and retail sales data.

The Canadian Dollar will be the driver currency of this Friday 22nd trading session, with the release of Inflation and Core Retail Sales data. Analysts expect the Consumer Price Index (CPI) for the month of May to rise to 0.4%, driven mainly by the increase in fuel and food prices; with this increase, the CPI (YoY) estimated should reach 2.5%, being higher than the 2.2% reported in April.

On the other hand, analysts foresee that core retail sales (MoM) would rise to 0.5% during the month of April, which represents an optimistic scenario since the contraction of 0.2% reported in March.

This data could contribute to the scenario of a possible hike in the interest rate by the Bank of Canada (BoC), being in line with what was commented by the BoC Governor Stephen Poloz, who stated that he expects an increase in the interest rate soon.


Technical Analysis


EURUSD

EURUSD bounced from the lowest level in three weeks from 1.1507 to 1.1633. Our vision is that the common currency could make a limited recovery to the 1.17 area before we see fresh lows likely in the 1.1425 zone. Invalidation level of the mid-term bearish cycle is 1.1852.


GBPUSD

GBPUSD bounced from the PRZ forecasted at 1.3109 aided by the Bank of England (BoE) monetary policy decision. Now we should see fresh higher highs and lower highs to validate the change in bias. The short-term resistance level is at 1.3298.


USDCHF

The USDCHF pair broke down the short-term ascending trendline. Now we expect that the price tests the long-term ascending trendline. Our main vision for USDCHF is that it could make a new bearish leg with first support at the 0.98 level, and 0.9788 as the second support.


EURCAD

EURCAD could make a new higher high in the upper line of the ascending channel with a target in the 1.5533 area. After this move, if the price breaks down the short-term ascending trendline, we should see a flag pattern as a continuation of the previous movement.


GBPCAD

GBPCAD is developing in an ascending wedge, which could see fresh highs at the 1.7732 level, as a false breakout before it falls to the long-term ascending trendline. The first support level to watch out for is 1.7455.


FTSE 100

FTSE 100 continued falling for the fifth consecutive week. In the current session, it tested support at 7,548, the low reached on June 18th. Our vision for the British index is that it could complete the corrective sequence in the 7,400 area, from where FTSE could build a new bullish connector.


DAX 30

As was commented in our previous Daily Update, the DAX 30 is moving bearish, developing a Dead Cat Bounce Pattern. In the current trading session, the German index has fallen below the May 31st low at 12,547.6. The next support level is in the 12,300 area, from where we foresee the DAX should start to bounce.


Categories
Forex Market Analysis

Forex and Indices – Daily Update


Hot Topics: 


  • Major currencies show bullish signals against the greenback.
  • Indices recovers but more falls are expected.
  • Pound crosses could turn bullish.


Major currencies show bullish signals against the greenback.

Forex Daily Market Update

The EURUSD broke up the flag pattern testing the 1.17 level resistance. Now the price is making a throwback to the congestion area. RSI also is showing bullish signals with the breakout and test to the flag structure.


GBPUSD looks like as its turning bullish. On the one hand, the price is making higher highs and higher lows. On the other, the RSI found support above the 40 level; this signal makes us foresee that a turning movement is near for the pound.


USDCHF is in a congestion zone between 0.9845 and 0.989. We expect a new bearish move to the region between 0.9784 and 0.9815. The shape of the price sequence that started on May 9th looks like a consolidation structure and is likely that the price could see new highs.


Indices recovers but more falls are expected.

FTSE 100 is recovering from the last selloff but is moving in the Potential Reversal Zone. RSI moves in an ascending channel but it still didn’t break the key level 60 to show bullish signals. Invalidation level is above 7,803.5.


In the same way as the FTSE, the DAX is moving in a consolidation structure as an ascending wedge. RSI is moving in the 51.53 level, but it doesn’t mean that in the short-term the trend is bullish, it suggests that the bias remains bearish and the price is making a retracement. Invalidation level is above 13,040.6.


Pound crosses could turn bullish.

GBPCAD is moving sideways and tested the monthly pivot level at 1.73191 becoming a relevant resistance. We think the cross could make a new low near the first weekly support at 1.71310, where the price could start a bullish cycle with a profit target at the weekly second resistance confluence area on 1.7510. Invalidation level is placed below 1.7065.


GBPAUD  has been moving mostly bearish during this session, but we expect that the price could make a bullish reversal move in the area between 1.7360 and 1.73195, where it could bounce from, with the eyes placed on the weekly pivot at 1.76242. Invalidation level is below 1.725.


Categories
Forex Market Analysis

The Positive Data Reported in Canada could support a rate hike soon

Hot Topics:

  • The positive data reported in Canada could support a rate hike soon.
  •  The Greenback rally continues.
  • FTSE maintain the bull trend, DAX waits for ECB meeting?

Positive data reported in Canada could support a rate hike soon.

The consumer inflation (YoY) in March increased to the highest level in three years reaching 2.3%, climbing from the 2.2% reported in February. The Core Inflation (YoY) descended to 1.4% in March from the 1.5% in February. The higher oil prices have influenced inflation to rise. On the other hand, retail sales in February have increased to 0.4% from 0.1% reported in January. The Bank of Canada maintains a 2 percent inflation target; this scenario could signal an interest rate hike soon. In the last Monetary Policy meeting, the Bank of Canada decided to maintain the rate at 1.25%.

In the technical context, a correction for the Canadian Dollar group could show soon. In the EURCAD cross, we expect a bullish movement with a target placed in the 1.58 level before making new lows.

In the same way, GBPCAD is developing a bullish retracement process that could reach 1.805 – 1.81, the area from where it could make the bearish continuation of the main trend.

The Greenback rally continues.

For the fourth consecutive session, the US Dollar saw advances compared to its main competitors. The Euro has broken down its short-term consolidation structure but has been stopped by the lower trend-line of its long-term triangle pattern.

The Pound tested the 1.40 psychological level again, from where it is bouncing. We expect a retracement to a Fibonacci level before we decide to sell this pair.

The Swissy could visit the area between 0.9765 and 0.9836 before it makes a bearish cycle.

FTSE maintains the bull trend, DAX waits for ECB meeting?

The main European indices have closed with a mixed sentiment. The FTSE 100 closes the last trading session of the week climbing above the pivot level 7,326. We expect more upsides until the 7,450 – 7,520 area before it makes a bearish leg.

On the opposite side, DAX 30 could not climb up above the pivot level of 12,622. The German index could make a new bearish leg, likely to be around the 12,100 – 12,200 area before the ECB Monetary Policy Meeting and continue the bullish cycle.

© Forex.Academy