Introduction
In the previous course lessons, we have discussed the basics of candlesticks along with the pros and cons of using them. From this lesson, we will learn the basic candlestick patterns and their usage. As discussed, the idea of candlesticks charts has started in Japan in the late 1870s. These charts were then introduced to the outside world by Steve Nison through his first book, ‘Japanese Candlestick Charting Technique.’
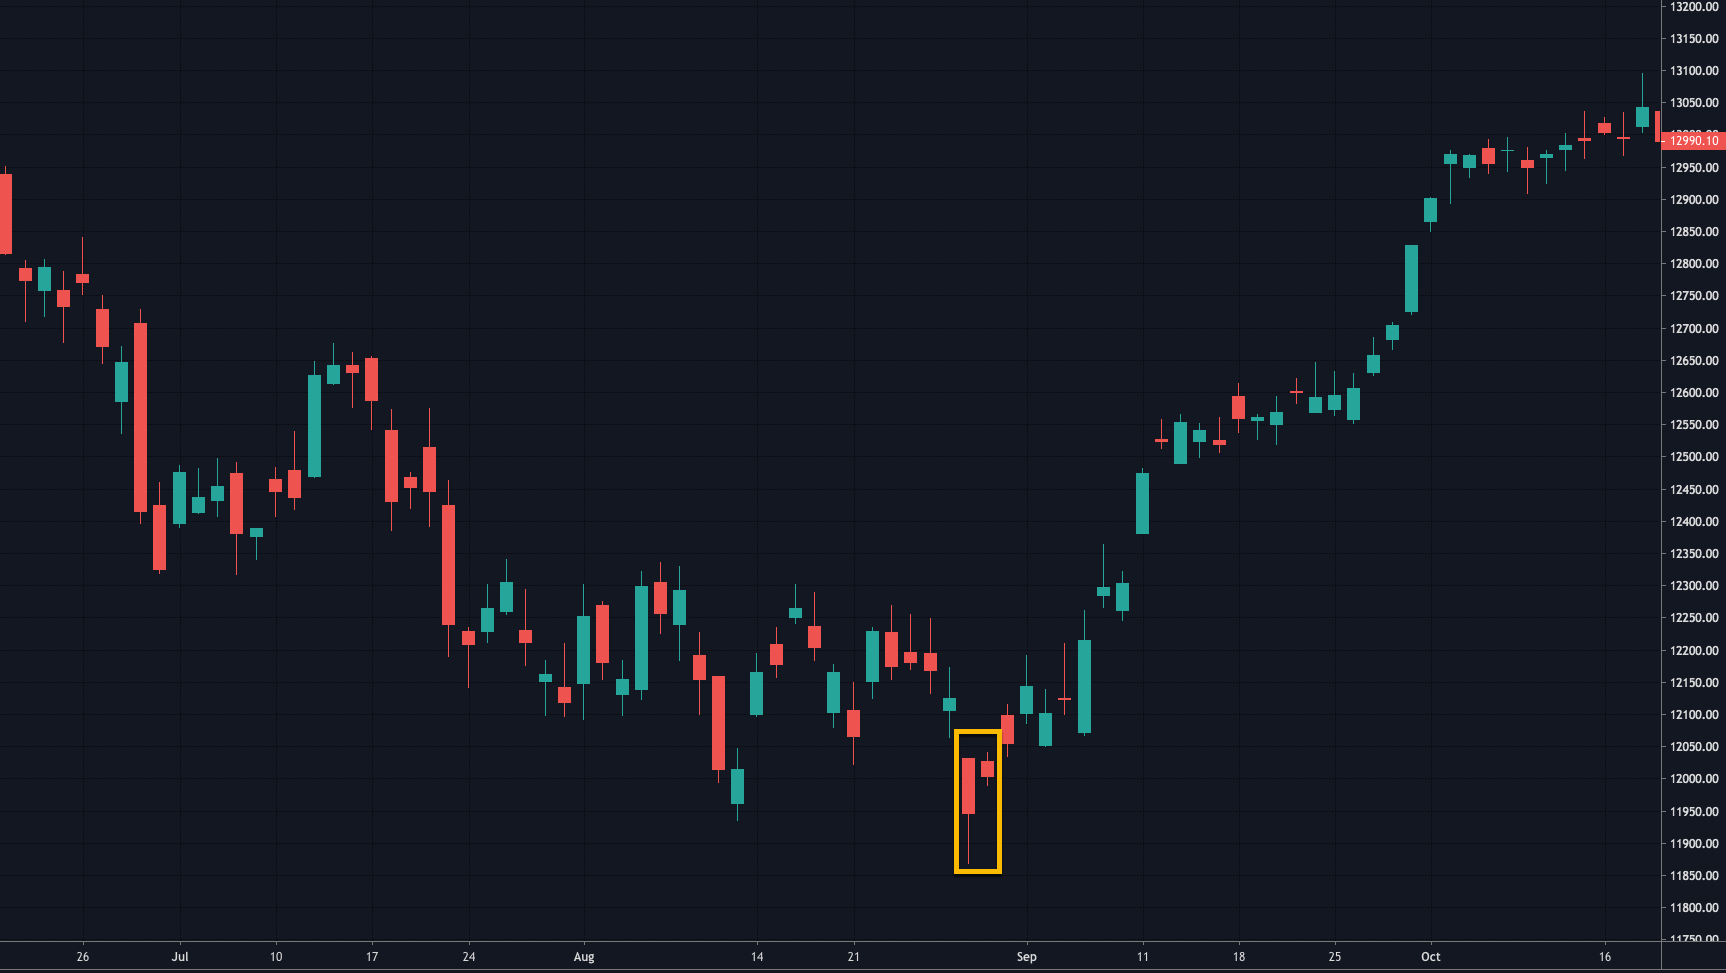
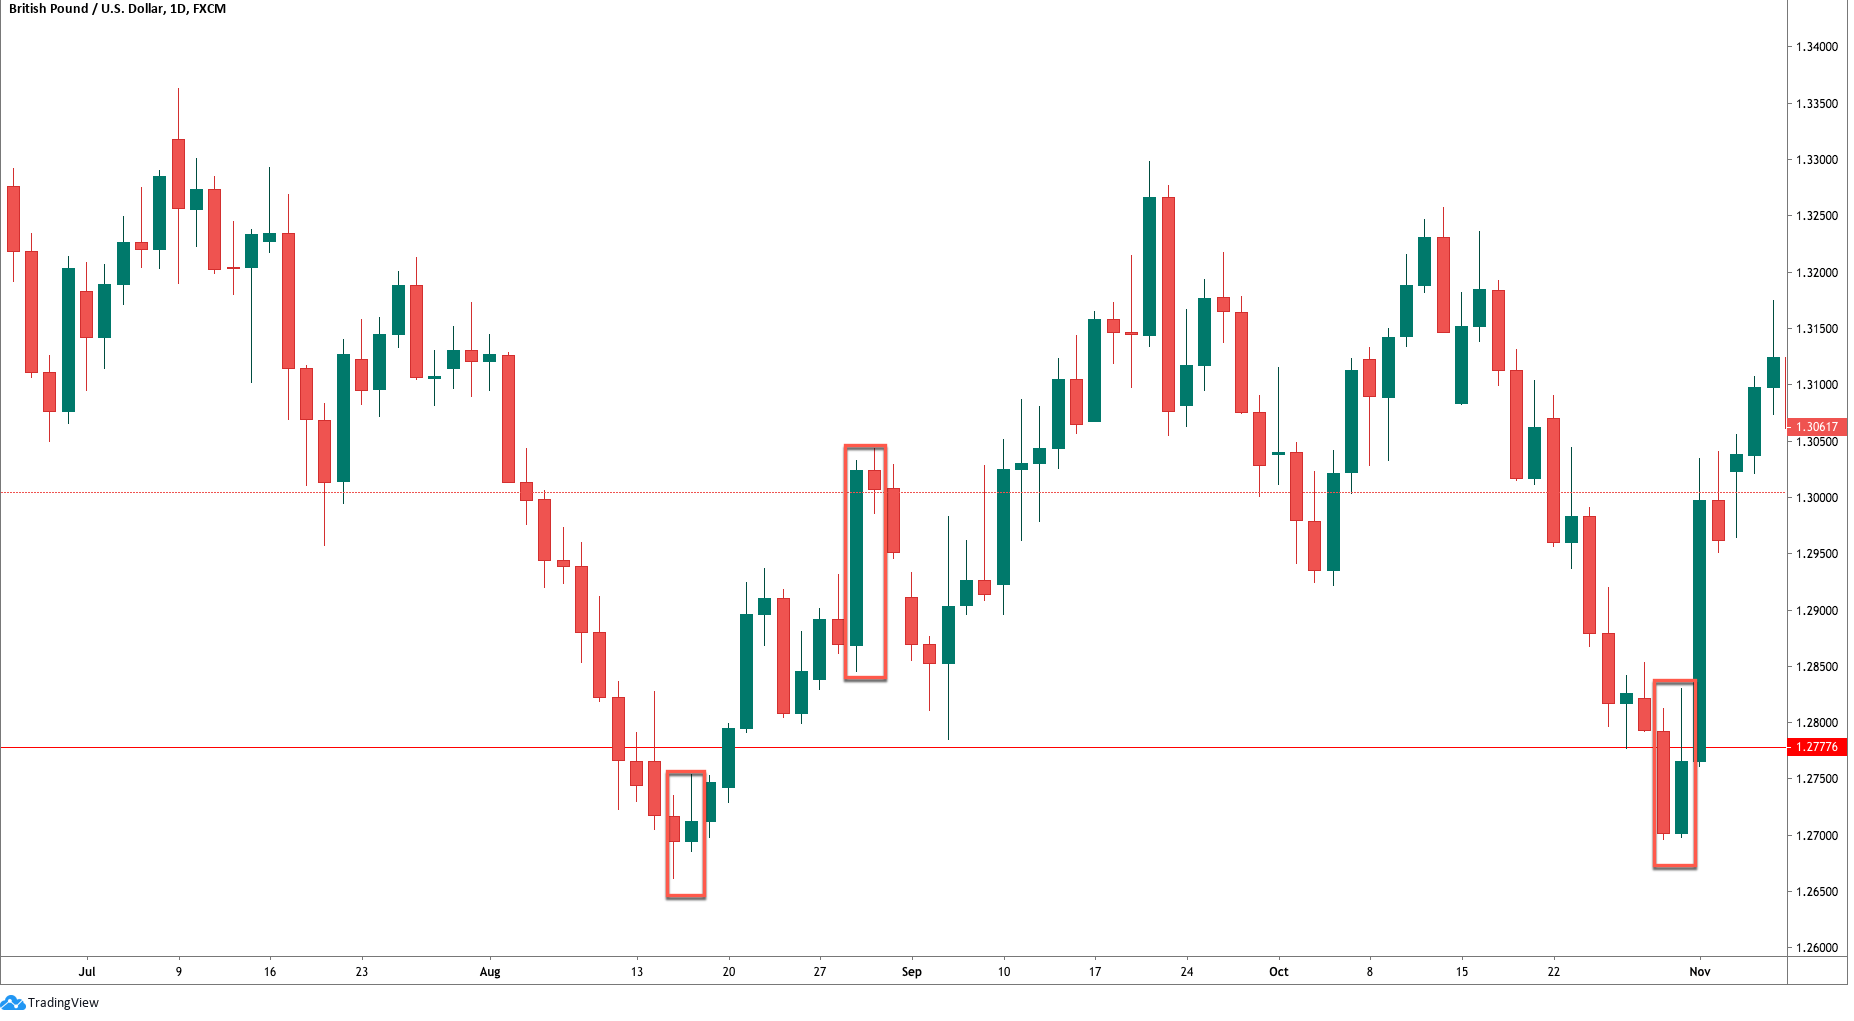
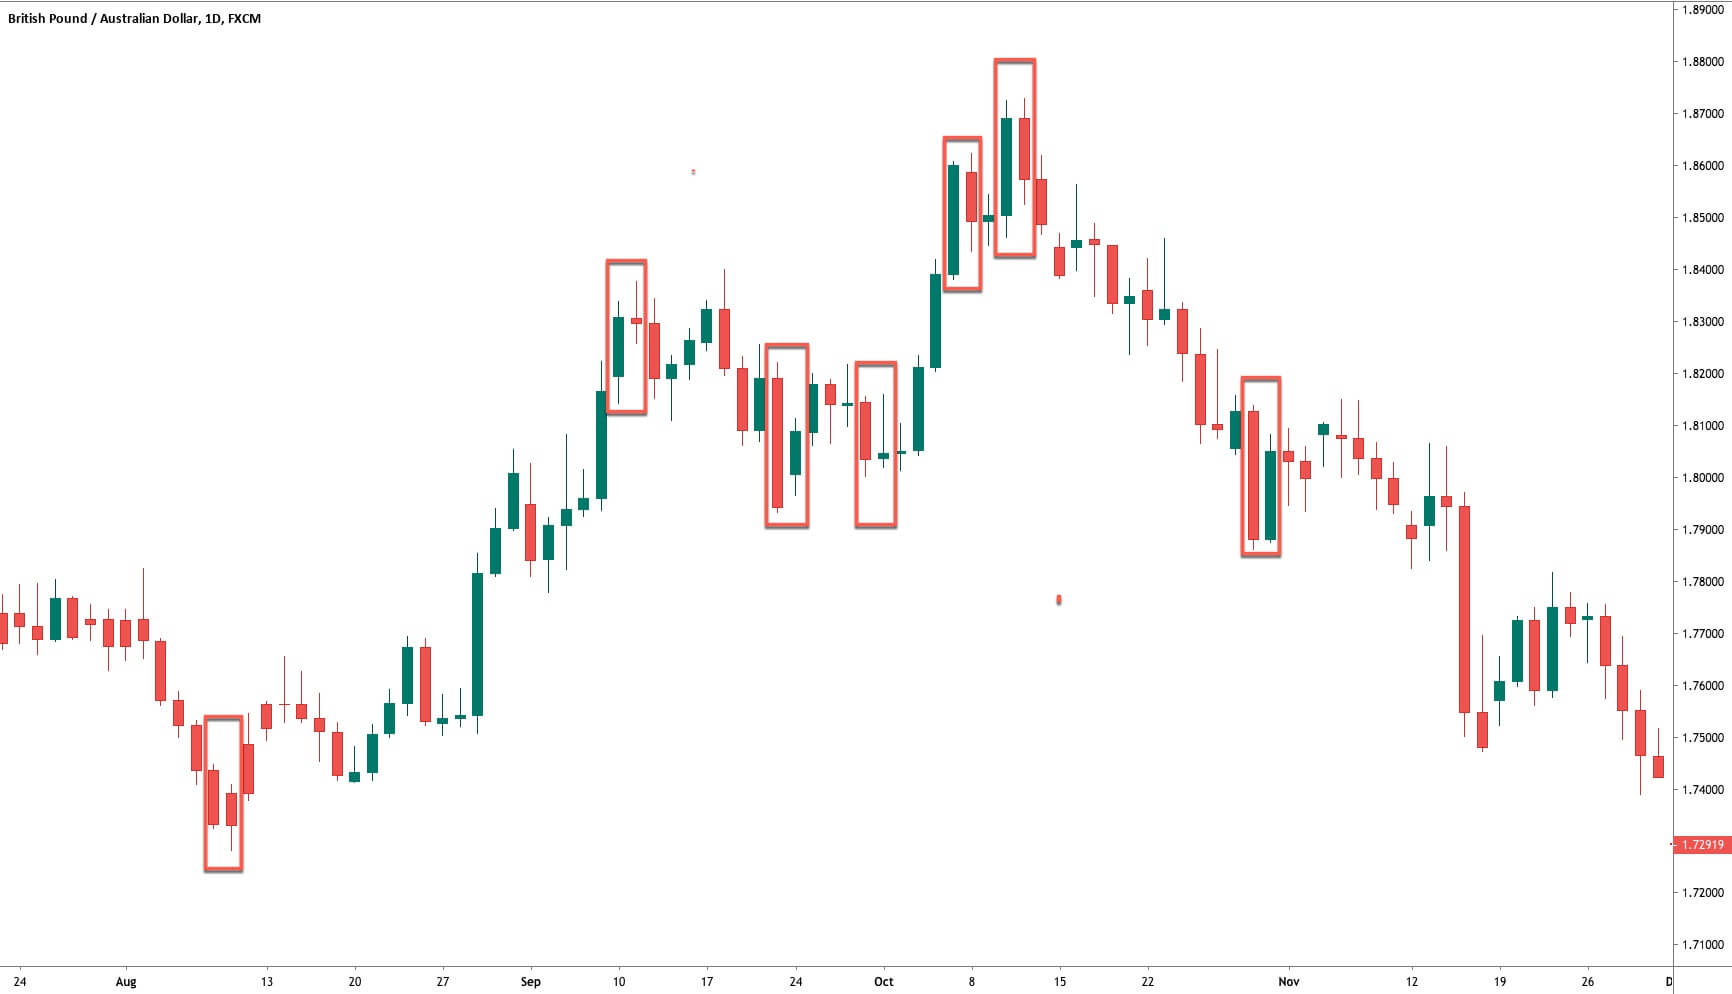
In this lesson, let’s discuss the primary advantage of using candlestick charts. Although a single candlestick gives us many details about the price movement of an asset, a sequential set of candlesticks is more powerful. These sets are also known as patterns in simple trading language, and using these patterns, traders across the world take trading decisions.
Expert traders have decoded many such patterns and rigorously backtested them to analyze what those patterns will eventually result in. They also examined how the market direction will change after the appearance of these patterns on the charts. Now, let’s see the different candlestick patterns one must know.
Different types of candlestick patterns
There are single, dual, and triple candlestick patterns depending on how many candlesticks are involved in them. For example, if there are the candlestick pattern is formed by three candlesticks, it is known as the triple candlestick pattern. Every single pattern has its own significance and can be found in most of the Forex charts.
The main intention of identifying any candlestick pattern is to understand the further price movement in the market. Hence these patterns are classified into two different types – Continuation Patterns & Reversal Patterns. When we identify a continuation candlestick pattern on the chart, it means that the market will continue in the same direction as the underlying trend. Contrarily, if we identify a reversal pattern on the charts, we can expect the price to change its direction. Also, these patterns are internally classified as bullish and bearish continuous/reversal patterns, which will be discussed in the upcoming lessons.
Examples of Continuation Candlestick Patterns
- Deliberation Pattern
- Concealing Baby Swallow Pattern
- Rising Three Methods Pattern
- Separating Lines Pattern
- Doji Star Pattern
Examples of Reversal Candlestick Patterns
- Morning Star Pattern
- Evening Star Pattern
- Engulfing Pattern
- Three Line Break Pattern
- Harami Pattern
- Three White Soldiers Pattern
Some of these are single candlestick patterns, while some are multiple candlestick patterns. We shall be discussing each of these patterns in detail in our future articles.
Psychological context of candlestick patterns
The candlestick patterns demonstrate the psychological trading that takes place during the period represented by a single or multiple candles. We need to start imagining the price movement as a battle between buyers and sellers. Typically, Buyers expect that prices will increase and drive the price up through their trades. Whereas sellers bet on falling prices and push the price down with their selling interest.
Also, the Japanese gave very visual names to these patterns so that it impacts the mentality of a trader. For instance, pattern names like Hanging Man and Dark Cloud Cover represent negativity, while the patterns like Three White Soldiers and Morning Star indicate positive market results. Hence, as soon as we hear the names of these patterns, our sub-conscious memory will know whether the forecast of the market is positive or negative.
Benefits of trading candlestick patterns
Although initially conceived for daily timeframes, Candlestick patterns can be used by swing traders, day traders, and even long term investors. Below are some of the significant advantages of these patterns.
- They are very easy to identify and comprehend. They provide a detailed description of the occurrences and happenings in the markets.
- Interaction between the buyers and sellers can easily be understood just by reading the pattern and without having to analyze the market entirely.
- Candlestick patterns can be used in conjunction with other indicators for extra confirmation on the trading signals generated.
- They display reversal patterns that cannot be seen in other charts like Line & Bar charts.
That’s about the introduction to Candlestick patterns. In our upcoming lessons, we will discuss different candlestick patterns and how to generate trading signals using these patterns. So, stay tuned.
[wp_quiz id=”60271″]


