Categories
Forex Price Action

Strong Reversal Pattern in the Daily Chart? Make Full Use of It

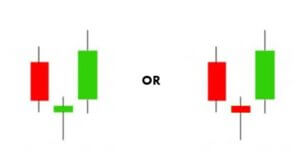
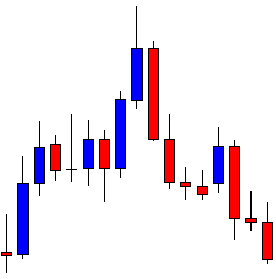
In today’s lesson, we are going to demonstrate an example of a daily chart, which ends up offering an H4 entry by producing a Morning Star in the daily chart. The Morning Star is one of the strongest bullish reversal patterns. The combination traders may make full use of it too. This is what we are going to demonstrate in today’s lesson. Let us get started.

It is a daily chart. The chart shows that the price makes a bearish move. The last candle closes within a level, where the price had a bounce earlier. The buyers may keep their eyes on the chart to get a bullish reversal to go long in the pair. Let us proceed to the next chart to find out what happens next.

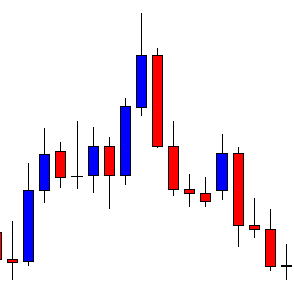
The chart produces a Doji candle. It means neither the buyers nor the sellers are confident. The next candle is going to be very crucial. A bearish candle may drive the price towards the South. On the other hand, a bullish reversal candle may push the price towards the North.

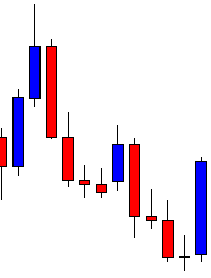
The candle comes out as a bullish engulfing candle closing well above the Doji candle’s upper wick. It is a sign that the buyers may take over. Do not forget that the chart produces a Morning Star. It is one of the strongest bullish reversal patterns. The buyers on the daily chart may keep their eyes on the pair to go long with their different strategies. What do the daily-H4 combination traders do? They are to flip over to the H4 chart to find out long entry. Let us flip over to the H4 chart.

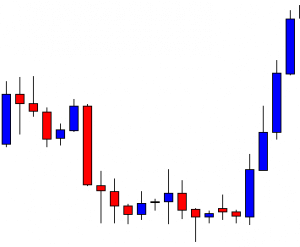
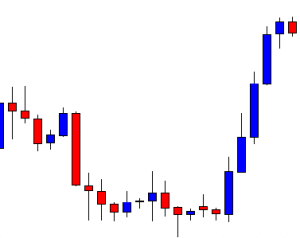
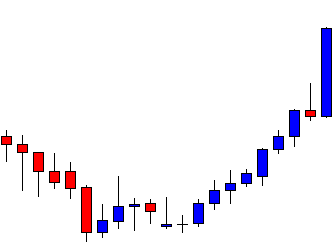
The H4 chart shows that the price heads towards the North with good bullish momentum. The price has not produced any bearish candles yet. The combination traders are to wait for the price to consolidate and produce a bullish reversal candle to go long in the pair.

The chart produces a bearish candle. The candle length suggests that the bull may show its strength in the next candle. If that happens, the buyers may find the opportunity to trigger a long entry.

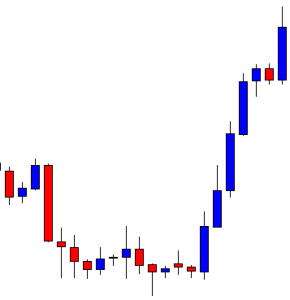
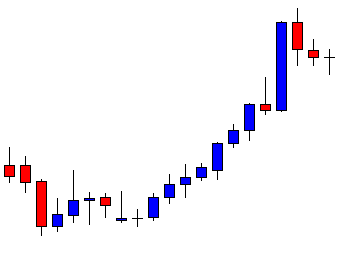
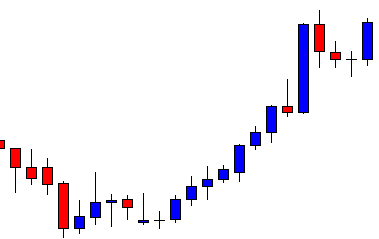
The chart produces a bullish engulfing candle closing well above consolidation resistance. The buyers may trigger a long entry right after the last candle closes. Let us proceed to the next chart to find out how the entry goes.

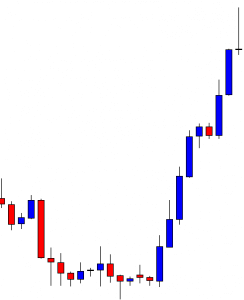
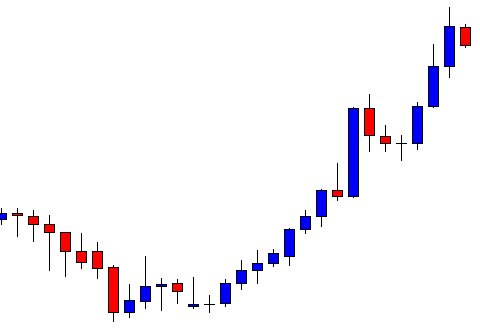
The price heads towards the North further. Do not forget to notice the upper wick’s length. It means buyers on the minor charts have had a feast here. Most probably, it is because of the Morning Star in the daily chart. When a daily chart produces a Morning Star, it usually attracts buyers in the minor charts and vice versa. Thus, keep your eyes on the daily chart and make full use of it when it produces such a strong reversal pattern.

Categories
Forex Daily Topic Forex Fibonacci

Fibonacci Trading: Fibonacci Levels Help Traders be Precise

Fibonacci Trading: Fibonacci Levels Help Traders be Precise

In today’s lesson, we are going to demonstrate an example of a chart where the price makes a bullish move from 78.6% Fibonacci level. The 78.6% Fibonacci level often makes the price reverse towards the trend’s direction. In today’s example, the price produces a Morning Star and heads towards the trend’s direction with good bullish momentum. Let us see how it happens.

It is an H4 chart. The price produces double bottom and heads towards the North with good bullish momentum. On its way, it produces only a single bearish candle. The buyers are to wait for the price to make a bearish correction and to get a bullish reversal candle to go long with a good risk-reward in the pair.

The chart produces a bearish inside bar. Then, it produces one more bearish candle. Look at the last candle. It comes out as a doji candle. It seems that the price may have found its support. A strong bullish reversal candle may attract the buyers to go long in the pair and push the price towards the North to make a new higher high.

The chart produces a bullish engulfing candle. The combination of the last three candles is called Morning Star. This is one of the strongest bullish reversal patterns in the Forex market. The buyers may trigger a long entry right after the last candle closes. They may set stop loss below the signal candle’s lowest low. We’ll find out the take-profit level in a minute. Let us first see how the trade goes here.

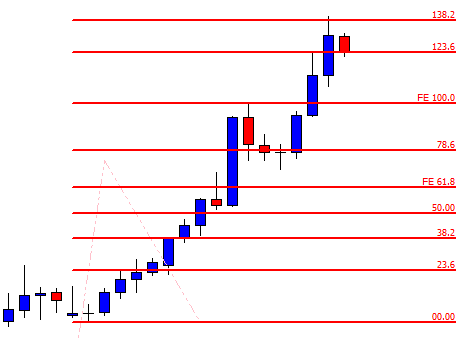
The price heads towards the trend’s direction with extreme bullish momentum. The last candle comes out as a bearish inside bar. It may make a bearish correction now. Some sellers may close their trade manually after the last candle. You may notice if they do that, they lose a few pips. How about if we knew that the price may make a bearish reversal from here before the last candle is produced. Yes, it is possible by using Fibonacci levels. Let us draw Fibonacci levels on the chart.

The chart shows that the price trends from 78.6% level. When the level of 78.6% makes the price move, it usually makes a reversal at 138.2%. Thus, if we set our take profit at 138.2%, we do not have to wait to get a bearish reversal candle to close our trade manually. It saves our time and gets us more pips too. This is why Fibonacci (extension/ retracement) is called a magic trading tool, since it helps traders in taking and exiting with precision.

Categories
Forex Price-Action Strategies

Price Action Trading: The Morning Star at a Breakout Level

Breakout is the first thing that attracts the price action traders to keep eying on a chart. Then, correction/consolidation followed by reversal candle breaching consolidation support/resistance is the signal to trigger an entry.

The breakout level plays an important role, which often becomes consolidation support/resistance and produces the reversal candle. Sometimes a breakout level produces even stronger reversal patterns such as Morning Star and Evening Star. When that happens, it attracts more traders and brings more liquidity. In today’s lesson, we are going to demonstrate an example where the breakout level holds the price as support; produces the Morning Star to offer a long entry. Let us get started.

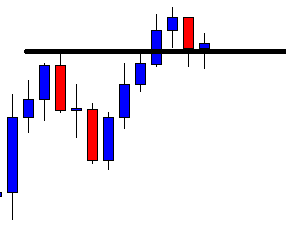
The chart shows that the price heads towards the North with good bullish momentum. On its way, it makes a breakout at the highest high. The pair then produces a bearish reversal candle to consolidate around the breakout level. The buyers are to keep an eye on this chart. If the breakout level produces a bullish engulfing candle closing well above consolidation resistance, they may trigger a long entry.

The chart produces a Doji candle (tiny bullish body with long shadows both sides). The breakout level holds the price, for which the buyers are going to be very keen to keep an eye on this pair. If the next candle comes out as a bullish engulfing candle, it would also form a candlestick pattern called Morning Star.

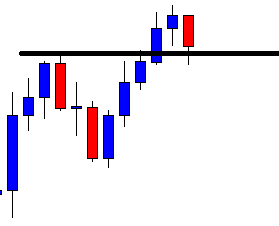
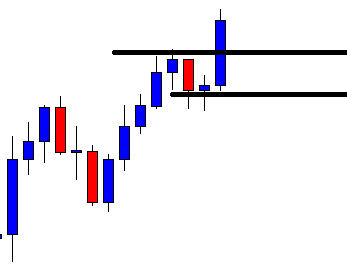
The chart produces a bullish engulfing candle closing well above consolidation resistance. A bullish engulfing candle is enough to attract the buyers to go long in this chart. The combination of the last three candle forms Morning Star, which is a strong bullish reversal candlestick pattern. The buyers may trigger a long entry right after the last candle closes. Stop Loss is to be set below the breakout level and Take Profit is to be set with 1R. Let us proceed to the next chart to see how the trade goes.

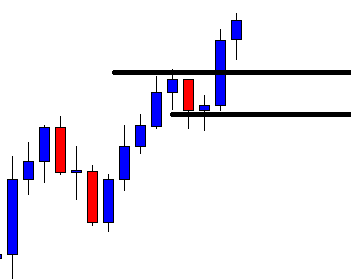
The next candle comes out as a bullish candle. The buyers seem to have taken control. The price may hit the target soon.

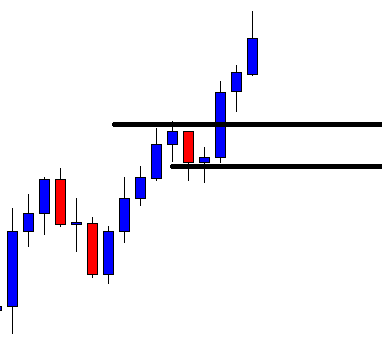
It takes only two candles to hit the target. Traders make some green pips in a hurry. If we analyze this trade, we find

  1. The price makes a bullish breakout and comes back at the breakout level.
  2. The breakout level works as support and holds the price
  3. It produces a bullish engulfing candle closing above consolidation resistance.
  4. It produces a candlestick pattern called Morning Star as well.
Categories
Forex Course

51. Fundamentals Of Candlestick Patterns

Introduction

In the previous course lessons, we have discussed the basics of candlesticks along with the pros and cons of using them. From this lesson, we will learn the basic candlestick patterns and their usage. As discussed, the idea of candlesticks charts has started in Japan in the late 1870s. These charts were then introduced to the outside world by Steve Nison through his first book, ‘Japanese Candlestick Charting Technique.’

In this lesson, let’s discuss the primary advantage of using candlestick charts. Although a single candlestick gives us many details about the price movement of an asset, a sequential set of candlesticks is more powerful. These sets are also known as patterns in simple trading language, and using these patterns, traders across the world take trading decisions.

Expert traders have decoded many such patterns and rigorously backtested them to analyze what those patterns will eventually result in. They also examined how the market direction will change after the appearance of these patterns on the charts. Now, let’s see the different candlestick patterns one must know.

Different types of candlestick patterns

There are single, dual, and triple candlestick patterns depending on how many candlesticks are involved in them. For example, if there are the candlestick pattern is formed by three candlesticks, it is known as the triple candlestick pattern. Every single pattern has its own significance and can be found in most of the Forex charts.

The main intention of identifying any candlestick pattern is to understand the further price movement in the market. Hence these patterns are classified into two different types – Continuation Patterns & Reversal Patterns. When we identify a continuation candlestick pattern on the chart, it means that the market will continue in the same direction as the underlying trend. Contrarily, if we identify a reversal pattern on the charts, we can expect the price to change its direction. Also, these patterns are internally classified as bullish and bearish continuous/reversal patterns, which will be discussed in the upcoming lessons.

Examples of Continuation Candlestick Patterns

  • Deliberation Pattern
  • Concealing Baby Swallow Pattern
  • Rising Three Methods Pattern
  • Separating Lines Pattern
  • Doji Star Pattern

Examples of Reversal Candlestick Patterns  

Some of these are single candlestick patterns, while some are multiple candlestick patterns. We shall be discussing each of these patterns in detail in our future articles.

Psychological context of candlestick patterns

The candlestick patterns demonstrate the psychological trading that takes place during the period represented by a single or multiple candles. We need to start imagining the price movement as a battle between buyers and sellers. Typically, Buyers expect that prices will increase and drive the price up through their trades. Whereas sellers bet on falling prices and push the price down with their selling interest.

Also, the Japanese gave very visual names to these patterns so that it impacts the mentality of a trader. For instance, pattern names like Hanging Man and Dark Cloud Cover represent negativity, while the patterns like Three White Soldiers and Morning Star indicate positive market results. Hence, as soon as we hear the names of these patterns, our sub-conscious memory will know whether the forecast of the market is positive or negative.

Benefits of trading candlestick patterns

Although initially conceived for daily timeframes, Candlestick patterns can be used by swing traders, day traders, and even long term investors. Below are some of the significant advantages of these patterns.

  • They are very easy to identify and comprehend. They provide a detailed description of the occurrences and happenings in the markets.
  • Interaction between the buyers and sellers can easily be understood just by reading the pattern and without having to analyze the market entirely.
  • Candlestick patterns can be used in conjunction with other indicators for extra confirmation on the trading signals generated.
  • They display reversal patterns that cannot be seen in other charts like Line & Bar charts.

That’s about the introduction to Candlestick patterns. In our upcoming lessons, we will discuss different candlestick patterns and how to generate trading signals using these patterns. So, stay tuned.

[wp_quiz id=”60271″]
Categories
Forex Basic Strategies Forex Trading Strategies

Trading The Morning Star Candlestick Pattern Like A Pro!

Introduction

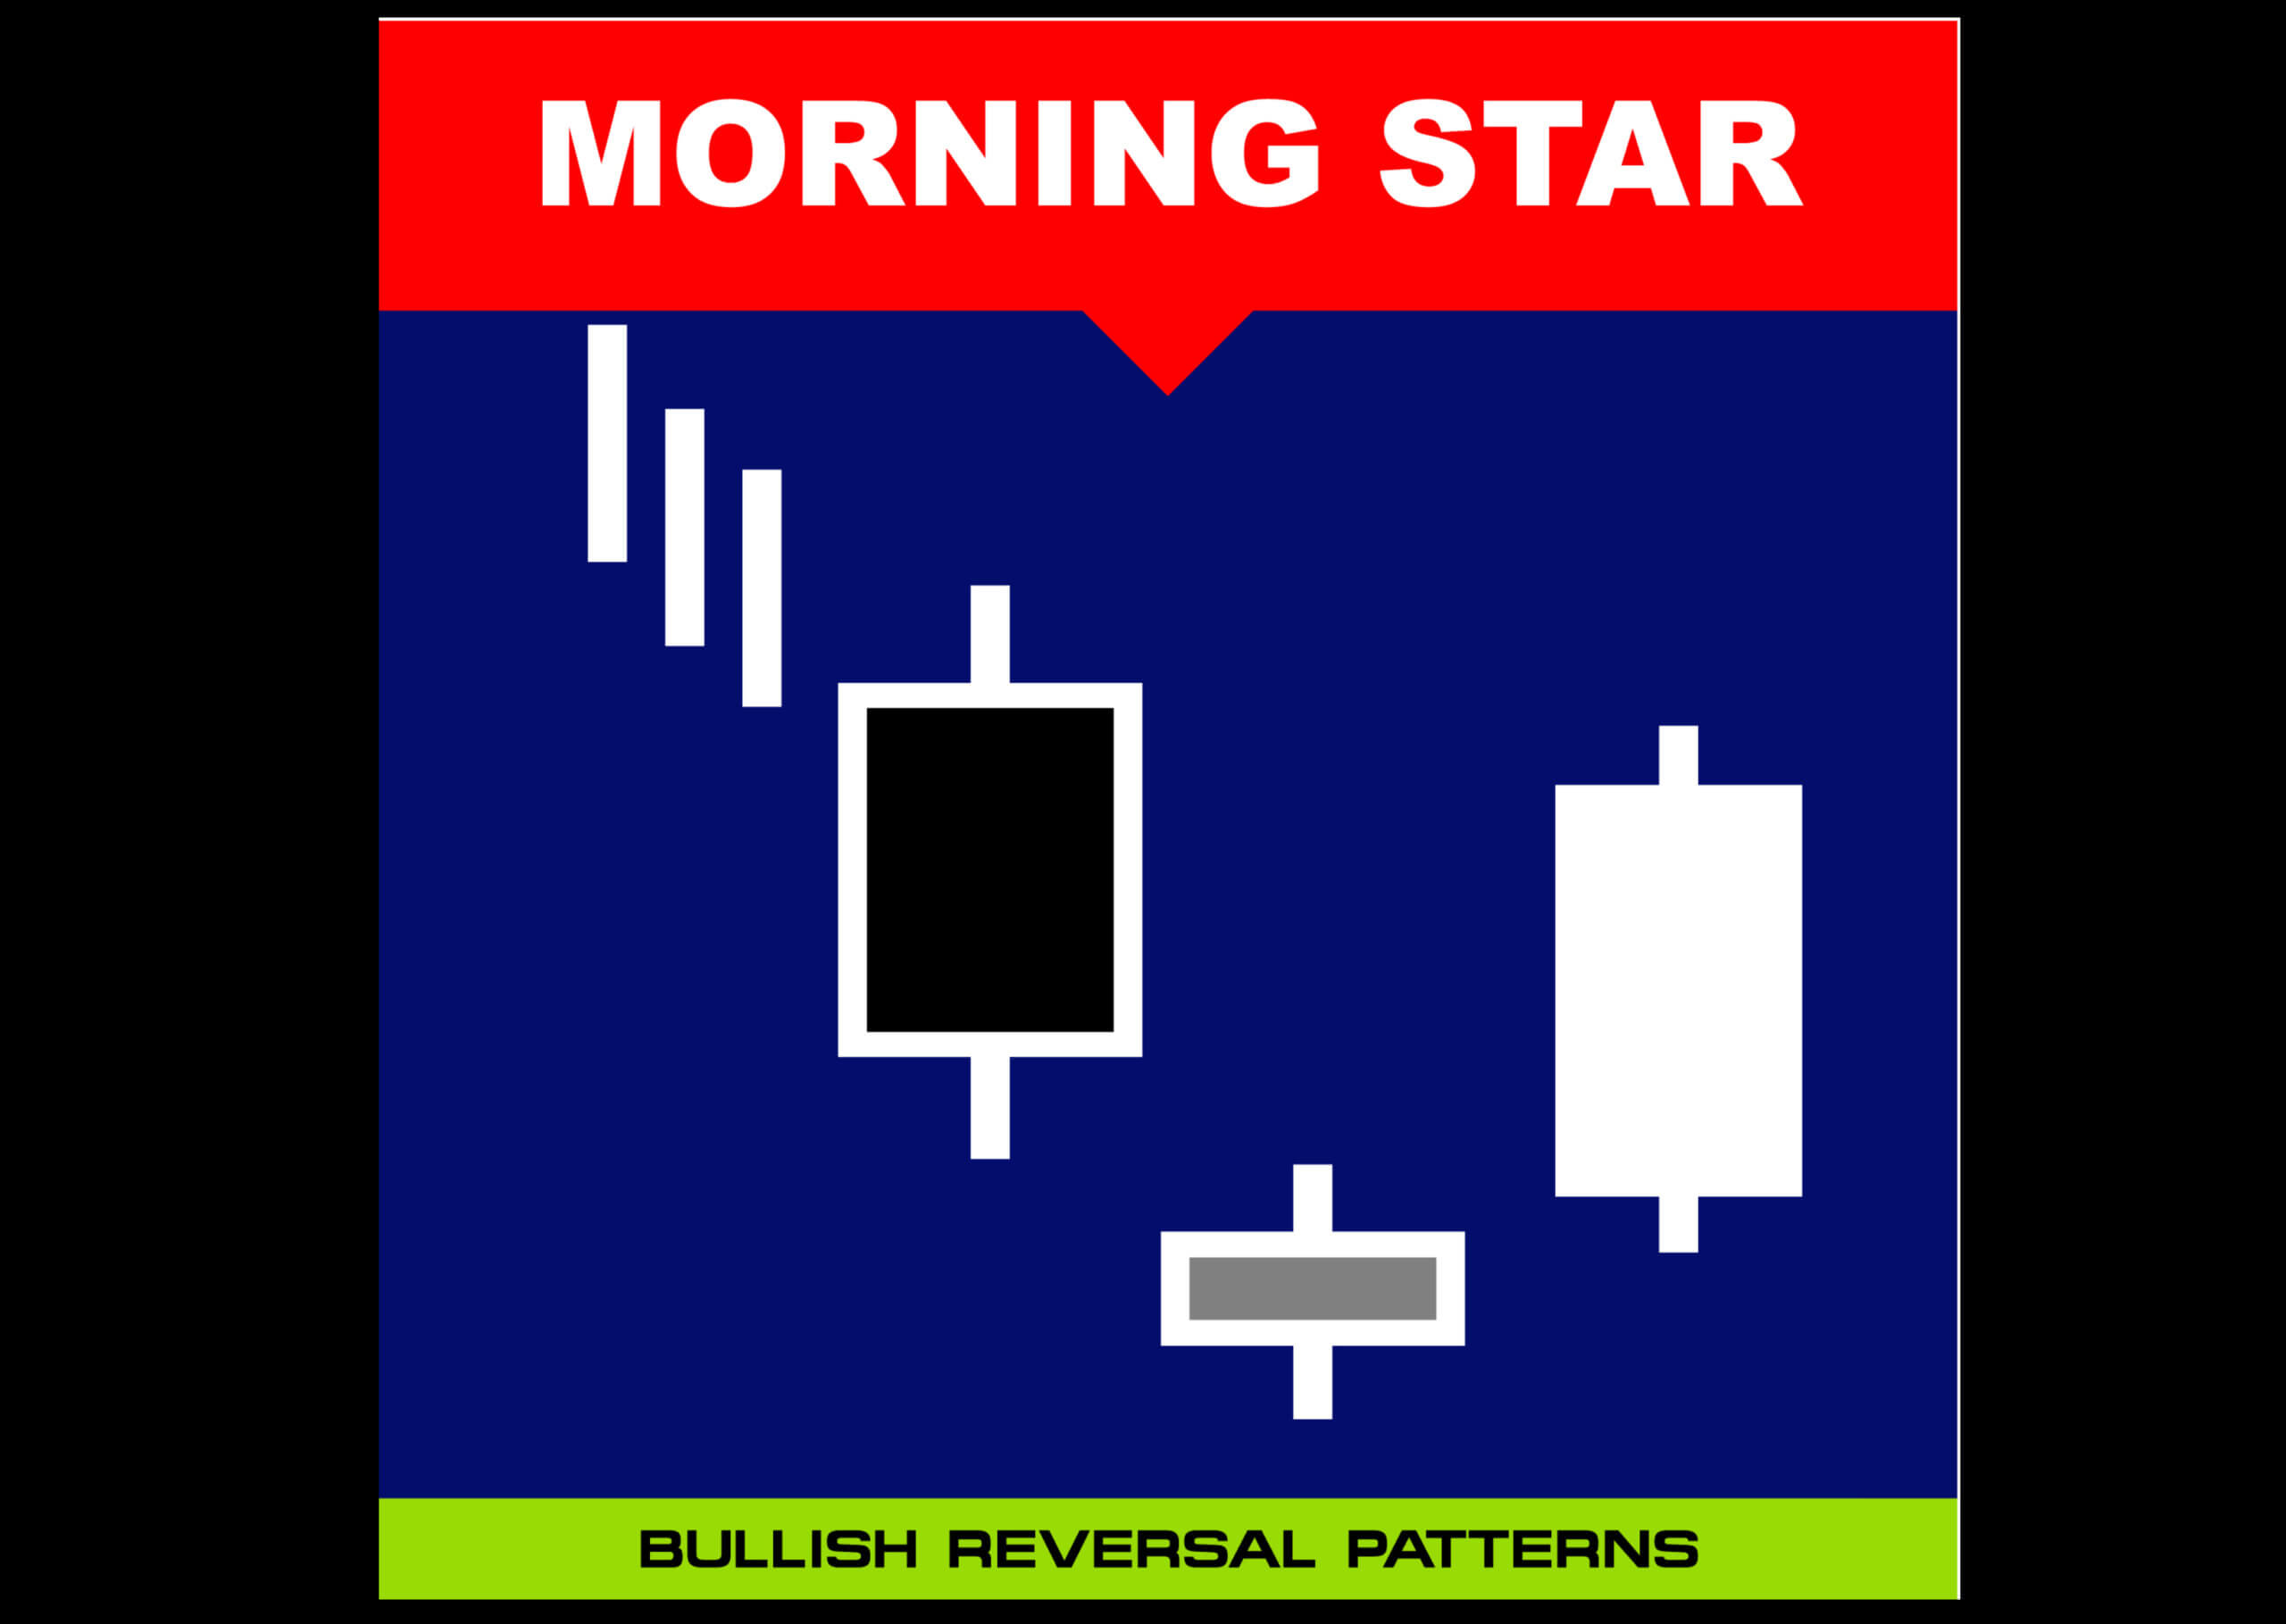
Morning star is a bottom reversal pattern, and it primarily consists of three candlesticks that indicate the bullish sign. This pattern warns the weakness in an ongoing downtrend that, in turn, suggests the start of an uptrend. Traders observe the formation of a Morning Star pattern on the price chart, and then they can confirm it with other technical tools.

The Three Candlesticks Of Morning Star Pattern

  • Large Bearish Candle
  • Small Bullish or Bearish Candle
  • Large Bullish Candle

The most fundamental thing to remember is that the market should be in a downtrend to trade the Morning Star pattern. To confirm the downtrend, mark the lower lows and lower highs.

Large Bearish Candle is the first part of the Morning star reversal pattern. The bearish candle indicates the bears are in complete control, which means the continuation of the selling pressure. At this point in the market, we should only be looking for the sell trades as there is no sign of reversal yet.

Small Bullish/Bearish Candle is the second candle that begins with a bearish gap down. This candle indicates that the sellers fail to push the price lower, despite trying really hard. The price action ends up forming a quite small bullish/bearish or Doji candle. If this candle is a small bullish candle, it’s an early sign of trend reversal.

Large Bullish Candle is the third candle that holds the most significance because the real buying pressure is revealed in this candle. If this candle begins with a buying gap, and if buyers can push the prices higher by closing the candle even above the first red candle, it is a definite indication of a trend reversal.

Trading strategy – Morning Star Candlestick Pattern

As we know by now, the Morning star is a reversal pattern. It mainly indicates the bulls taking over the trend while the bears lose the grip. Most of the beginners tend to trade the Morning Star pattern stand-alone. But we do not recommend this as it is not reliable enough. Always pair this pattern with some other credible indicators, support resistance levels, or trend lines to make profitable trades.

Morning Star Pattern + Volume

In this strategy, we have paired the Morning Star pattern with the volume. The volume plays a significant role in pattern formations. If the first red candle shows a low volume, it is a good sign for us. Then, if the second candle is green and the volume rises, it indicates the buying pressure. Lastly, the long green candle’s volume must be high. The high volume on the last candle shows the confirmation of the upcoming buy trend. If the third bullish candle has low volume, then try avoiding that Morning Star Pattern because the volume is not indicating the bullish reversal. If you observe the third candle closing with high volume, take up the buying position and ride the uptrend until there are any indications of a trend reversal.

Confirm the downtrend on the trading timeframe

Confirmation is very important because, if there is no downtrend, there’s no point in trading the Morning Star pattern. You can confirm the downtrend on a higher timeframe or on your trading timeframe. As you can see in the below image, the overall trend of the CAD/CHF Forex pair was down.

Find out the Morning star pattern on your trading timeframe

As you can see in the below CAD/CHF chart, the market prints the Morning Star pattern by following all the rules of our strategy. The first red candle was with low volume, and the second one was a small red candle. Hence there is no indication to go long in this pair yet. The very next was a long green candle with high volume. This is a strong indication of a trend reversal.

Entry, Take Profit and Stop Loss

We should be entering the trade when the next green candle closes. There are so many different ways to book profit. We can close the position at any resistance area or supply-demand zone. In this trade, we hold our positions because we took the trade from the beginning of a new trend. You can also close your positions when the price goes near the higher timeframe’s significant resistance level.

Pairing this pattern with volume makes it more reliable to trade. So it is a good idea to place the stop loss just below the second candle. In the above picture, you can see that we have put the stop loss just below the second candle, and we have also booked the profit at the higher timeframe’s major resistance area.

Reliability of Morning Star Pattern

This pattern is very easy to identify on the price chart if you are an intermediate trader. Even novice traders can easily spot it on the chart with little practice. Morning Star pattern often gives us well-defined entries and good risk-reward ratios. The only limitation of this pattern is that, if the sellers are strong enough, the prices could go further down despite the formation of the Morning Star Pattern. Hence it is always recommended to combine this pattern with some other trading tools rather than trading it stand-alone.

We hope you find this article informative. Try trading this pattern when you see a perfect downtrend next time. Let us know how the results have been in the comments below. Cheers!