Categories
Forex Daily Topic Forex Price Action

Weekly High/Low Breakout Trading: Count the Breakout Candle’s Attributes

In today’s lesson, we are going to demonstrate an example of an H4 breakout at the last week’s high. However, the price does not head towards the North as it usually does. Let’s find out why that happens.
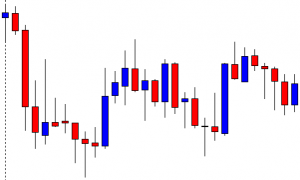
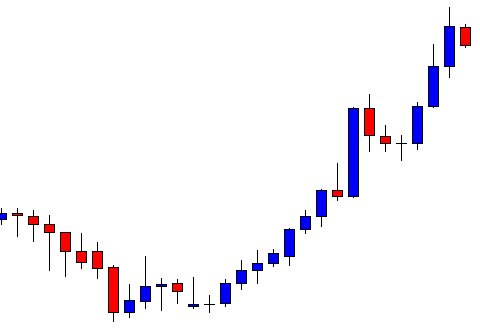
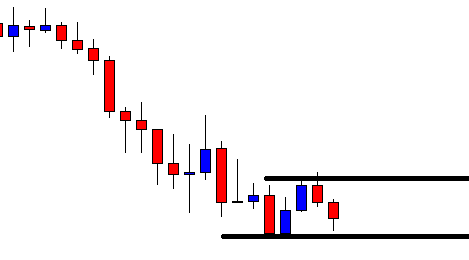
The chart shows that the price after making a strong bearish move gets choppy. The H4 traders may wait for the price to make a breakout at either side. A bullish breakout may attract the buyers to go long in the pair. On the other hand, the sellers may wait for the price to make a bearish breakout.
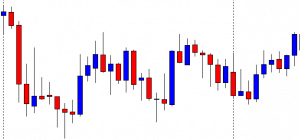
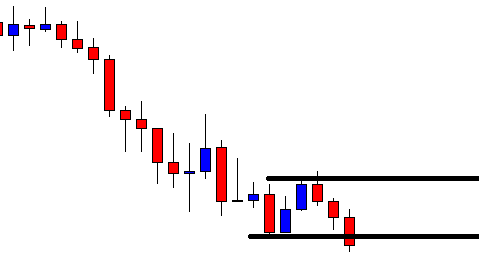
The price produces a bearish candle to start the next week. The price finds its support, and it heads towards the North. However, the last weekly high is still intact. The buyers must wait for the breakout at the level to go long.
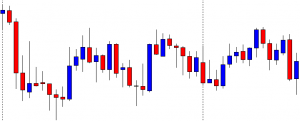
The price finds its intraweek resistance. It comes down. Intraweek support holds the price and produces a bullish inside bar. It is not a strong bullish reversal candle. However, it is produced at double bottom support. Let us wait and see whether it makes a breakout at the neckline or not.
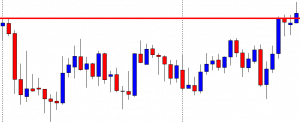
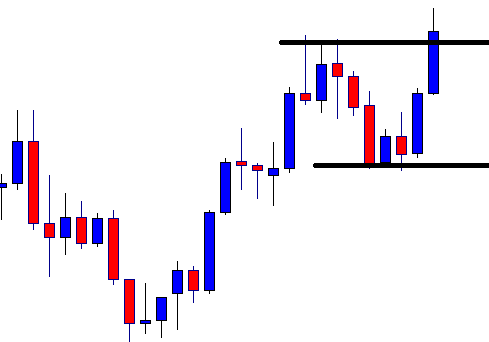
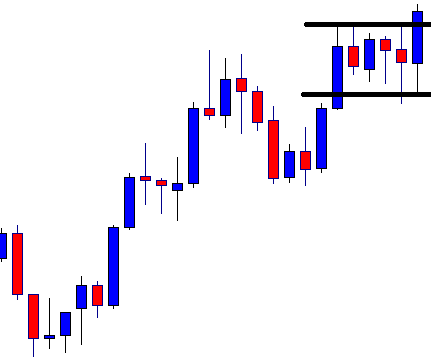
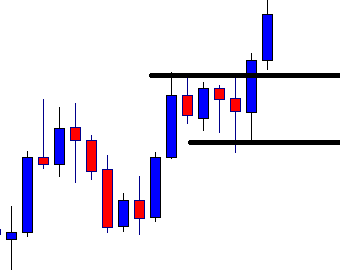
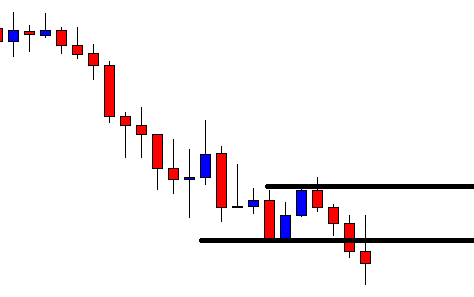
The price heads towards the North and makes a breakout at the neckline. The candle closes within the last week’s high and consolidates. It then produces a bullish candle closing above the last week’s high. However, the candle has a long upper shadow. Considering its upper shadow, traders do not usually get attracted to trade upon such a breakout candle.
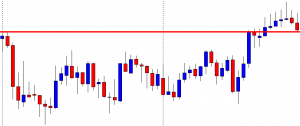
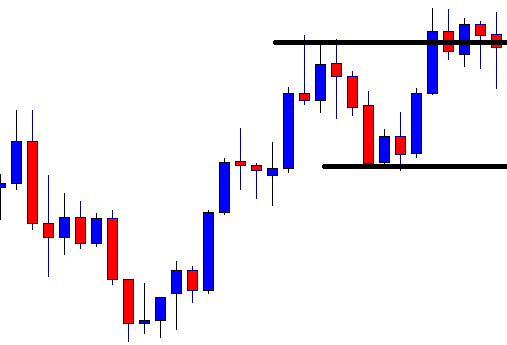
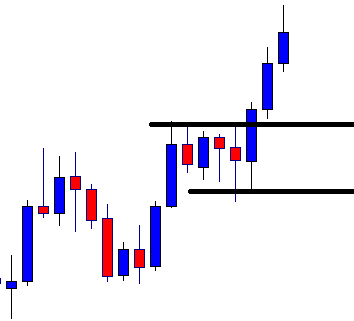
As anticipated, the chart produces some bullish candles with long upper shadow after the breakout. The price heads towards the North with a sluggish pace. It then produces a bearish Pin Bar and drives the price towards the breakout level again. A bullish reversal candle closing above consolidation resistance may attract the buyers to go long in the chart again. Let us find out what happens next.
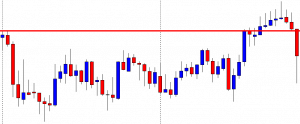
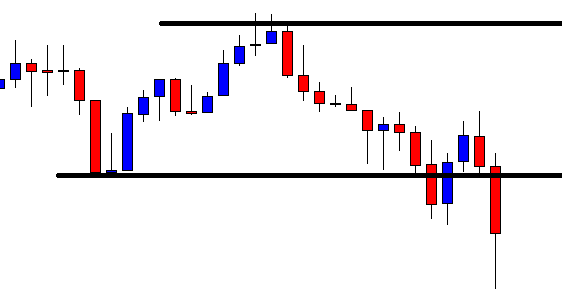
The chart produces a long bearish candle with long lower shadow. The pair is trading within the last week’s range again. The H4 buyers have lost their hope. They may skip eying on the chart to concentrate on somewhere else.

If we look back, a double bottom, along with a breakout at the last week’s high, do not push the price towards the North. Most probably, this is because of the breakout candle’s attributes. We may still keep an eye on such a chart, but it would be wise to concentrate more on those charts, which makes a breakout with a commanding candle.


Categories
Forex Daily Topic Forex Fibonacci

Fibonacci Trading: Fibonacci Levels Help Traders be Precise

Fibonacci Trading: Fibonacci Levels Help Traders be Precise

In today’s lesson, we are going to demonstrate an example of a chart where the price makes a bullish move from 78.6% Fibonacci level. The 78.6% Fibonacci level often makes the price reverse towards the trend’s direction. In today’s example, the price produces a Morning Star and heads towards the trend’s direction with good bullish momentum. Let us see how it happens.

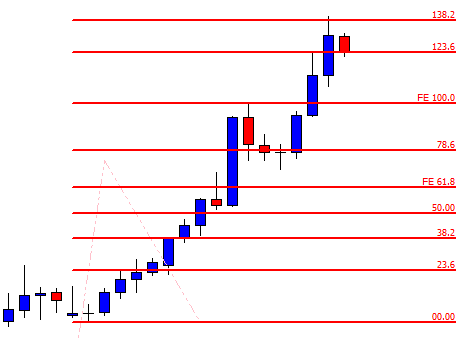
It is an H4 chart. The price produces double bottom and heads towards the North with good bullish momentum. On its way, it produces only a single bearish candle. The buyers are to wait for the price to make a bearish correction and to get a bullish reversal candle to go long with a good risk-reward in the pair.

The chart produces a bearish inside bar. Then, it produces one more bearish candle. Look at the last candle. It comes out as a doji candle. It seems that the price may have found its support. A strong bullish reversal candle may attract the buyers to go long in the pair and push the price towards the North to make a new higher high.

The chart produces a bullish engulfing candle. The combination of the last three candles is called Morning Star. This is one of the strongest bullish reversal patterns in the Forex market. The buyers may trigger a long entry right after the last candle closes. They may set stop loss below the signal candle’s lowest low. We’ll find out the take-profit level in a minute. Let us first see how the trade goes here.

The price heads towards the trend’s direction with extreme bullish momentum. The last candle comes out as a bearish inside bar. It may make a bearish correction now. Some sellers may close their trade manually after the last candle. You may notice if they do that, they lose a few pips. How about if we knew that the price may make a bearish reversal from here before the last candle is produced. Yes, it is possible by using Fibonacci levels. Let us draw Fibonacci levels on the chart.

The chart shows that the price trends from 78.6% level. When the level of 78.6% makes the price move, it usually makes a reversal at 138.2%. Thus, if we set our take profit at 138.2%, we do not have to wait to get a bearish reversal candle to close our trade manually. It saves our time and gets us more pips too. This is why Fibonacci (extension/ retracement) is called a magic trading tool, since it helps traders in taking and exiting with precision.

Categories
Forex Price-Action Strategies

Breakout With and Without Momentum

A Breakout without momentum often does not push the price towards the trend. The price seems to come back at the breakout level again. On the other hand, a breakout with momentum pushes the price towards the trend in most of the cases. In today’s lesson, we are going to demonstrate a chart, which has two types of breakouts. Let us get started.

The chart shows that it heads towards the North. Upon finding its resistance, it makes a bearish correction. It finds its support and produces a bullish engulfing candle. The price heads towards the North again. It makes a breakout with a candle having a long upper shadow. It is a breakout. However, the breakout takes place with two bullish candles. Let us proceed to the next chart to find out what the price does.

Despite making a breakout, the price does not head towards the North. It rather consolidates around the breakout level. The breakout level still holds the price. Nevertheless, it does not look that good for the buyers. The price may come back within those two levels and hit the lower support. Let us find out what happens next.

The price does not come back within the breakout level. It makes another breakout at consolidation resistance. It takes only one candle to make the breakout. Breakout traders want to get this kind of breakout to trigger a long entry. The buyers may trigger a long entry right after the last candle closes by setting stop loss below consolidation support and by setting take profit with 1R.

The price heads towards the North with good bullish momentum. The next candle comes out as a strong bullish candle. It suggests that the bull has taken control. It seems the price may hit 1R in a hurry as well. This is what the breakout traders want.

As anticipated, the chart produces another bullish candle and hits the target. It takes two candles to achieve 1R. It gives traders more confidence about the strategy and saves their time. They can concentrate on other charts to look for entries. It does not mean it goes like this every single time though.

The above charts show that a breakout by two candles does not generate the momentum towards the trend. However, when the breakout takes place with a single candle, the price heads towards the trend’s direction in no time. Thus, if we do not want to hang around with our entries and keep an amazing winning rate, we may take entries on a breakout that takes place with good momentum.

Categories
Forex Price-Action Strategies

The Benefit of Checking Minor Chart before Taking Entry

In one of our lessons, we have learned that when a breakout confirmation candle comes out with a long upper or lower shadow needs to be checked on the 15-min chart. The last 15 M candle plays a significant role to drive the price towards the breakout direction. A breakout confirmation candle with a long upper or lower shadow does not mean that the last 15M candle comes out as a reversal candle. We are going to demonstrate an example of this in today’s lesson.

The price after being bearish finds its support. The chart produces two bullish candles consecutively. A level of resistance produces a bearish reversal candle. The correction length looks good. Let us proceed to the next chart.

The next candle comes out as a bearish candle as well. However, it closes within the consolidation support. The sellers are to wait for a candle to breach the level closing well below it. It is waiting time for the sellers.

The last candle breaches through the consolidation support. The breakout does not look an explicit breakout. However, it closes below the level. If the next candle closes below the breakout level, that would confirm the breakout. The breakout confirmation candle holds the key for the sellers.

The last candle closes below the breakout candle. This confirms the breakout. However, look at the long lower spike. This looks ominous for the sellers. In naked eyes, it does not look to be a good confirmation candle for the sellers to trigger a short entry. Let us now flip over to the 15 M chart and find out how the last candle comes out.

This is the 15 M chart. The last candle is a strong bearish candle despite having a long lower spike. We do not need to flip over to any minor chart here. This means the pair is having a strong bearish momentum in the 15 M chart, which is a signal for the sellers to trigger a short entry.

As expected, the next candle comes out as a bearish candle. It seems that the price is going to hit 1R in a hurry. Let us proceed to the next chart to find out how the trade goes.

The price heads towards the South with one more candle. It hits the take profit level (1R) with ease. The price may make a more bearish move as well. The trade setup with a less promising breakout confirmation candle works wonderfully well for the traders. Do not forget to check the 15 M chart if the confirmation candle has a long upper/lower shadow. It may help you decide which entry to take and which one not to.