Categories
Forex Daily Topic Forex Price Action

Weekly High/Low Breakout Trading: Count the Breakout Candle’s Attributes

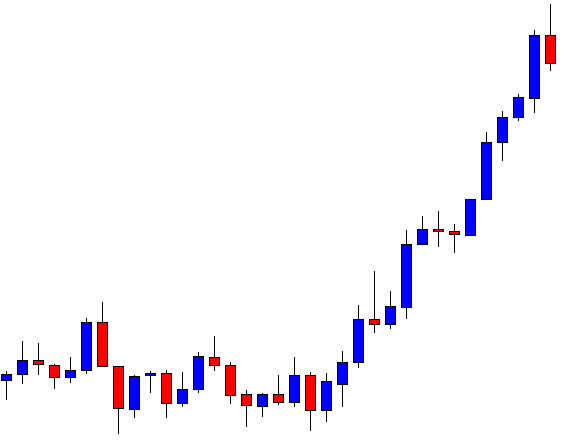
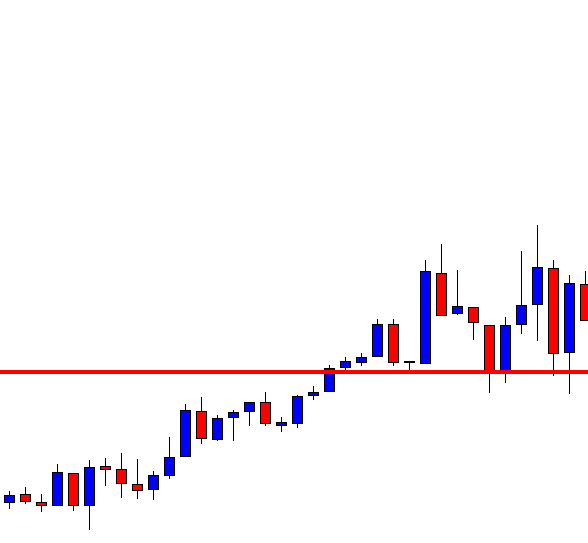
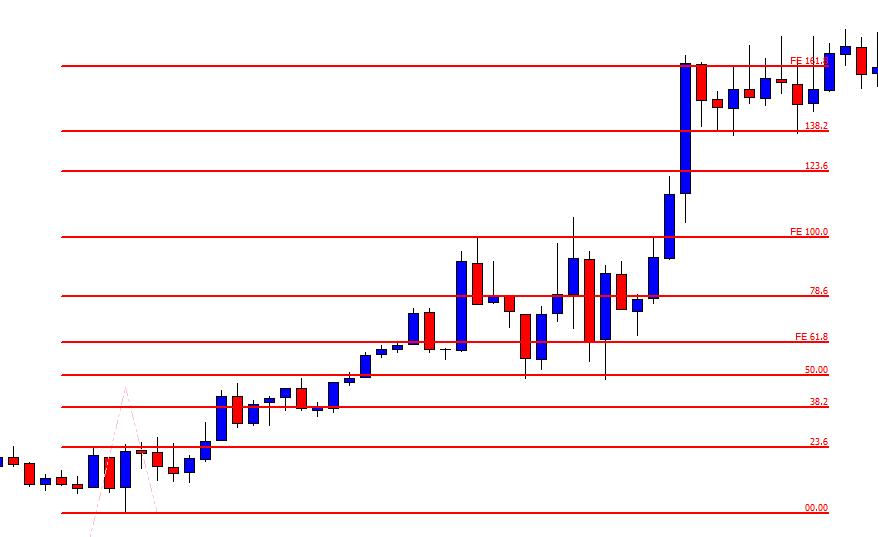
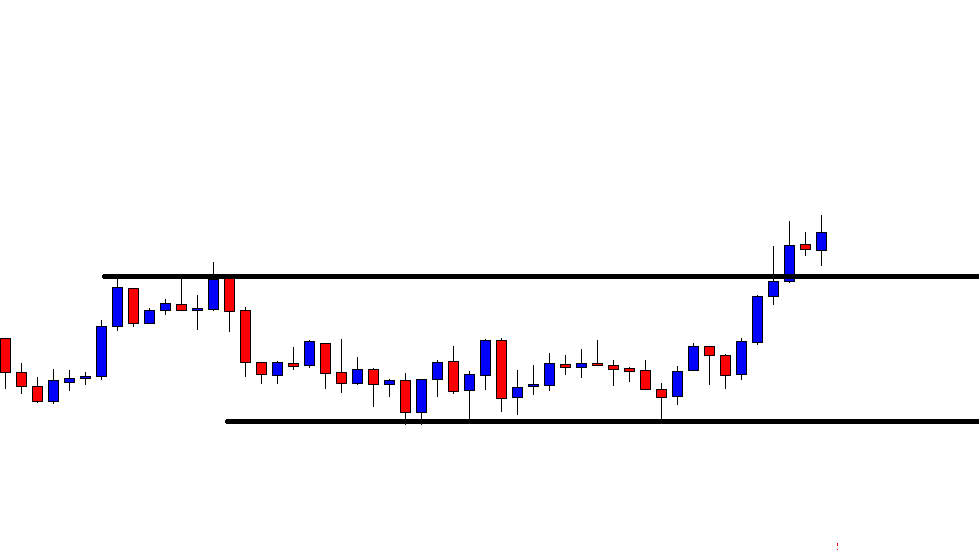
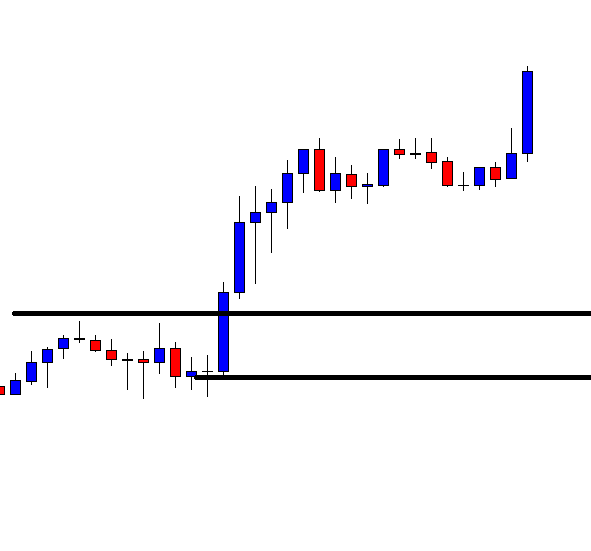
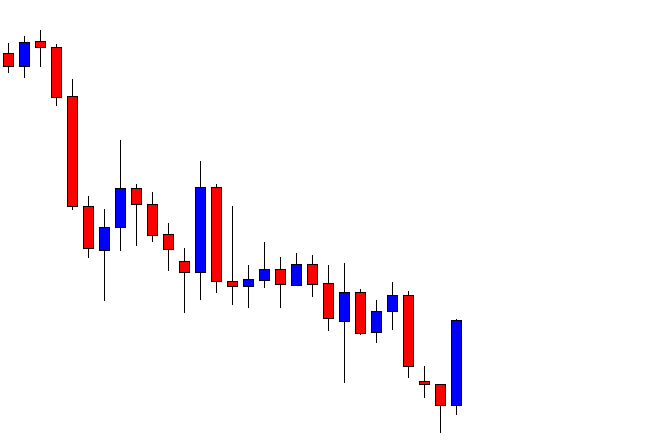
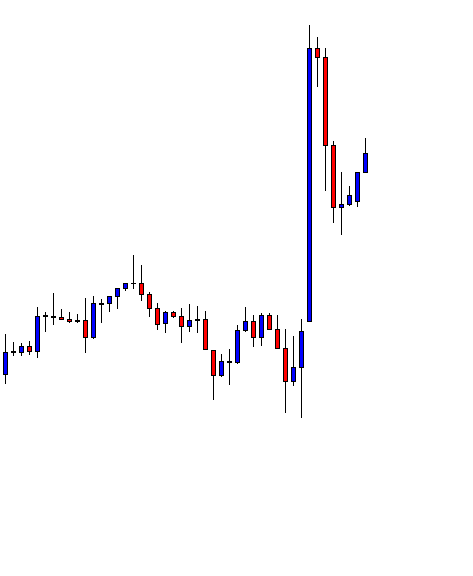
In today’s lesson, we are going to demonstrate an example of an H4 breakout at the last week’s high. However, the price does not head towards the North as it usually does. Let’s find out why that happens.

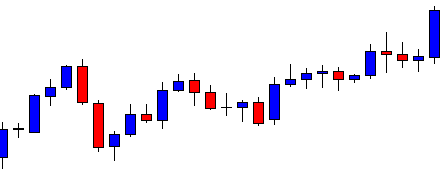
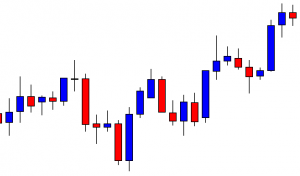
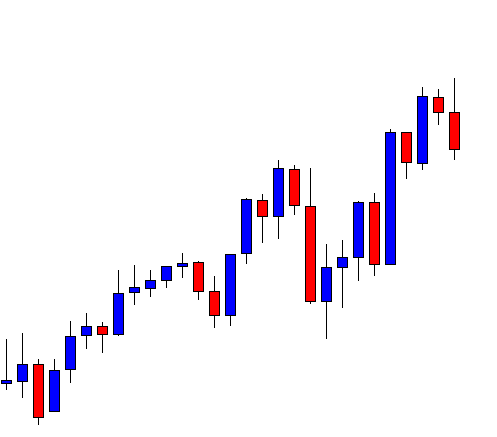
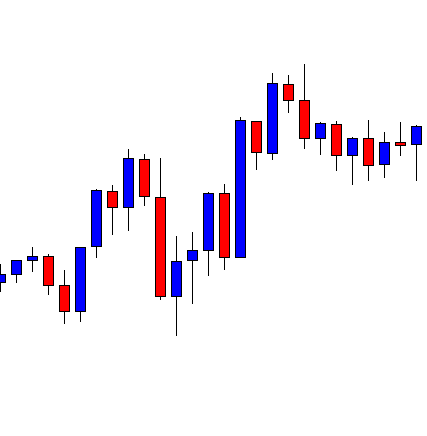
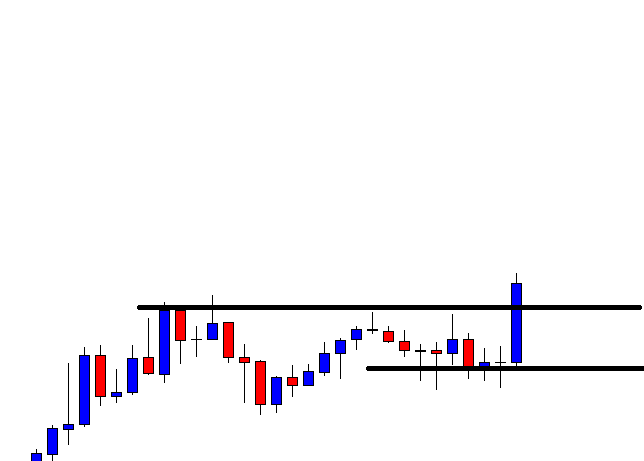
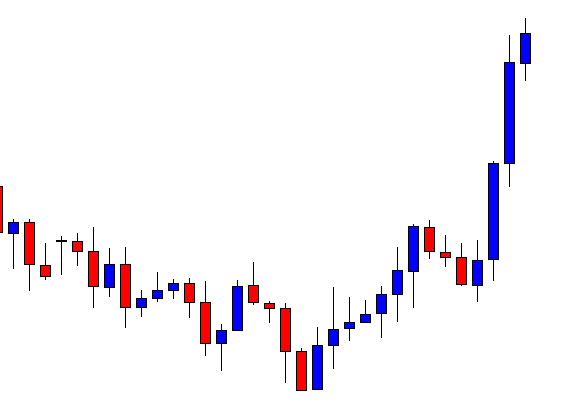
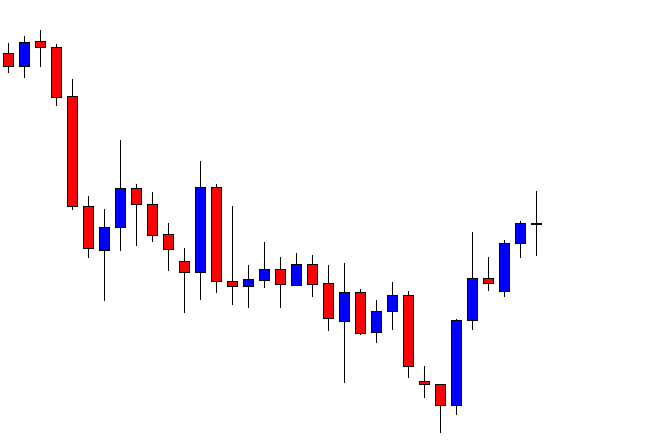
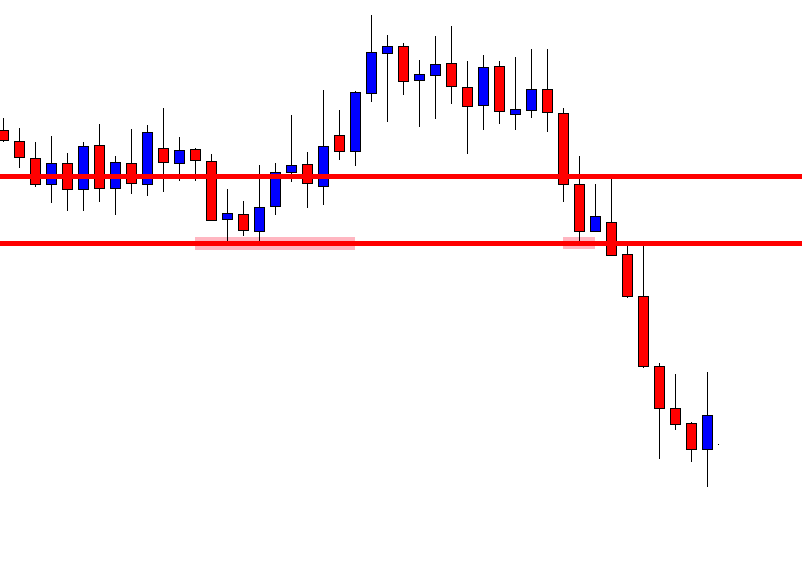
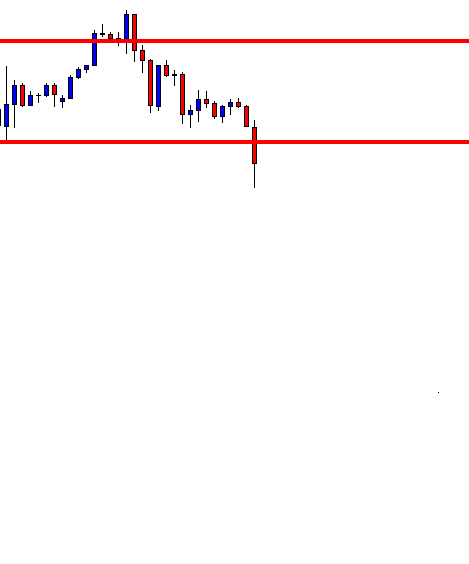
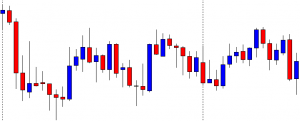
The chart shows that the price after making a strong bearish move gets choppy. The H4 traders may wait for the price to make a breakout at either side. A bullish breakout may attract the buyers to go long in the pair. On the other hand, the sellers may wait for the price to make a bearish breakout.

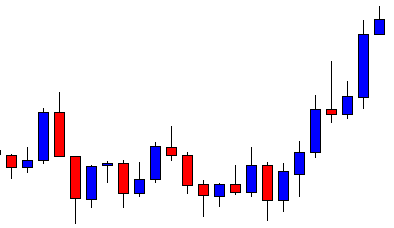
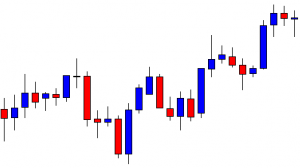
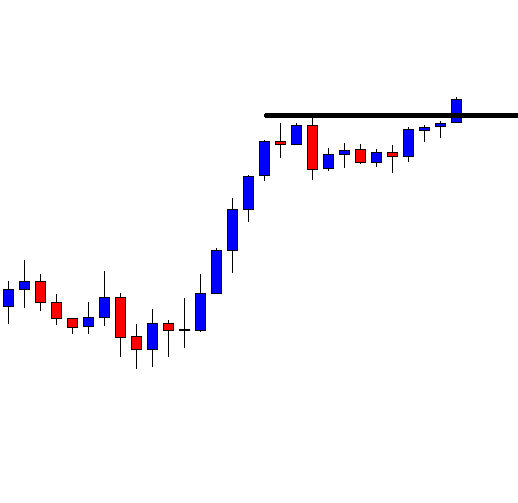
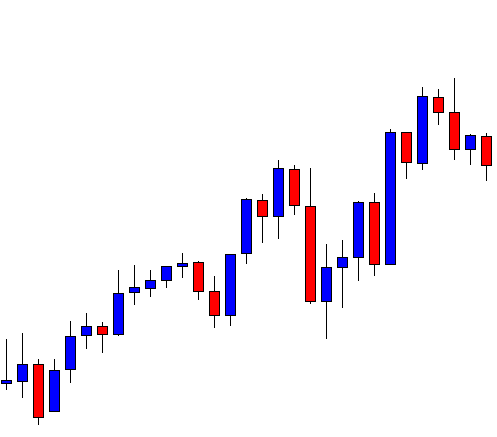
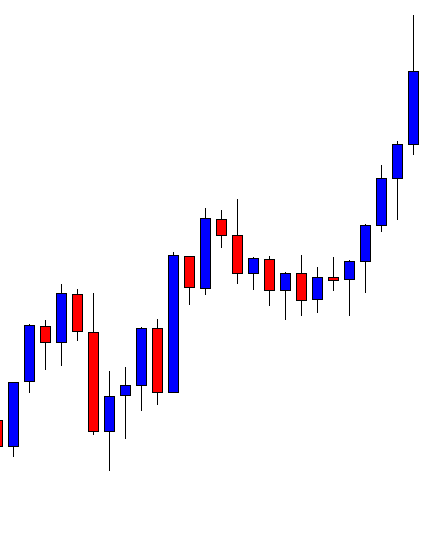
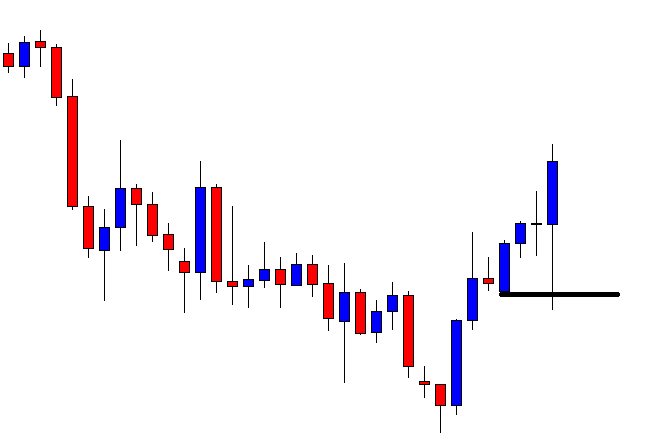
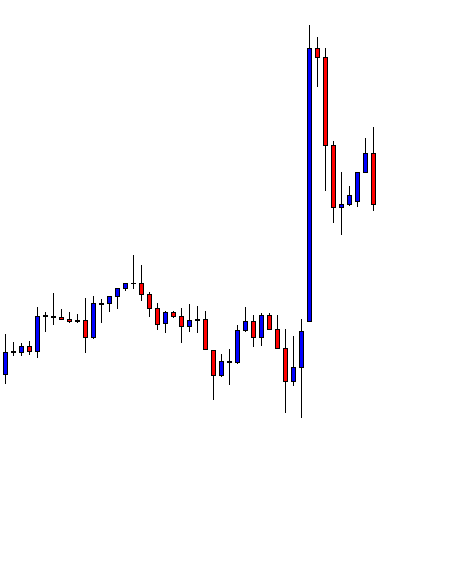
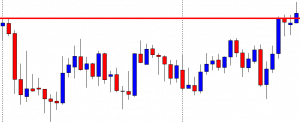
The price produces a bearish candle to start the next week. The price finds its support, and it heads towards the North. However, the last weekly high is still intact. The buyers must wait for the breakout at the level to go long.

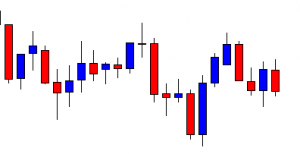
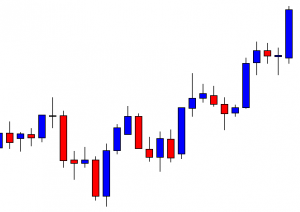
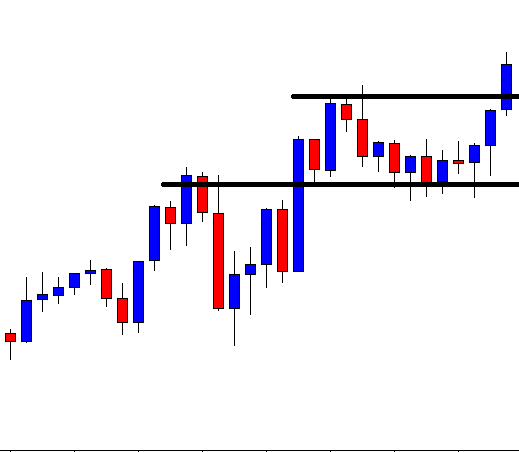
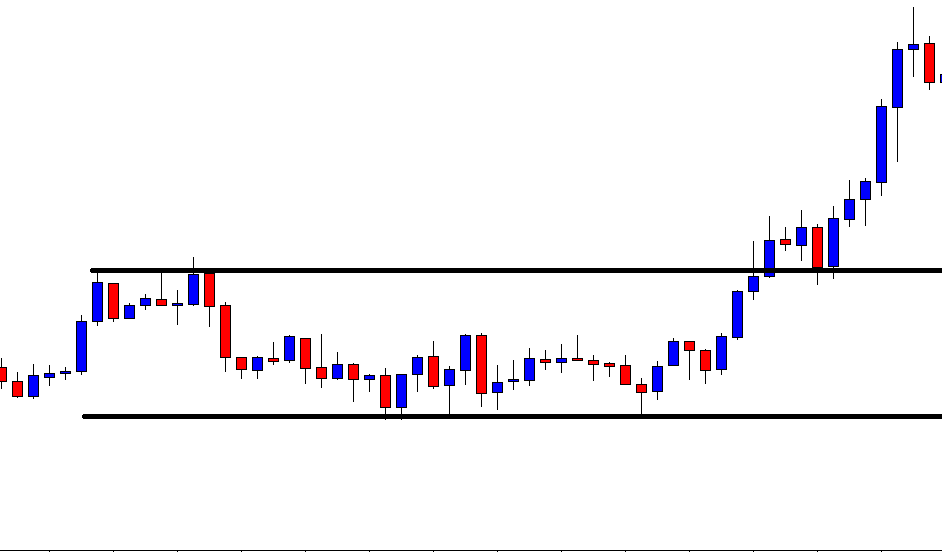
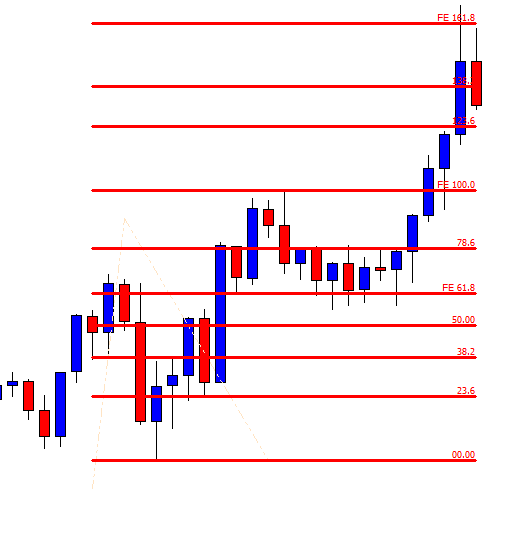
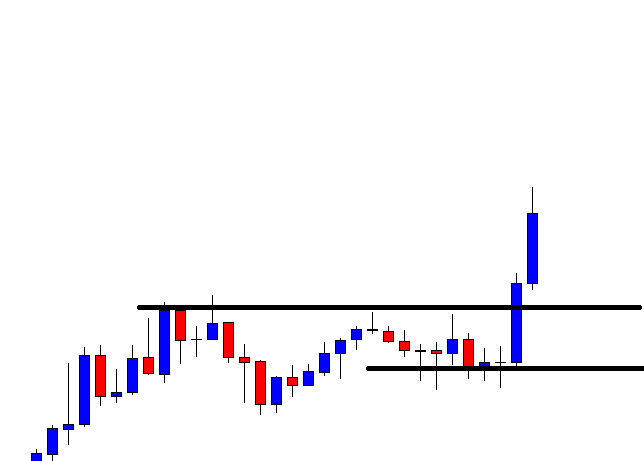
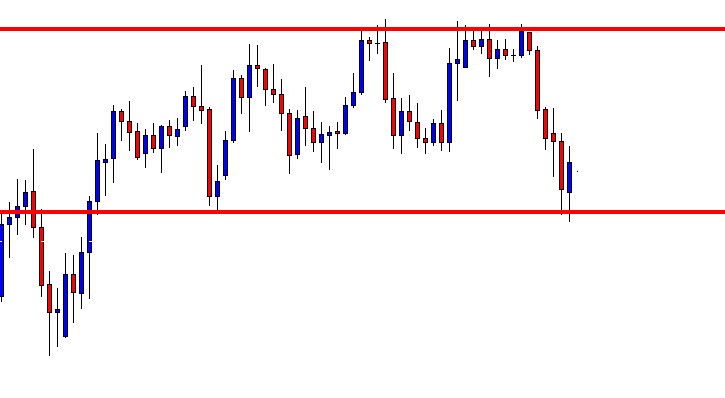
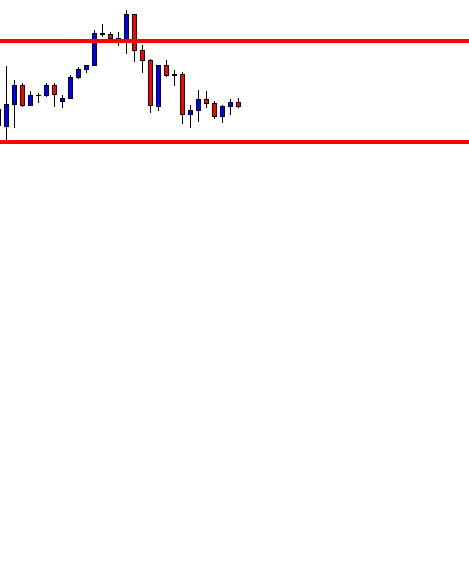
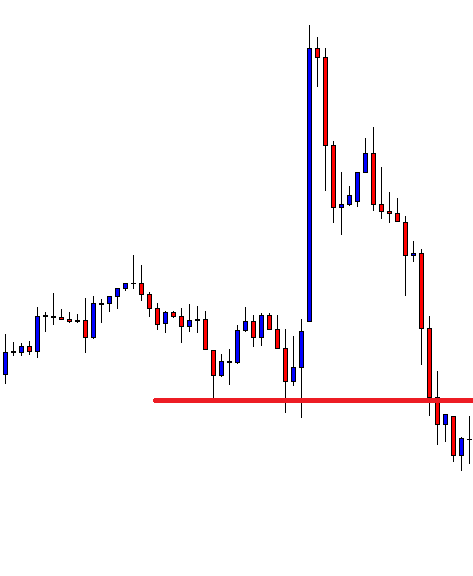
The price finds its intraweek resistance. It comes down. Intraweek support holds the price and produces a bullish inside bar. It is not a strong bullish reversal candle. However, it is produced at double bottom support. Let us wait and see whether it makes a breakout at the neckline or not.

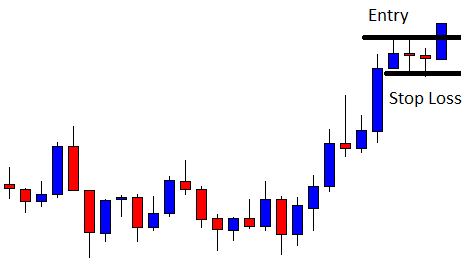
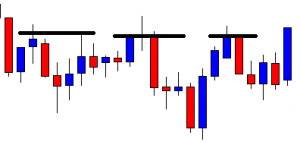
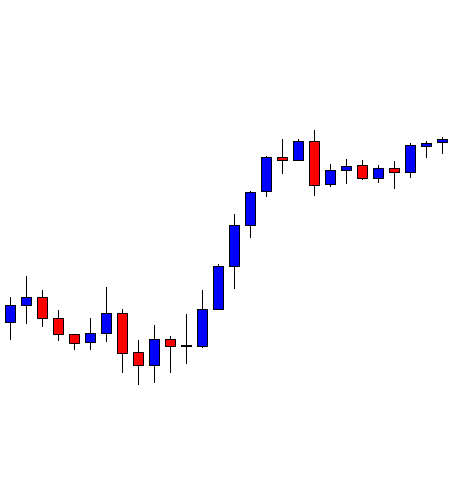
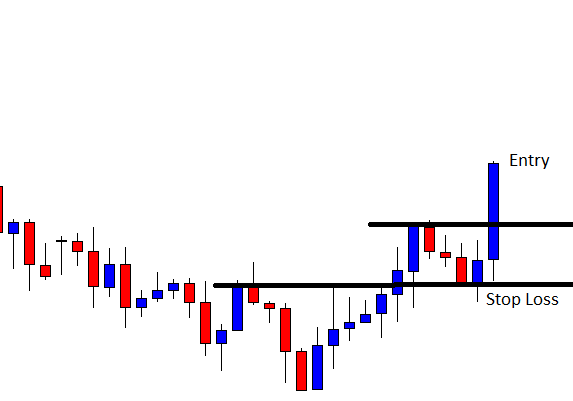
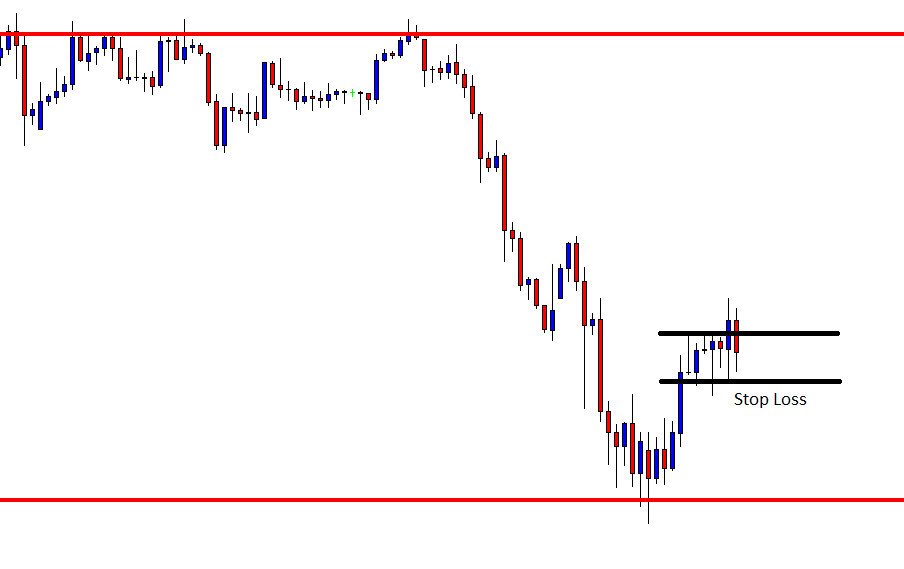
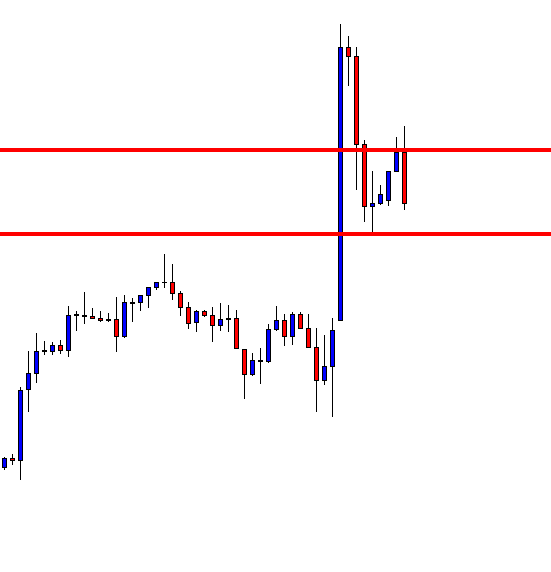
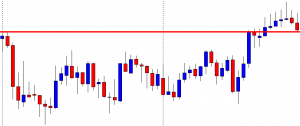
The price heads towards the North and makes a breakout at the neckline. The candle closes within the last week’s high and consolidates. It then produces a bullish candle closing above the last week’s high. However, the candle has a long upper shadow. Considering its upper shadow, traders do not usually get attracted to trade upon such a breakout candle.

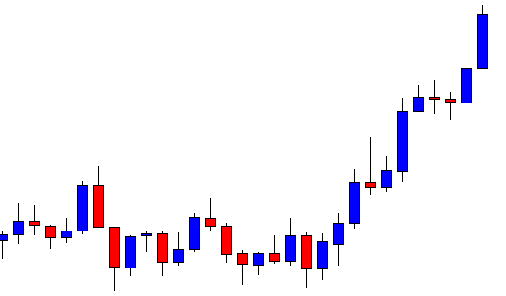
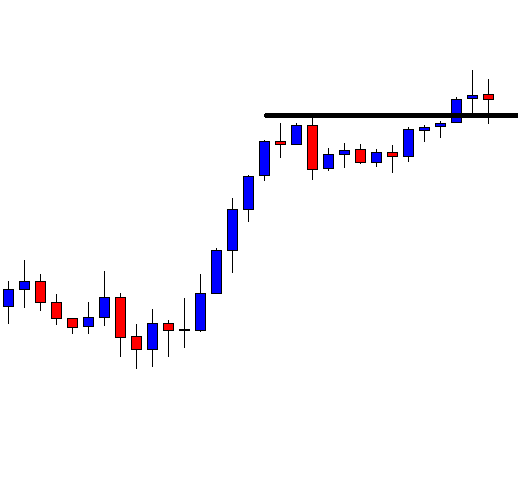
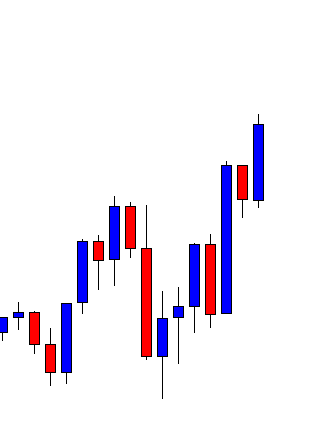
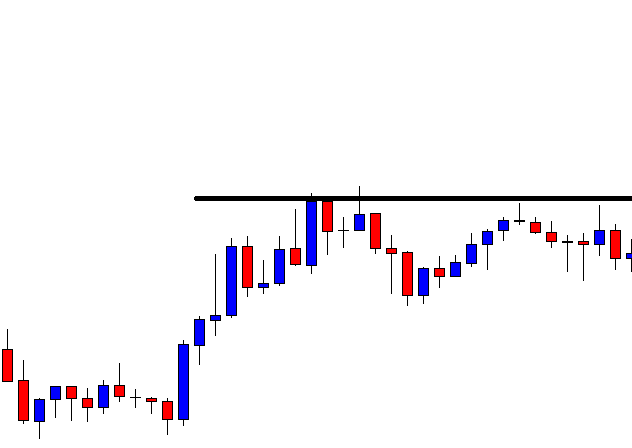
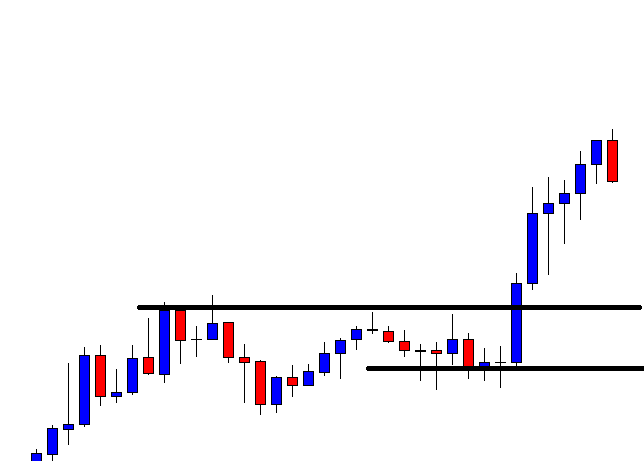
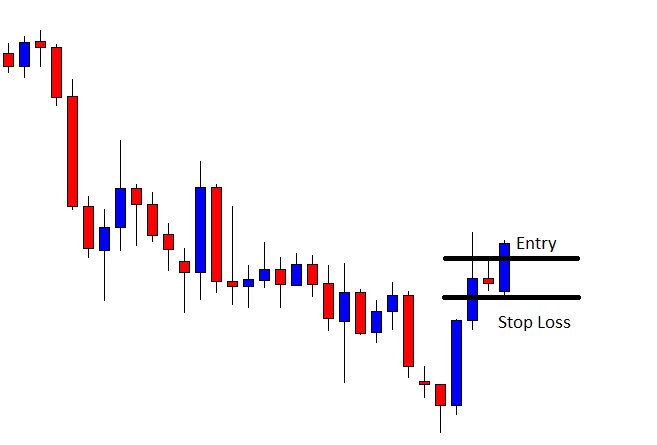
As anticipated, the chart produces some bullish candles with long upper shadow after the breakout. The price heads towards the North with a sluggish pace. It then produces a bearish Pin Bar and drives the price towards the breakout level again. A bullish reversal candle closing above consolidation resistance may attract the buyers to go long in the chart again. Let us find out what happens next.

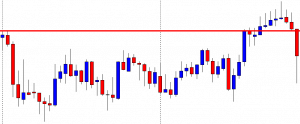
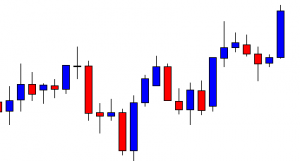
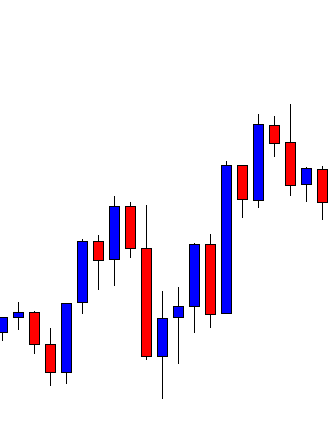
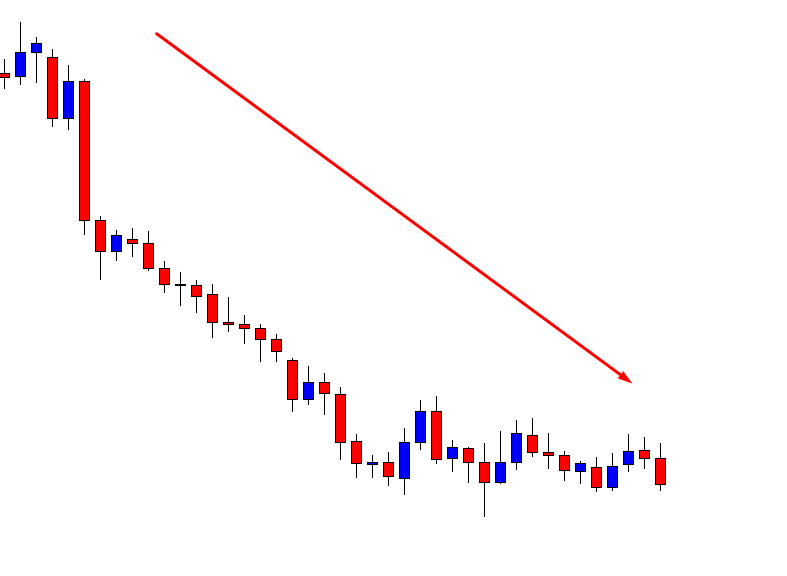
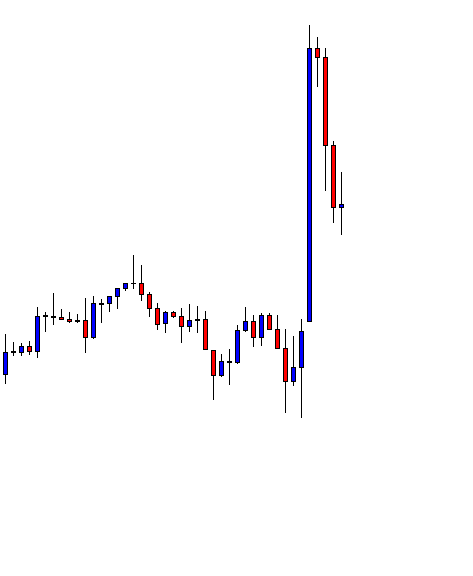
The chart produces a long bearish candle with long lower shadow. The pair is trading within the last week’s range again. The H4 buyers have lost their hope. They may skip eying on the chart to concentrate on somewhere else.

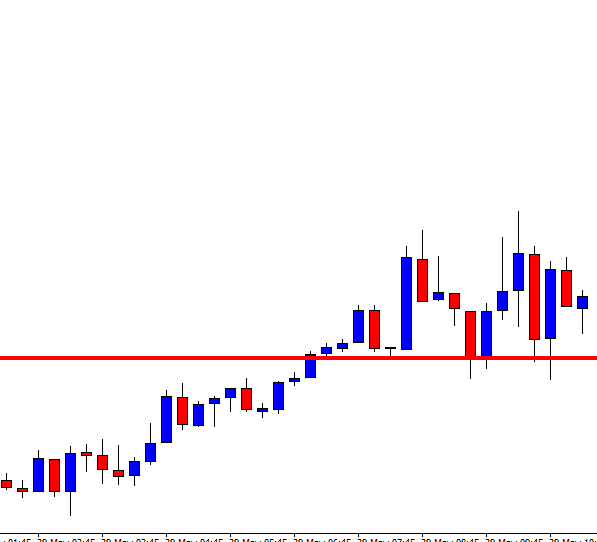
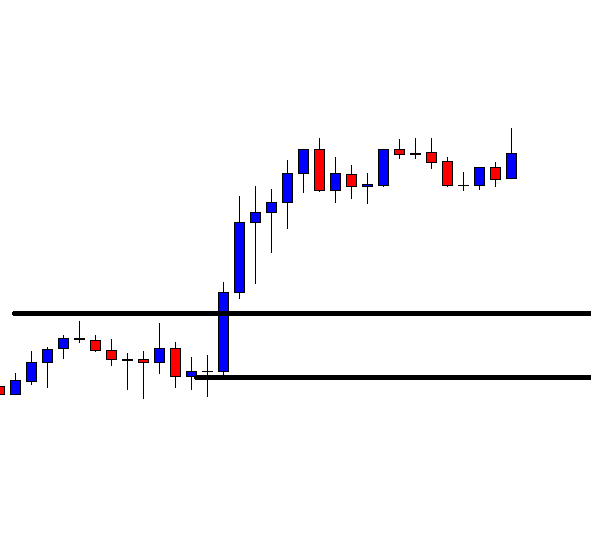
If we look back, a double bottom, along with a breakout at the last week’s high, do not push the price towards the North. Most probably, this is because of the breakout candle’s attributes. We may still keep an eye on such a chart, but it would be wise to concentrate more on those charts, which makes a breakout with a commanding candle.


Categories
Forex Price Action

The Trend in a Bigger Frame is Traders’ True Friend

There is a saying in financial trading “Trend is traders’ friend.” Without any doubt, this is true. In a chart combination trading, a bigger timeframe’s trend plays an important role and helps traders a lot to go with an entry in its counterpart. Let us have a look through an example of how it works.

This is a daily chart. The chart shows that the price heads towards the North at a moderate pace. The last candle comes out as a bullish candle closing well above consolidation resistance. It means the daily traders may start eyeing to go long in the pair.  The daily-H4 combination traders may flip over to the H4 chart for the price to consolidate and produce a long signal.

This is the flipped H4 chart. The chart shows that the last candle comes out as a bullish candle with an upper shadow. The buyers are to wait for the price to consolidate now.

The price consolidates and produces a bullish candle breaching consolidation resistance. Here is a thing. The consolidation range is shallow. The consolidation range plays a significant role in determining the next move’s length. The length of consolidation here does not suggest that the next move will be a big one. The daily-H4 combination traders may trigger a long entry by setting stop loss below consolidation support and by setting take profit with 1R. Let us proceed to the next chart.

The price hits the target of 1R by the next candle. Concentrate on the last candle. The candle comes out as a bullish Marubozu candle. It suggests that the price may head towards the North further. Let us find out how far it goes.

The price heads towards the North with three more candles. This means it travels almost three times more length than the combination traders have anticipated. Can you guess what may be the reason for this?

The daily chart is in a strong bullish trend. The last daily candle breaches through consolidation resistance and makes a strong statement about its bullishness. That may have attracted the daily buyers to go long in the pair as well. This brings extra liquidity and helps the price head towards the North with extreme pressure. This happens most of the time in combination trading. If the bigger chart makes a breakout and has a solid trend, the price seems to head towards the trend’s direction at a good pace in the minor chart. The combination traders may keep this in their mind and make full use of this.

Categories
Forex Price-Action Strategies

Do not Forget to Check the Daily Chart

In today’s lesson, we demonstrate an example of an H4 chart and try to evaluate its price movement after breakouts. The chart shows that the price makes three breakouts altogether. The first two breakouts do not create that much momentum towards the breakout, but the last one does. We try to find out the reason behind it.

This is an H4 chart. The chart shows that the price makes a bullish move and consolidates. It seems that the price has found its support since it has already produced a bullish engulfing candle. The buyers may go long in the pair above consolidation resistance.

The chart shows that consolidation resistance is a strong level of resistance where the price gets rejection several times. Since it is an H4 chart, three times rejections, on the same level, means that it is a daily level of resistance. Thus, an H4 breakout may not create that much momentum all the time.

The chart shows that the price after making a breakout consolidates for a long time again. It is because of the daily resistance factor. The daily candle confirms the breakout. Thus, the price in the H4 chart consolidates. Look at the last candle. This comes out as a bullish candle breaching consolidation resistance. Let us find out what happens next.

The last H4 bearish inside bar is the last candle of the day. It means the daily candle comes out as a bullish candle after the daily breakout, breakout confirmation, and daily reversal candle.

The price consolidates with one more candle to start the next trading day. A bullish reversal candle may push the price towards the North with good bullish momentum. Since the chart now belongs to the H4 traders as well.

Here it is. The chart produces a bullish engulfing candle closing well above consolidation resistance. The length of consolidation is shallow. However, the bullish reversal candle looks to be a perfect signal candle.

There she goes. The price heads towards the North with extreme bullish momentum. The last candle suggests that the price may continue its bullish journey. Let’s look at the last move. The price does not consolidate with enough depth, but it makes a strong bullish move. On the other hand, on the first two occasions, it consolidates well, but its breakout does not create good momentum. It is because, on the first two occasions, there is a daily resistance factor. The level of daily resistance makes the H4 traders wait for more. Once the price makes a breakout on the daily chart, it heads towards the breakout direction with good momentum. The H4 traders are to check the daily chart before taking entry. This is one more reason to check that one thoroughly.

Categories
Forex Price Action

The H1-15M Combination Trading: Waiting for an H1 Reversal Candle Ensures Better Reward

The H1 reversal candle plays a significant part in the H1-15M chart combination trading. If the traders wait to get an H1 reversal candle, by using candle’s lower low/higher high, they get a better risk-reward. In a bearish market, a trader needs to wait for an H1 bearish reversal candle after the breakout. In a bullish market, he needs to do the opposite. In today’s lesson, we are going to demonstrate an example of a bullish market where the H1-15M chart combination offers an entry upon producing an H1 bullish reversal candle. Let us get started.

This is an H1 chart. The chart shows that the price heads towards the North with good bullish momentum. The price, then upon finding its resistance, has been in a bearish correction. It consolidates around a level and heads towards the North. The buyers are to keep their eyes on the chart with a hope that it may make a bullish breakout.

The chart shows that the last candle makes a bullish breakout closing well above the last highest high. The buyers are to wait for the chart to produce an H1 bullish reversal candle followed by a 15M bullish candle to trigger a long entry. Let us keep watching the chart to get that H1 bullish reversal candle.

The chart shows that it produces two doji candles. It means the price has been in bearish correction at the minor charts. An H1 bullish reversal candle at the breakout level would be the ‘getting ready’ signal to go long in the pair.

Look at the last candle. The last candle comes out as a bullish candle forming at the breakout level. The buyers are waiting for the chart to produce such a candle. They may flip over to the 15M chart now. Let us flip over to the 15M chart.

The last candle comes out as a bearish inside bar. Since the H1 candle closes as a bullish candle, so a 15M bullish candle is the signal to trigger a long entry. Let us proceed to the next chart.

Here it is. The chart produces a bullish Pin Bar. The buyers may trigger a long entry right after the last candle closes. Traders may set their stop loss below the H1 bullish reversal candle’s lowest low, which is below the red-marked level. To set take profit, they may use Fibonacci levels. If the price trends from 61.8%, it usually goes up to the level of 161.8%. Let us find out how this one goes.

Yes, the price heads towards the level of 161.8% with good bullish momentum. If we flip over to the 15M chart right after the breakout, we would take entry by setting stop loss below 00.00%. By waiting for an H1 reversal candle, we may set the stop loss below 38.2%. This ensures a better risk-reward. On the other hand, if we always wait to get an H1 reversal candle after the breakout, we may not get it all the time. Thus, we end up being offered less number of entries in the H1-15M chart combination trading.


Categories
Forex Price Action

The H1-15M Breakout Trading: Concentrate on Breakout and Reversal Candle

In today’s lesson, we are going to demonstrate an example of a trade setup based on the H1-15M chart combination. Usually, the straighter the first move, the better it is.  However, the price sometimes consolidates in the first arm as well. Such consolidation makes a move look weak and may hold us back from eyeing on the chart. We try to find out whether we should skip eyeing on such a chart or not.

This is an H1 chart. The chart shows that the price makes a bullish move. Then, it produces a bearish inside bar followed by a bullish engulfing candle. The H1-15M buyers may flip over to the 15M chart to get a 15M bullish reversal candle to trigger a long entry. However, those two bearish H1 candles suggest that the 15M chart does not produce any bullish reversal candle after the H1 breakout. The price starts having a bearish correction instead.

The chart makes its bullish move, followed by a bearish correction. The bullish move does not look that impressive. It consolidates before making the bearish correction. Many traders may skip eyeing on this chart to go long in the pair. Ideally, the H1-15M combination trading requires an H1 breakout followed by a 15M bullish reversal to offer a long entry. Let us proceed to the next chart to find out what the price does here.

The price finds its support and heads towards the North. The last candle closes above the level of resistance. This is an H1 breakout. The H1-15M combination traders are to flip over to the 15M chart to trigger a long entry. Let us flip over to the 15M chart first.

This is how the 15M chart looks right after the H1 breakout. If the price comes back to the breakout level, and the level produces a 15M bullish reversal candle, the buyers may trigger a long entry.

The 15M chart produces a bearish engulfing candle closing within the breakout level. The next candle comes out as a bullish engulfing candle. The H1-15M buyers may trigger a long entry right after the last candle closes by setting stop loss below consolidation support and by setting take profit with 1R.

The price never looks back before hitting 1R. It heads towards the North at a very good pace. Consolidation and bullish reversal candle come out exactly the buyers would want to get. Do not forget that the first bullish move does not look that impressive. The breakout and 15M chart’s price action attract the buyers to go long here, though. This is what we are to look for in the H1-15M combination trading. It is good if the price makes a strong move in the first arm. However, if it does not, we may still eye on the chart to see whether it makes an H1 breakout and offers us an entry by producing a 15M bullish reversal candle.

Categories
Forex Fibonacci

Fibonacci Trading: How Fibonacci Levels Can be Used in Trading?

Fibonacci levels and price action around those levels give traders clue what they should do with their potential trade setup. The 61.8% level is the most significant level, which is paid attention by the traders to make a trading decision. The price usually goes towards the level of 161.8% when it trends from 61.8%. Since it creates enough space for the price to travel, different traders trade and make use of the wave-length in differently.  We will learn some other strategies that are integrated with Fibonacci levels. Meanwhile, let us demonstrate an example of a chart where the price reacts at 61.8% and trends towards 161.8% afterwards.

The chart shows that upon producing a double bottom, the price heads towards the North and makes a new higher high. The buyers are to wait for the price to make a bearish correction now.

The price heads towards the South upon producing a bearish inside bar. The last candle comes out as a bearish engulfing candle closing within a flipped support. Let us wait and see whether the level produces a bullish reversal candle.

The price produces three bullish candles at the flipped support. The last candle looks to be the strongest one. The price may head towards the North and makes a breakout at the highest high of the wave.

As expected, the price heads towards the North and makes a breakout at the highest high of the wave. The price continues its journey towards the North further. The last candle on the chart comes out as a bullish candle having a long upper shadow. Do you notice anything interesting here? Look at the next chart.

The price after making a bullish move, it starts having a bearish correction. The price consolidates around the 61.8% level. It produces a hammer and heads towards the North. It makes a breakout at the last highest high and heads towards the North with good bullish momentum. The price hits 161.8% as it usually does when it trends from 61.8% level.

Some traders go long in this chart before the price makes the bullish breakout. As long as 61.8% level produces a strong reversal candle, they trigger their entry. It provides an excellent risk-reward but less winning percentage. On the other hand, some traders trade once the price makes a breakout. This offers not that great a risk-reward but an excellent winning percentage.

Categories
Forex Daily Topic Forex Price-Action Strategies

H1 Breakout Trading: Keep Holding Your Positions

Price action traders are to maintain discipline with their entry and trade management. As far as trade management is concerned, it varies on time frames. Trade management on the H4 chart and the H1 chart is different. A reversal candle on an H4 chart has more potential to change the existent trend. Thus, traders may need to think about an early exit. On the other hand, H1 breakout traders may keep holding their positions until it reaches the target. In today’s lesson, we are going to demonstrate an example of this.

The chart shows that the price after being bullish has rejections at a level of resistance. The price heads towards the North but does not make any breakout. It has been in the bearish correction again. Let us see whether it finds its support and makes a bullish breakout or not.

Here it comes. The price finds its support and produces a bullish engulfing candle breaching the level of resistance. This is an A+ breakout candle. The buyers are to wait for the next candle to close above the breakout candle to trigger a long entry.

The next candle comes out as a bullish candle as well. It has an upper shadow, but the last 15 candle comes out as a bullish candle. The buyers may trigger a long entry right after the last candle closes by setting stop loss below the support level and take profit with 1R.

The price heads towards the North. However, it seems that the price does not head towards the target with good bullish momentum. Moreover, the last candle comes out as a bearish engulfing candle. This is ominous for the buyers. Do not forget this is an H1 chart, and the buyers are not supposed to take an early exit. They should keep holding their position and wait for the price to do the rest.

The price gets rather choppy. It has been testing traders’ patience. It is hard to keep holding positions. However, traders must not keep looking at the chart. Meanwhile, they might as well concentrate on other charts to find out potential entries.

Patience pays back to the buyers at last. The last candle comes out as a bullish candle, which helps the buyers to reach their take profit target. In the end, the trade goes well for the buyers. It may have gone the other way, but H1 breakout traders should stick with their plan and keep discipline.

Categories
Forex Course

85. Learning To Trade By Using The ‘True Strength Index’ Indicator

Introduction

The True Strength Index (TSI) is a technical indicator used to analyze the financial markets. ‘William Blau’ developed the indicator in the mid of 1991. If you are interested to know more about William Blau and the technical tools developed by him, we suggest you read his book – ‘Momentum, Direction, and Divergence.’ The True Strength Index abounds between the +100 and -100 levels, and most of the values fall between +25 and -25.

Typically, the price action moves between these levels, and they are considered as overbought and oversold levels. This indicator also warns the weakening of a trend through the divergence and indicates a potential trend changes via centerline. When the indicator goes above the zero-level, it means the indicator is in positive territory, and the buying market is strong. But if the indicator goes below the zero-level, it means that the indicator is in negative territory, and the selling market is strong.

Below is how the price chart looks when the True Strength Index indicator is plotted on it.

True Strength Index Trading Strategies

Traditional Trading Strategy

Buy Example

We must look for buy trades when the crossover of the TSI lines happen at the oversold levels and hold it until the price action reaches the overbought level. The image below represents a buying entry in the AUD/JPY Forex pair. In an uptrend, when the market gives a decent pullback, the TSI indicator reached the oversold area, which means that the sellers are exhausted now and prepare for the buys. Soon after the exhaustion, the crossover happened on the TSI indicator, indicating a buy trade.

Sell Example

Look out for selling opportunities when the crossover happens at the overbought levels and hold it until the price action reaches the oversold level. The below chart represents the sell trade in the AUD/JPY Forex pair. The TSI indicator reached the overbought level when the price action gave enough pullback; the crossover indicates the failure of buyers to move price action higher, and as a result, reversal happened. We can exit our positions at any of the major support levels, or when the indicator gives an opposite signal.

TSI Breakout Strategy

Buy Example

The strategy is to identify a breakout on the price chart. Once the breakout happens, the TSI indicator must be above the zero-line to take the buy trade. We can see that in the below image when the breakout happened on the EUR/CAD Forex pair. After the breakout, we can see that the TSI indicator was also above the zero line, indicating a buy signal in this pair. We can exit our positions at the higher timeframe’s resistance area or exit when the TSI reaches the overbought area.

Sell Example

In a downtrend, find out a sell-side breakout. After the breakout, if the TSI indicator goes below the zero-line, it indicates a sell trade. As we can see in the image below, when the price action broke the trend line, the TSI indicator also breaks below the zero line, which shows that the sellers are ready to print a brand new lower low in this pair.

That’s about TSI and trading strategies related to this indicator. Make sure to try this indicator and these strategies and let us know hoe did your trades go in the comments below. Cheers.

[wp_quiz id=”67291″]
Categories
Forex Daily Topic Forex Price-Action Strategies

Look for Such Price Action to Trade on the ABC Pattern

In today’s lesson, we are going to demonstrate an example of the ABC pattern trading. The trend-initiating candle comes out as a bullish engulfing candle followed by a bullish breakout. The price then makes a bearish correction and makes a bullish move upon producing a bullish reversal candle at a flipped support. Let us demonstrate with the charts how it happens.

The price has been bearish, but it has produced a bullish engulfing candle at the support zone. The buyers are to wait for the price to head towards the North and make a bullish breakout at the last swing high. Let us proceed to the next chart.

The price makes a breakout at the nearest swing high. The buyers are to wait for consolidation or correction and a bullish breakout. The last candle comes out as a strong bullish candle as well. It may keep going towards the North. Let us wait and find out what it does next.

It starts having a correction. Then, it produces a bearish inside bar followed by two more bearish candles. The price is at the flipped support. The buyers are to keep their eyes on this chart very closely.

Here it comes. The chart produces a bullish reversal candle. Do not miss the point that the level is the breakout level when the price heads towards the North. Such level is very significant as far as the ABC pattern trading is concerned.

The price makes a bullish breakout again and produces a new higher high. Traders may trigger a long entry right after the last candle closes by setting stop loss below the level of flipped support. It usually provides at least 1:1 risk-reward, which is the safest option. Let us proceed to the next chart to find out how it goes.

The price heads towards the North as expected. It hits the target (1R) with ease. The chart suggests that it may go towards the North further. Anyway, the ABC pattern traders shall enjoy their profit and hunt for the next one somewhere else.

In this example, we have seen that four aspects of the ABC pattern trading such trend initiating candle, breakout, reversal candle at the breakout level, and the signal candle get 10 on 10. Consequently, the price heads towards the desired direction with good momentum. If any of them fails to get 10 on 10, the trade may not go, exactly we would love to see it go. To keep excellent trading consistency, try your best to trade the ABC pattern on such price action that we have demonstrated today.

Categories
Forex Daily Topic Forex Price-Action Strategies

High Impact News Events and Risk Management

In today’s lesson, we are going to demonstrate an example of price action trading on the daily chart. The lesson has a message if a high impact news event comes in between, what daily traders should do?. Let us get started.

This is EURJPY daily chart. The chart produces a bullish engulfing candle, which suggests that the buyers may dominate in the pair. Traders on different time frames may get themselves ready to go long on the pair. Traders who trade on the daily chart, they are to wait for the price to consolidate and produce a bullish reversal candle to go long on the pair. Let us proceed to the next chart.

The pair produces another bullish candle before creating the corrective candle. It means the buyers on the H4, H1, or 15M may have found some entries and drove the price towards the North last day. Anyway, the daily traders may keep an eye on the pair to go long upon a bullish engulfing candle closing above the last candle’s highest high.

Here it comes. A bullish engulfing candle closes above the daily resistance. The buyers may trigger a long entry right after the candle closes by setting stop loss below the candle’s lowest low. The nearest significant swing high is quite far away. It offers a tremendous reward considering the risk.

The price heads towards the North for one more candle. However, it does not get as bullish as expected. The good thing is it is a bullish candle. The buyers must hold the trade at least up to the level, which offers 1:1 risk-reward.

The pair produces a doji candle. The price hits the level, which offers 1:1 risk-reward. Then, it ends up producing a candle, which neither a bullish nor a bearish candle. Technically, the buyers shall take out at least 50% profit and let the rest of it run. As far as the price action is concerned, the price still may go towards the North further. I may give you information that this is the Wednesday market dated 11/09/2019. Here I have something interesting to show you before we start Thursday trading.

Source: Forex Factory

The pair we are dealing with here is EURJPY. Look at those news events with the EURO. The EURO pairs are to ride on a roller coaster on such news days. Let us not guess, but have a look at the daily chart to find out how it looks.

The price goes towards the trend’s direction. Do not miss the lower spike. You can see that it hits the stop loss. It is painful, but this is how the Forex market is. Thus, traders must take extra care of their positions before such high-impact news event. Otherwise, they may lose their hard-earned profit by getting hit such high impact news events.


Categories
Forex Daily Topic Forex Price-Action Strategies

The Trend on the Daily Chart Means a Lot

Most of the Forex trading platforms have charts from 1M to Month. It is a debatable issue to determine the best chart among them. All these charts have merits as well as demerits. However, the Daily Chart plays an important role as far as determining the trend is concerned in the Forex market. In today’s lesson, we are going to demonstrate an example of how long term trend on the daily chart may help us guess the price’s next direction.

This is a daily chart. The price after being very bearish gets choppy. A bullish breakout may make the price go towards the North. On the other hand, a bearish breakout keeps the price being bearish. It could go either way. However, the long-term trend on this chart is bearish biased. Moreover, the last candle comes out as a bearish engulfing candle. Thus, the pair may get bearish again. Let us flip over to the H4 chart and find out how it looks.

The chart shows that the price has been bearish on the H4 chart. However, the price finds its support at the same level, where it had a bounce earlier. If we consider only the H4 chart, the price may get bullish. Do not forget that the daily chart’s long-term trend is bearish. Let us proceed to the next H4 chart.

The last candle comes out as a bearish engulfing candle closing below the level of support. It may get tough to guess what happens here. Have a look at the same chart with two horizontal lines to make things simpler.

The price produces that bearish engulfing candle after a bullish corrective candle. The Stop Loss level is explicit, so it is entry-level. The sellers may trigger a short entry right after the last candle closes. Since there is no support nearby, the sellers may hold their entry until it produces a bullish reversal candle.

The short entry goes well — the price heads towards the South with good bearish momentum. The last candle comes out as a bullish engulfing candle. It is a strong bullish reversal candle. It is time for the sellers to close the entry.

As mentioned, the price in such a case can make a bullish breakout too. Traders must look for long entries then. However, in such price action on the daily chart, we may concentrate more on the chart when it produces a reversal candle in favor of the long-term trend. This is how we give ourselves more chances of getting an entry.


Categories
Forex Price-Action Strategies

The Lesson We Learn from Such Price Action

In today’s article, we are going to demonstrate an example of a trade, which does not go according to the price action traders’ expectations. We try to dig out what goes wrong with the trade. Let us get started.

This is a daily chart. The chart produces an inside bar right at the level where the price had a rejection earlier. The buyers, according to price action trading, usually wait for the price to produce a bullish reversal candle around such levels. However, the buyers may remember an important point here that the bullish reversal candle is an inside bar. An inside bar is not known as a strong reversal candle. Nevertheless, it is a daily bullish reversal candle producing right at the level of support, so they daily-H4 buyers are to flip over to the H4 chart.

The H4 chart’s price action is bullish. The last candle comes out as a bearish pinbar. The price may consolidate soon. If that happens, followed by an H4 bullish breakout, buyers may go long on the pair. The next significant swing high is far, offering a tremendous risk-reward.

The price consolidates and produces a bullish engulfing candle breaching the level of resistance. The consolidation does not look an ideal one. Ideally, the buyers may trigger a long entry here. This is what we have been learning on daily-H4 chart trading lessons. Let us assume that we take a long entry here. Let us find out how the trade goes.

The next candle comes out as a bearish candle. It does not hit the stop loss, but it looks ominous. Since taking a loss is an unavoidable thing in trading, so we may let it go. This is what we have been learning, as well. Let us find out what happens next.

It hits the stop loss. As far as trading psychology is concerned, we must not let it take over us. However, with this trade, two things may hold many price action buyers back taking the entry.

  • An inside bar bullish daily reversal candle
  • Ugly looking consolidation

We have demonstrated on many occasions, an inside bar daily reversal candle with good-looking consolidation ends up offering a winning entry. On some lessons, an unusual consolidation but with a daily bullish reversal candle does the same. Over here, a combination of both ends up offering a losing entry. On some occasions, such price action (inside bar daily reversal candle and unusual consolidation) may end up offering a winning entry. However, to have better winning consistency, we may skip taking entry on such price action.


Categories
Forex Daily Topic Forex Price-Action Strategies

Consolidation and Breakout: The Two Key Movements in Price Action Trading

Price action trading mainly relies on consolidation, trend, and breakout. Reversal candle is another feature that traders keep an eye at. Typically, double top/bottom, morning star/evening star, and engulfing candle are considered the strongest reversal signal. However, even an inside bar may create an excellent bullish/bearish momentum if the price consolidates and makes a perfect breakout. In today’s lesson, we are going to demonstrate an example of this.

We are looking at an H4 chart. It shows that the price heads towards the North with extreme bullish momentum. A bearish inside bar followed by another bearish candle makes a reversal. The price after being bearish may have found its support. The buyers are to wait for the price to make a bullish breakout at the level of resistance. The sellers are to wait for consolidation and a bearish breakout at the level of support.

The price starts having a correction. If it keeps going towards the North further, it may get choppy. If it finds its resistance nearby, the sellers may find an opportunity to go short on the pair.

The chart produces a bearish engulfing candle. It means the price finds its resistance. If it makes an H1 breakout at the level of support, the sellers may want to trigger a short entry. Let us now have a look at the same chart with those two levels.

The equation gets much simpler with those two levels. Since this is an H4 chart, the sellers are to flip over to the H1 chart to get a breakout and trigger a short entry. The reversal candle looks strong enough to make the sellers keep an eye on the pair to take a short entry upon a breakout.

This is how the H1 chart looks. The price seems to have found two levels of support here. However, the H4 chart looks very bearish, which may keep driving the price to make a breakout at the level of red marked support.

Here comes the breakout. The candle closes well below the level of support. It has a long lower shadow, but it has a thick bearish body as well. The sellers may trigger a short entry right after the candle closes by setting stop loss above the resistance. Take profit may be set at the last swing low on the H4 chart. Let us proceed to the next chart to find out how the entry goes.

The price heads towards the South with good bearish momentum. It makes another bearish breakout at the last swing low as well. Concisely, the sellers grab some green pips from the entry.

If we concentrate on the first candle of the trend, we see that the candle is a bearish inside bar. An inside bar is considered the weakest reversal signal. However, it produces an excellent short signal here because of perfect consolidation and the breakout. The above example signifies the importance of consolidation and breakout in price action trading.