Most of the Forex trading platforms have charts from 1M to Month. It is a debatable issue to determine the best chart among them. All these charts have merits as well as demerits. However, the Daily Chart plays an important role as far as determining the trend is concerned in the Forex market. In today’s lesson, we are going to demonstrate an example of how long term trend on the daily chart may help us guess the price’s next direction.
This is a daily chart. The price after being very bearish gets choppy. A bullish breakout may make the price go towards the North. On the other hand, a bearish breakout keeps the price being bearish. It could go either way. However, the long-term trend on this chart is bearish biased. Moreover, the last candle comes out as a bearish engulfing candle. Thus, the pair may get bearish again. Let us flip over to the H4 chart and find out how it looks.

The chart shows that the price has been bearish on the H4 chart. However, the price finds its support at the same level, where it had a bounce earlier. If we consider only the H4 chart, the price may get bullish. Do not forget that the daily chart’s long-term trend is bearish. Let us proceed to the next H4 chart.

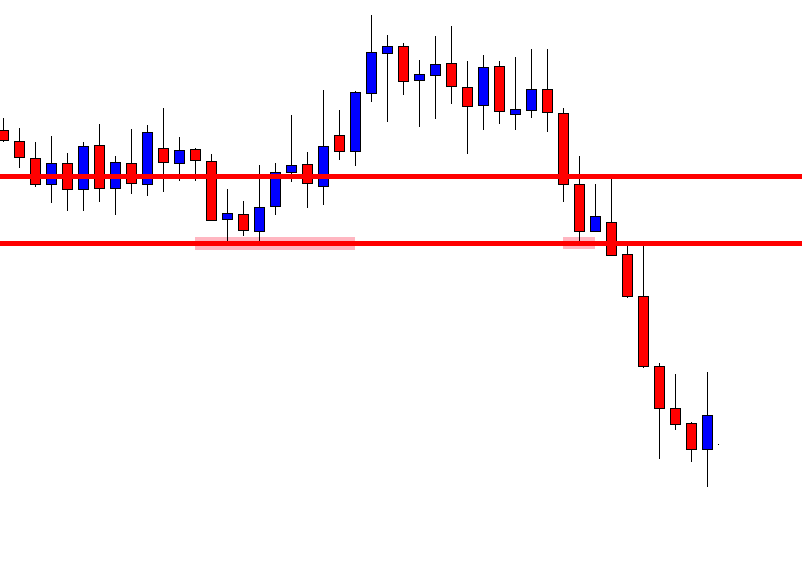
The last candle comes out as a bearish engulfing candle closing below the level of support. It may get tough to guess what happens here. Have a look at the same chart with two horizontal lines to make things simpler.

The price produces that bearish engulfing candle after a bullish corrective candle. The Stop Loss level is explicit, so it is entry-level. The sellers may trigger a short entry right after the last candle closes. Since there is no support nearby, the sellers may hold their entry until it produces a bullish reversal candle.
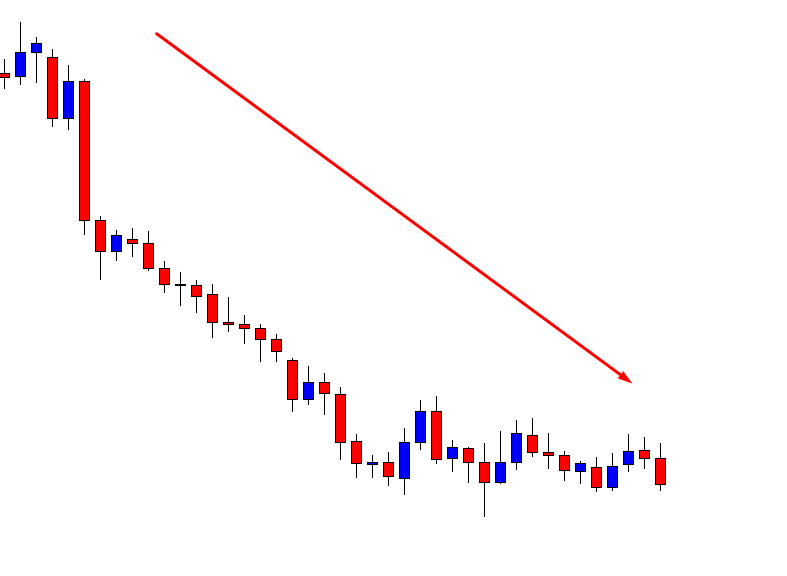
The short entry goes well — the price heads towards the South with good bearish momentum. The last candle comes out as a bullish engulfing candle. It is a strong bullish reversal candle. It is time for the sellers to close the entry.
As mentioned, the price in such a case can make a bullish breakout too. Traders must look for long entries then. However, in such price action on the daily chart, we may concentrate more on the chart when it produces a reversal candle in favor of the long-term trend. This is how we give ourselves more chances of getting an entry.