
Profiting from the crypto market – Doji candle trading
Doji candlesticks
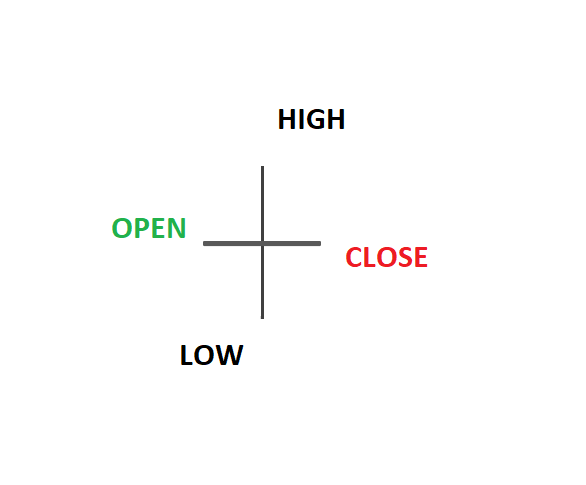
The Doji star, better known as the Doji candlestick, is a unique candle that signals indecision in the crypto market. It shows that neither the crypto bulls nor bears are in control. However, not everything is that simple. The Doji candlestick has five variations. Each one of them shows something different. This is why it’s important to understand how to spot and read different Doji candle variations.
The Doji candlestick is characterized by its cross-like shape. This happens when a cryptocurrency pair opens and closes at the exact same level leaving a very small or even non-existent body while also exhibiting upper and lower wicks of equal length. While Doji mostly represents indecision in the market, it can also indicate a slowing momentum of an existing trend.
Doji candle in technical analysis
The Doji candle can be a very important piece of information as it can provide crypto traders with a moment to stop trading and reflect. However, it is important to consider the Doji candle in conjunction with other tools when timing your market exit point.
Doji candle variations
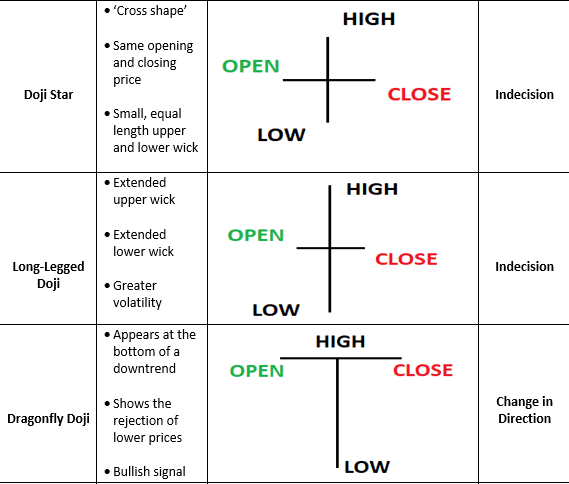
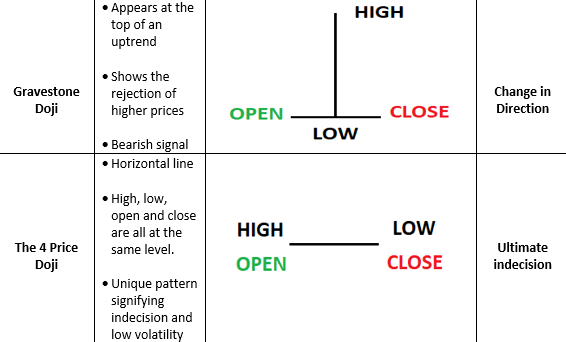
While the traditional Doji star shows indecisiveness, other variations can have different implications.
The picture on the screen will show different variations of the Doji candlestick, as well as its outcomes.
Trading the Doji candlestick
Traders use various ways to trade various Doji candlestick patterns. However, they all look for signals that complement the Doji candlestick in order to execute high-probability trades.
Trading the Doji star
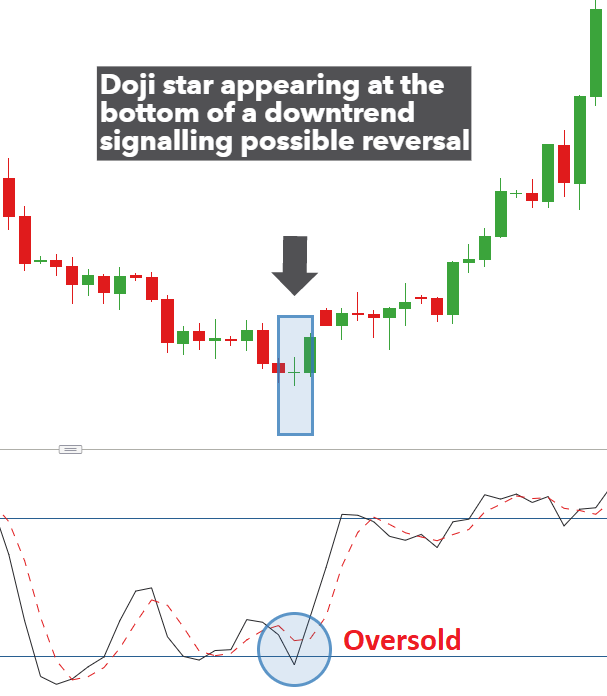
The chart shows the Doji star appearing right at the bottom of an existing downtrend. This Doji pattern suggests that neither bulls nor bears are in control, meaning that a trend reversal is possible. At this point, it is crucial to take a look at supporting signals from other tools and indicators. This example makes use of the stochastic indicator, which is currently in the oversold territory, which adds to the bullish bias.
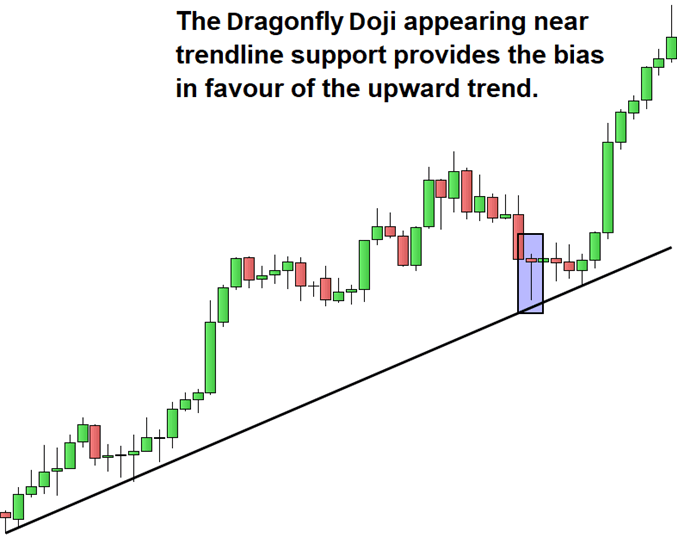
A popular Doji trading strategy involves looking for Dojis, which appear near support and resistance levels. The chart highlights the Dragonfly Doji, which appeared near trendline support. In this case, the Doji doesn’t appear at the top of the uptrend, so it doesn’t mark a trend reversal. The Dragonfly Doji, in this case, shows the rejection of lower-level prices. This potential bullish signal is further supported by the candle appearing near the trend support.