
Bitcoin price dump! was the writing on the wall?
Thank you for joining this Forex Academy educational video.
In this session, we will be looking at the recent bitcoin US dollar price dump and what might have been the possible contributing factors.
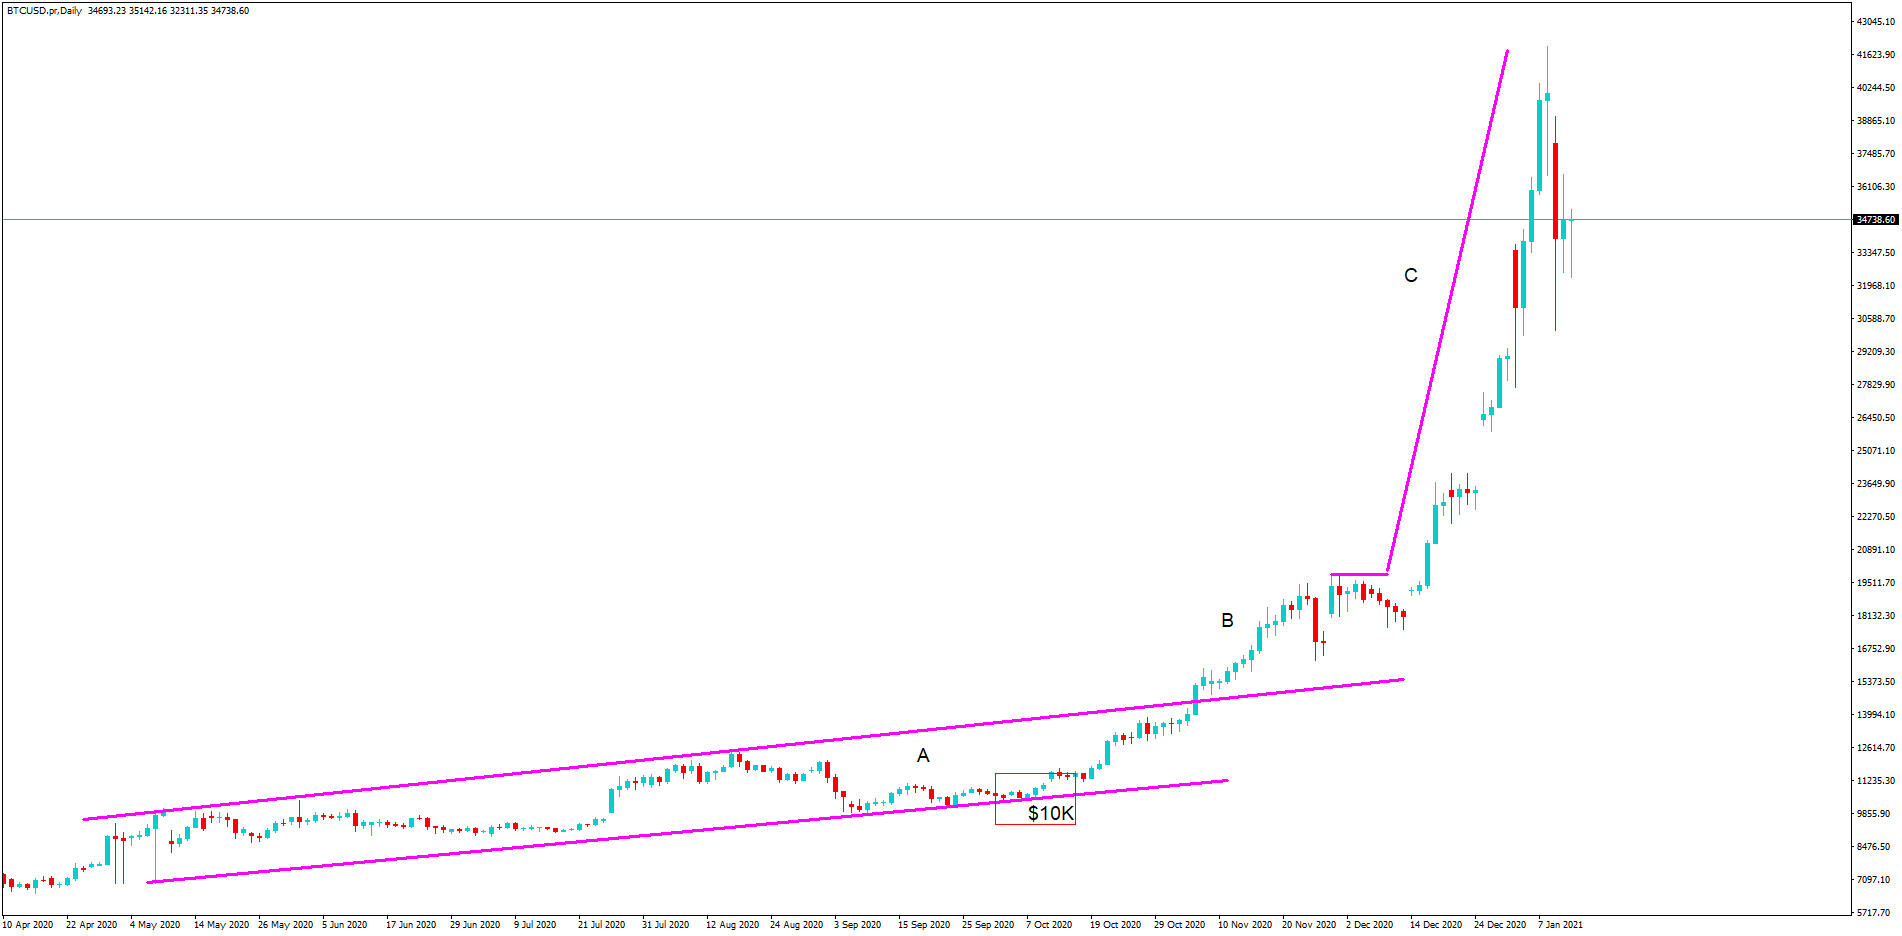
In this daily chart of bitcoin to the US dollar, we can see a steady bull run, as highlighted in section A, with a critical area of support on the $10 k line, which lends itself nicely for a price action move up to the resistance line, which was breached in section B, which coincides with the all-time high of around $19.5K from 2017, and where eventually price reaches the key $20K figure, and from there on over the Christmas period and into the new year, we see exponential growth, where bitcoin skyrockets to $42k.
With market analysts and investors talking up the value of bitcoin from anywhere in the region of $30 to 40K and even 140k, it’s hardly surprising that euphoria crept in and where everybody was buying, especially in the CFDs market.
This was a gold rush in all but name. And one has to ask oneself a question; when assets are being talked up by investors, or even talked down, what are the real motives behind this? Are they simply looking for a market reaction in favour of their own investment strategy, for example? This is a question for another day.
Getting back to the issue, was the writing on the wall all for a price collapse? Yes, it was, and for a number of reasons:
Firstly, when a market is moving steadily as in a trend, it is less likely to see extreme volatility unless there are fundamental reasons behind it. And because bitcoin is essentially a speculative instrument, fundamentals can be set aside in favour of a trending market.
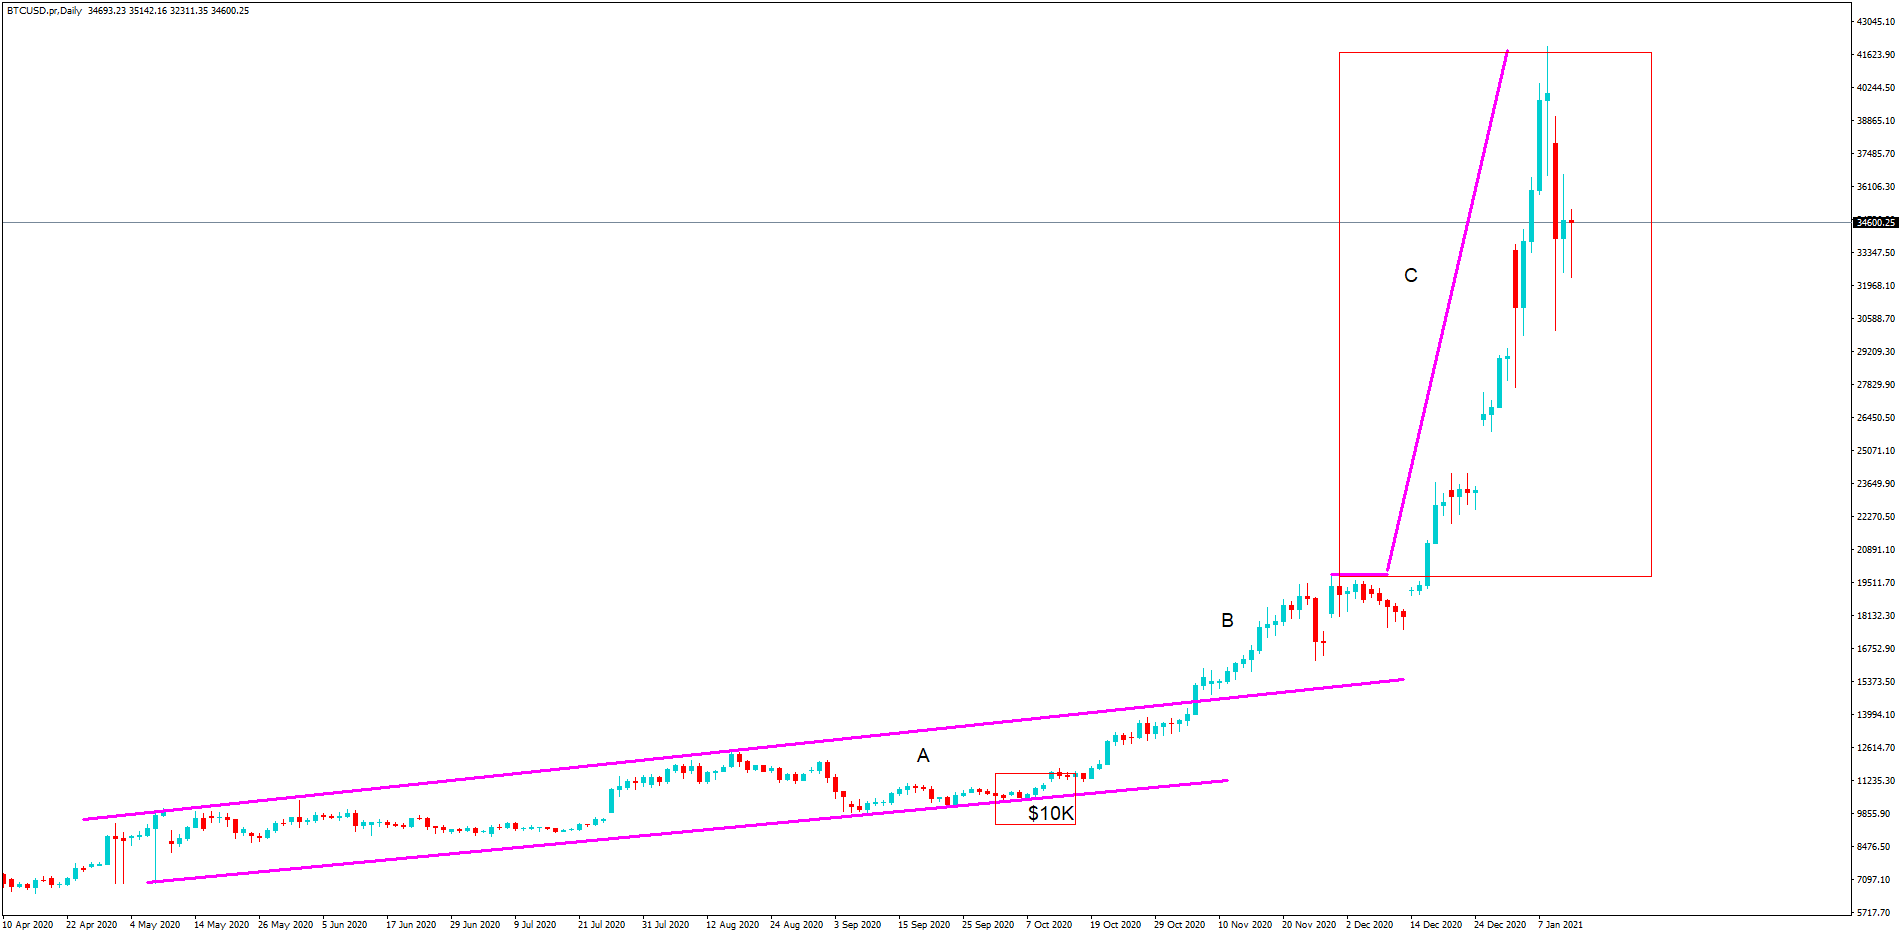
The problem with this, as highlighted here, is that this is unchartered territory. We are looking at a $20,000 price increase in just a few days, which is almost unheard of. Technical analysis becomes difficult to gauge, and professional traders don’t know where to get in on the trend or place stops. Many are forced into buying for fear of missing out, and this is extremely dangerous.
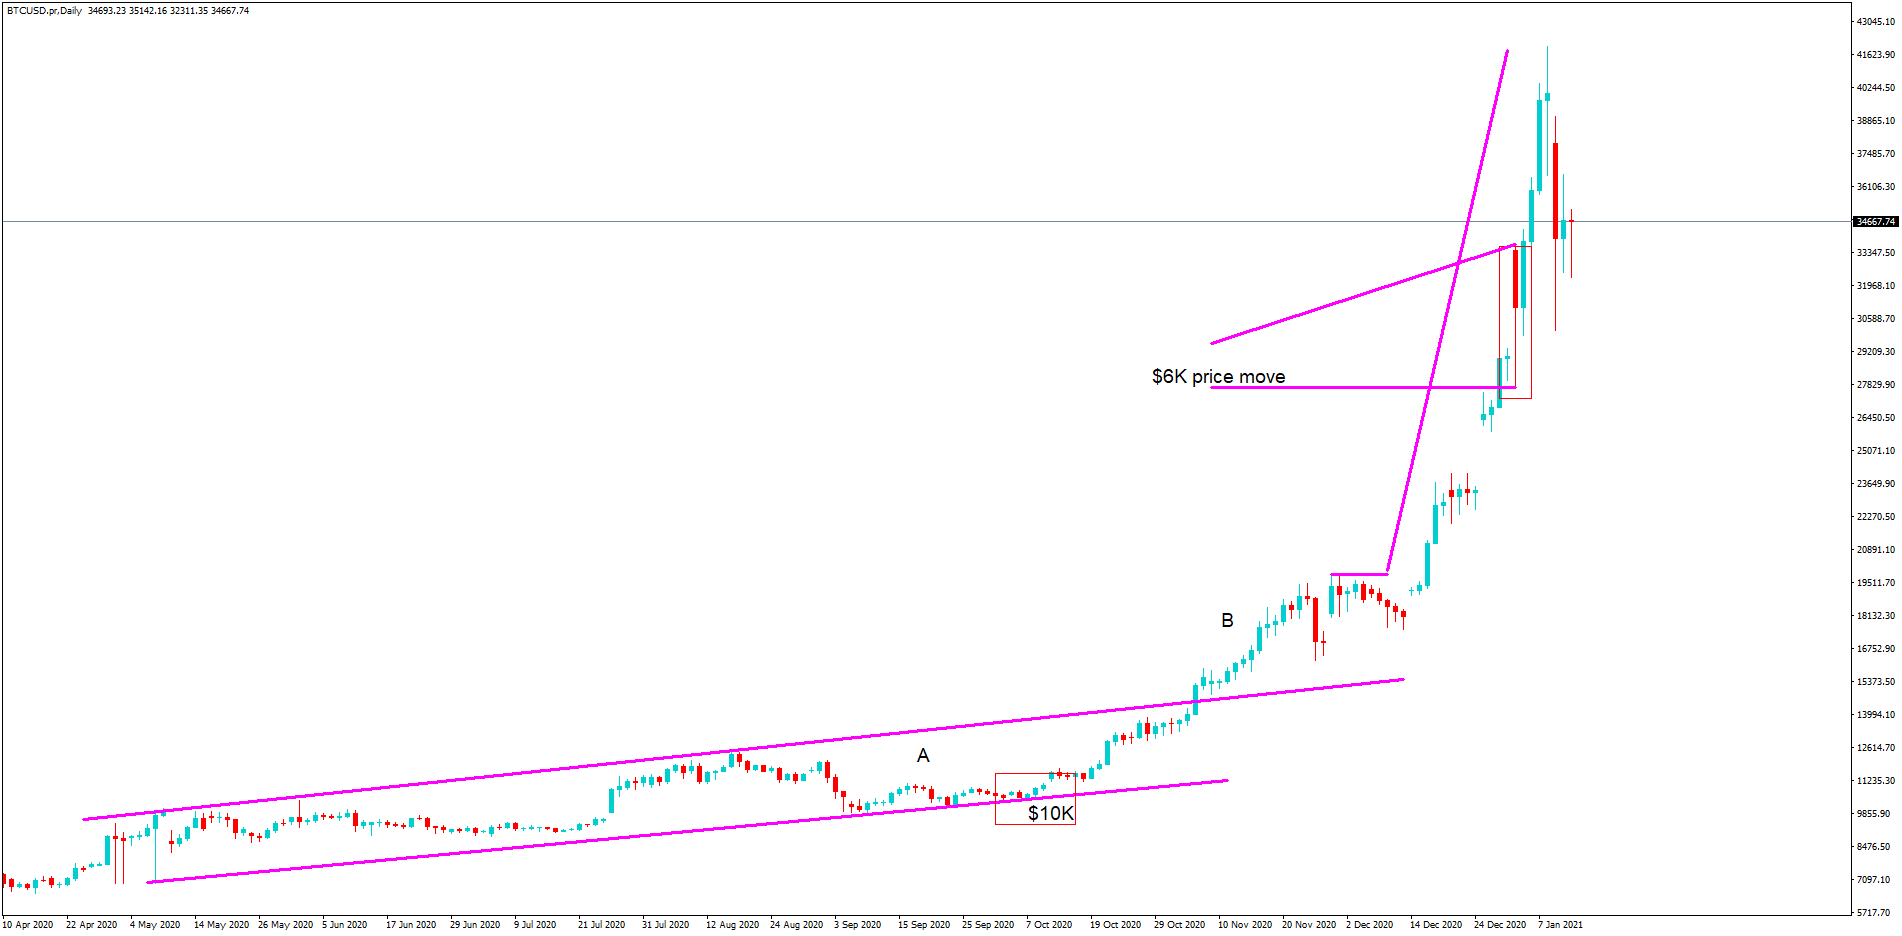
Certainly, the writing was on the wall when on the 4th of January, we see a $6K price range move on this bearish daily candlestick. However, volatility continued with the bulls regaining control taking bitcoin to a record high of around $42,000.
Professional traders will know from history that a correction was on the cards, and with the UK FCA warning retail traders about the potential of losing all of their money trading bitcoin assets, it very likely contributed to price action hitting a brick wall all and to the collapsed….
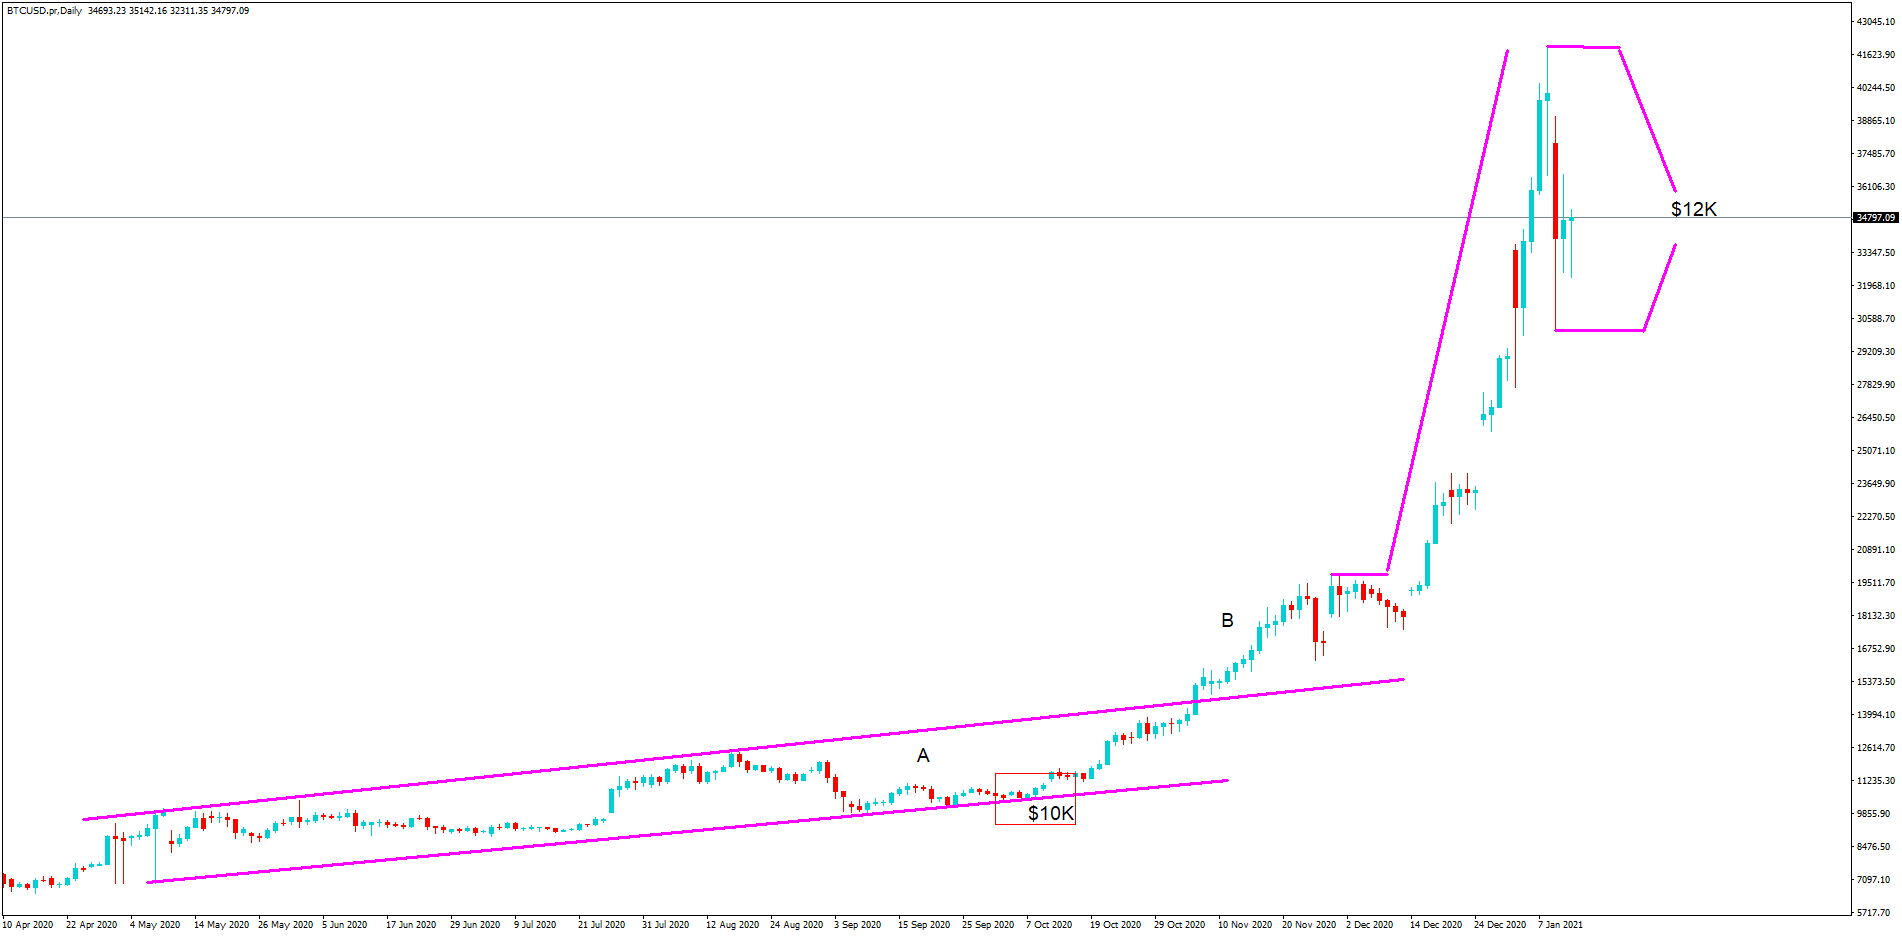
Of around $12K in 24 hours. Many investors and retail traders were still buying well above $40,000, while the price was tanking, causing billions of dollars to be wiped off of the price, and where billions were lost in margin calls, with accounts being liquidated, because of the massive move lower.
Bitcoin should have a health warning on it, buyer beware, and with more and more weekend traders getting involved in this market, which operates 7 days a week, and where these part-time traders in there are spare rooms have a punt, with many losing their cash deposits, it is not a surprise that the FCA have banned retail traders from trading cryptocurrencies in the UK from the 6th of January this year, and where the EU are now calling for tighter regulation in this space.
Weekend bitcoin traders will be licking their wounds. But let’s not forget that a lot of people are still in the money and sitting back waiting to see if the price steadies itself and then continues to move higher, or if it will continue to slide.
Advice on this one would be too to look at trends on lower time frames…..
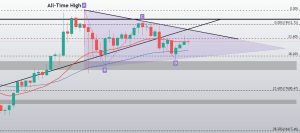
Such as this one-hour chart, while looking for support and resistance lines, and pick out trends that are set by big money investors, such as institutional traders, where they typically operate Monday to Friday. Be ultra-cautious when going long during aggressive rallies and around huge candlesticks, especially the bearish ones, as highlighted, which represents an overall move of $4000 dollars. They spell out danger. And set tight stop losses.