Introduction
Head and shoulder is a famous market reversal pattern. Most of the new and experienced traders use this pattern to identify the potential market reversal trade. Traders can use this pattern in every market, including forex, cryptocurrency, stock, indices, and commodities.
In this pattern, there is an indication that the price is trying to make a new higher but cannot do it. In the forex market, it is essential to understand the sentiment of buyers and sellers. In that sense, head and shoulder is a prominent price pattern indicating what buyers and sellers are doing in the market and how buyers got rejected from a potential zone.
What is the Head and Shoulder Pattern?
Head and shoulder is a price pattern that usually appears in an uptrend and indicates a price zone from where buyers are going to lose their momentum. A complete head and shoulder pattern indicates the start of a bearish trend. Therefore, if you want to join the bearish trend as early as possible, you should take trading decisions based on this pattern to have a better risk: reward ratio.
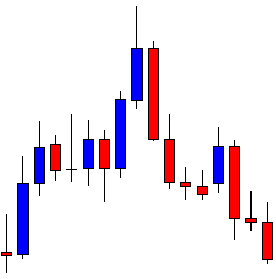
The head and shoulder pattern has three elements, as marked in the below chart.
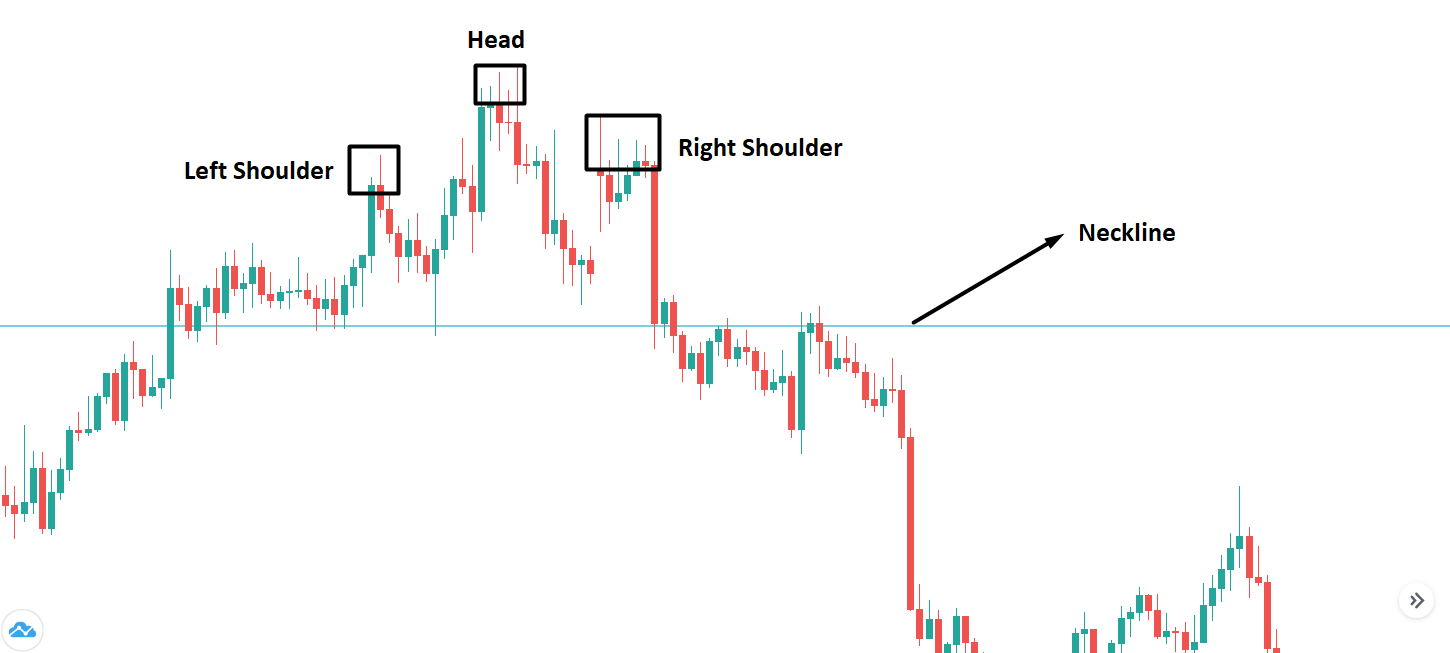
The left shoulder is the ordinary swing high of a bullish trend. Later on, the head indicates another swing high indicating the continuation of the bullish trend. However, the right shoulder indicates that the price is unable to make another high above the head, which is an indication that buyers are losing their momentum.
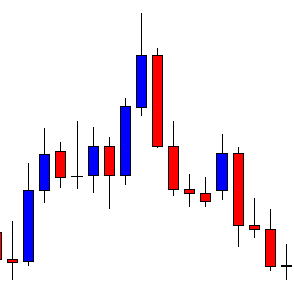
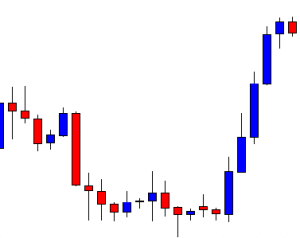
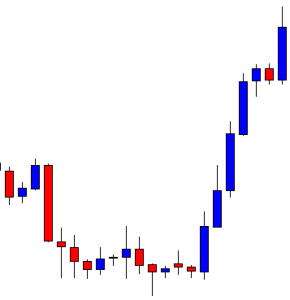
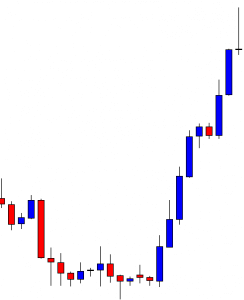
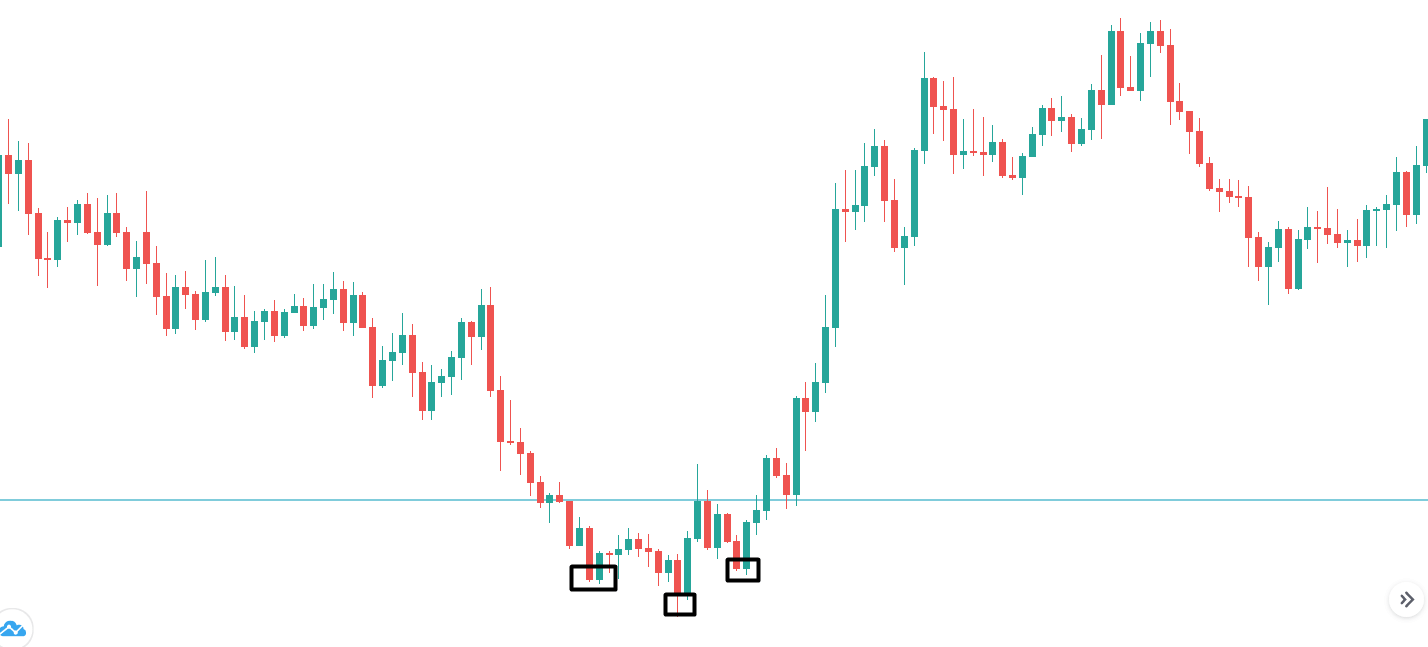
On the other hand, the inverse head and shoulder are like the head and shoulder pattern that appears after a bearish trend. It indicates a potential market reversal from a bearish trend to the upside.
In the image below, we can see how an inverse head and shoulder looks like.
How to Identify the Head and Shoulder Pattern?
The head and shoulder pattern is prevalent in the chart that does not require any effort to see. You can easily spot it with the naked eye. Moreover, there are some Expert Advisors (EAs) or trading indicators that automatically show the head and shoulder pattern.
You can draw the head and shoulder pattern using the trendline (without ray) despite the automotive process. Later on, we should focus on the location of the pattern. If the head and shoulder pattern appears near any significant support level, it might not work well due to the lack of space for further price decline.
Overall, the head and shoulder pattern from a significant resistance level or key resistance level can provide a potential market reversal opportunity. Furthermore, head and shoulder patterns with significant economic events often make the level important among traders.
Head and Shoulder Pattern Trading Strategy
If you have read the above section, you would know that it is not difficult to find the price’s head and shoulder pattern. The profitability ratio of this pattern is very high, based on the previous trading result. There are several ways to make trades based on the head and shoulder trading strategy. However, the most reliable way to take the trade is from the neckline breakout.
Timeframe
The head and shoulder price pattern in a daily chart is more reliable than the head and shoulder pattern in a 5 minutes timeframe. The accuracy of this trading strategy increases if you move to a higher timeframe. However, it is often difficult for traders to take trades based on a weekly or monthly timeframe as it requires a lot of time and balance. Based on the retail and institutional traders, any time frame from 1 hour to a daily chart is perfect for this trading strategy.
Currency Pair
The head and shoulder trading strategy works well in all financial markets, including forex, cryptocurrency, stocks, indices, and commodities. Therefore, there is no barrier to use it on specific currency pairs. However, it is recommended to trade in major currency pairs as there is enough liquidity to provide a substantial movement without any unnecessary spike.
Entry
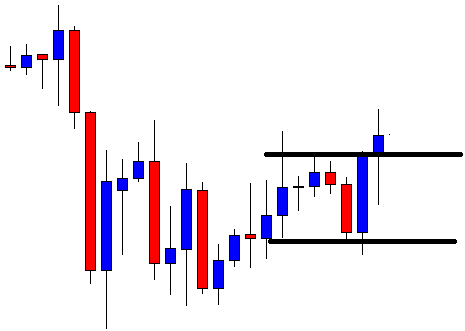
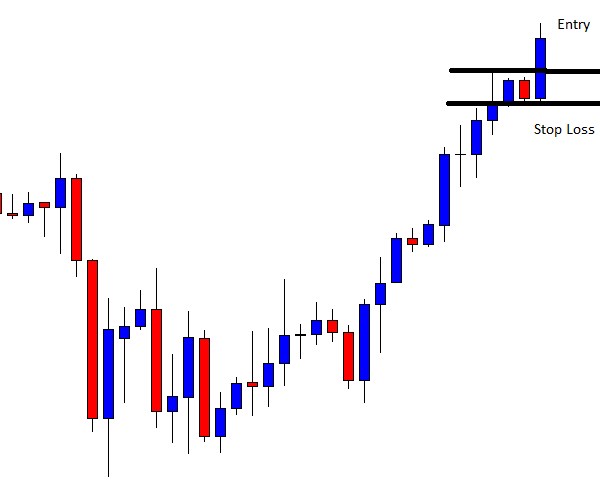
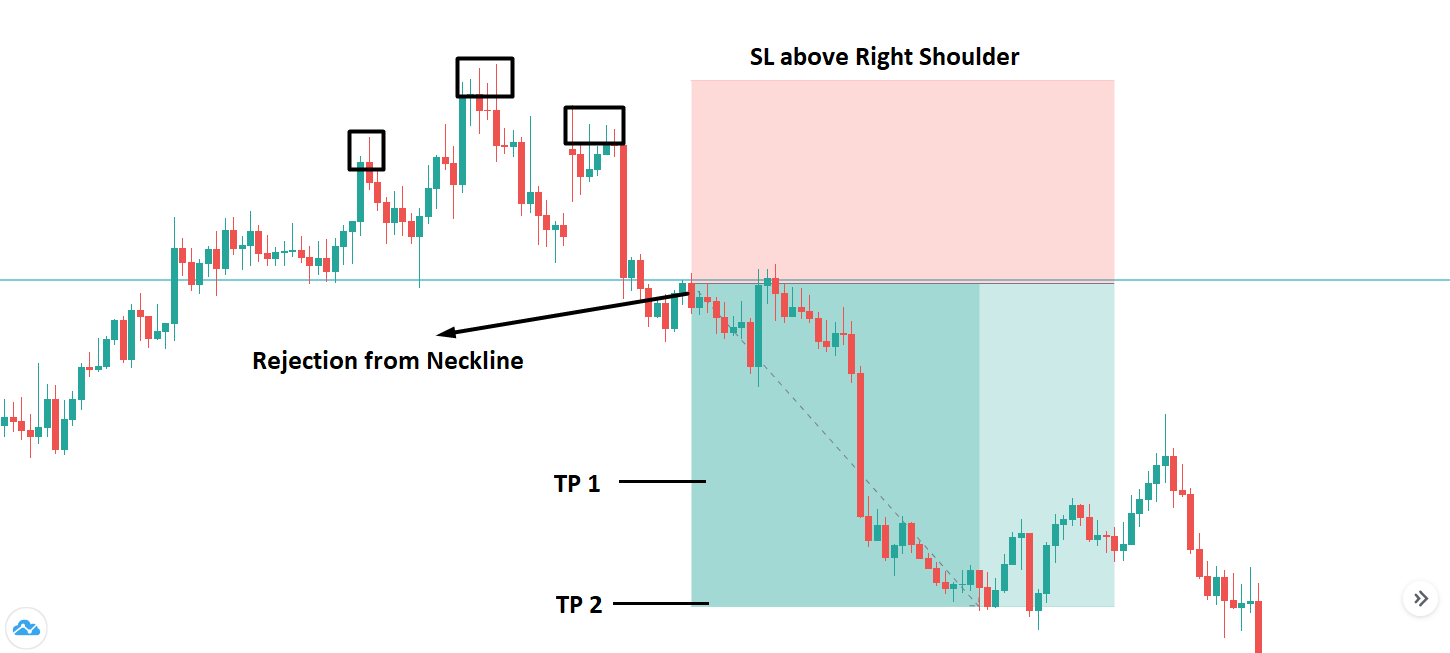
After forming the head and shoulder pattern, it is crucial to measure the price action at the neckline area. The neckline is a support level based on the lowest swing point of two shoulders and one head. In this trading strategy, you should wait for the price to break below the neckline with a big candle breakout. The strength of the breakout will indicate how reliable the upcoming bearish pressure is.

Later on, wait for the price to correct towards the neckline again with a corrective speed and enter the trade as soon as the price rejects the neckline with a bullish reversal candlestick.
Stop Loss
The stop loss will depend on two categories. If you are an aggressive trader, you can put the stop loss above the reversal candlestick with 10-15 pips buffer. In case the market moves above the neckline and hits your stop loss, it would indicate that the price made a false break below the neckline. However, the conservative approach is to put the stop loss above the left shoulder with some buffer. It would save your trading balance from the unusual market noise.
Take Profit
The first take profit level should be based on the 1:1 risk: reward ratio. You can close 50% of the position at the first take profit level and wait for the 100% of neckline to head for the final take profit.
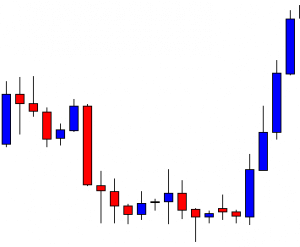
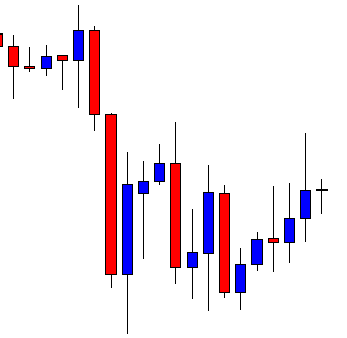
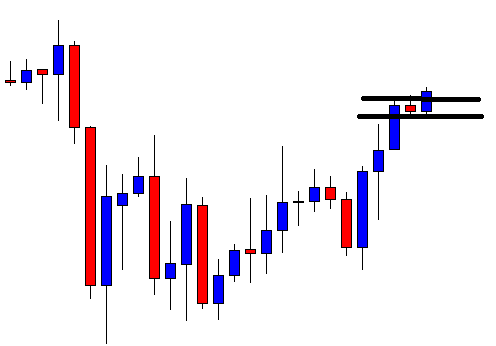
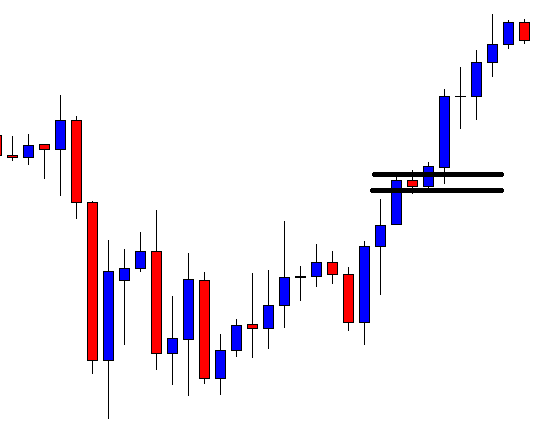
Moreover, you should be more cautious in setting the take profit level by considering the near-term support and resistance levels. In the example below, we can see how the price broke below the neckline and retested it again to create a trading opportunity. Moreover, this image refers to how to set the stop loss and take profit levels.
Conclusion
The forex market is the world’s biggest financial market, which is very uncertain. Therefore, no trading strategy can guarantee a 100% profit. There is some possibility that your trade might hit the stop loss after taking the entry, instead of moving down. In that case, you should take the loss and wait for further trading opportunities.
The best way to keep yourself profitable in the market is to use appropriate money management and trade management rules for trading. Therefore, if you take 1% or 2% risk per trade, any unusual stop loss might not affect the overall balance.