Categories
Forex Basic Strategies

Trading The ‘Diamond Pattern’ Can Be Extremely Profitable If Traded Correctly

For the years traders and market technicians often used some of the common and basic technical tools to analyze the market. These are some basic indicators, some common formations such as pennants, double bottoms, double top, flags are often used in the currency market. Some advanced traders use different ways to analyze the market, they focus on price action, Elliott waves, and the Diamond pattern which is not widely used by retailers, but is a quite popular and secret tool in the professional trader world.

In this article, we will show you everything you need to know about the diamond pattern to capitalize on the various trading opportunities. There is two types of diamond pattern the Bullish and Bearish Diamond pattern. The bullish diamond occurs at the end of the downtrend which indicates the buying trade and the bearish diamond pattern occurs at the top of the uptrend which gives the buying opportunities. By reading the previous line you understood that diamond is the reversal pattern and it never offers the trend continuation trades, so always use this pattern to trade the reversals.

The forex market has higher liquidity as compared to the stock market, so it is easier for the traders to identify this pattern than in the stock market where gaps in price action frequently occur. The Diamond pattern occurs on every timeframe and it offers plenty of trading opportunities to every type of trader or investor.

Identifying The Diamond Pattern On The Price Charts

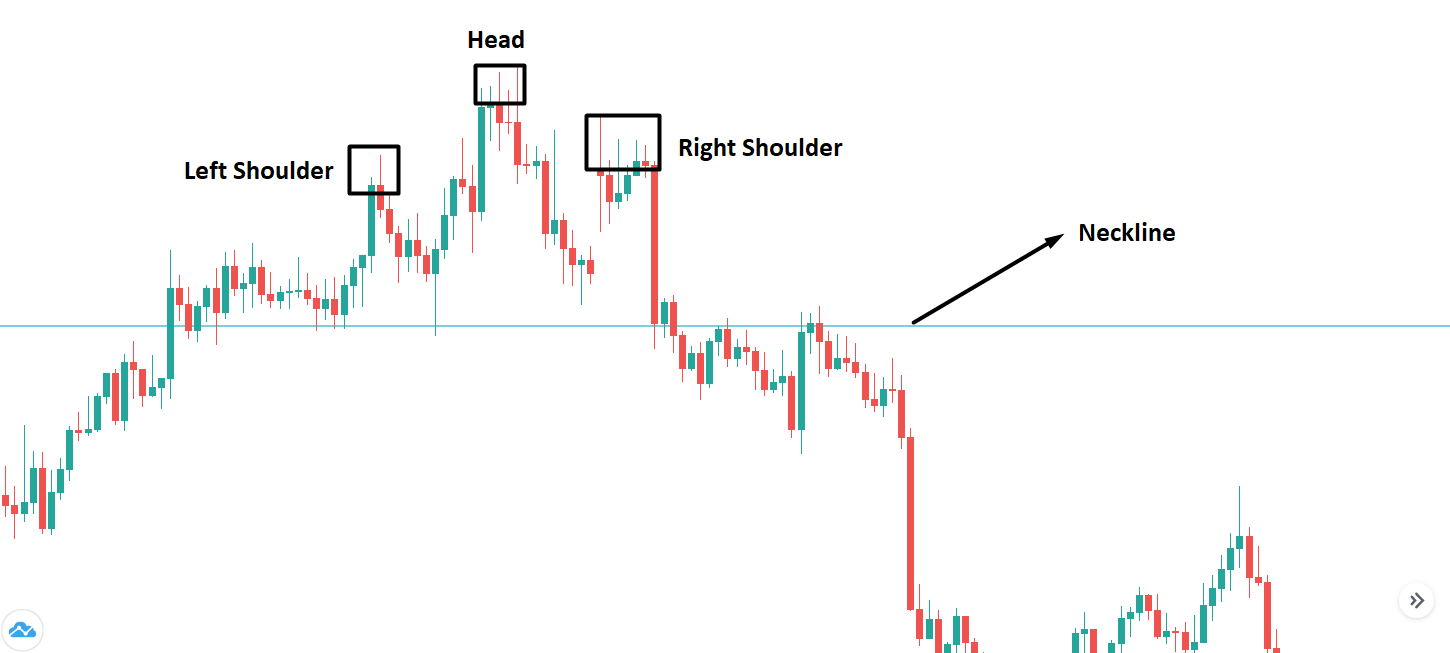
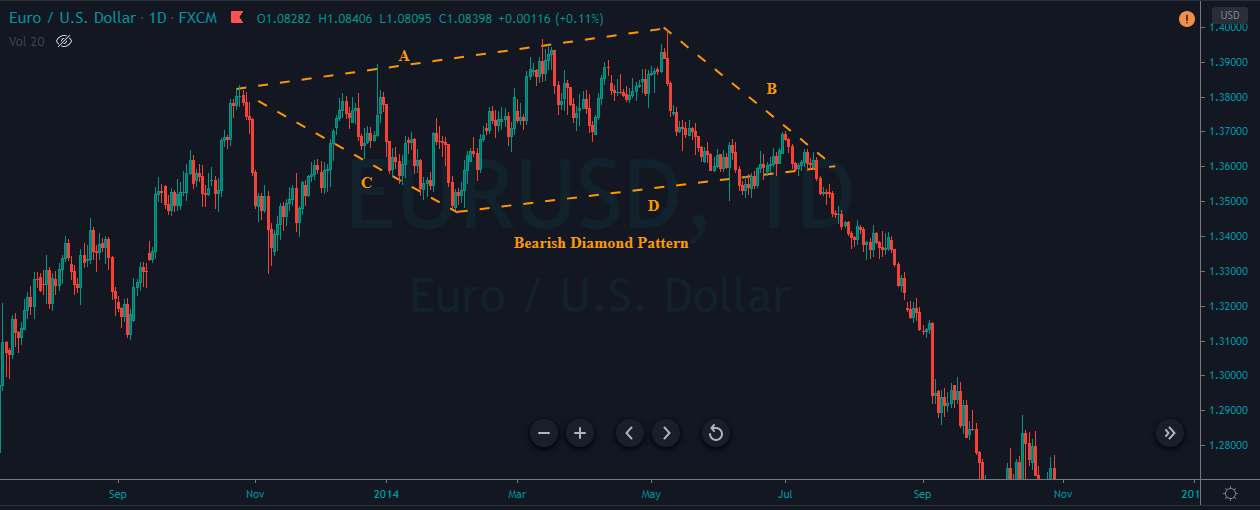
First of all, identify an off-shoulder head and shoulders formation on any asset chart. Next, we draw the resistance trend line from the left shoulder to the most recent higher high of the price action {line A}. Then from the higher high {head} to the right shoulder {line B} The price action should not break above the right shoulder trend line, if it is, then the pattern is invalid. To draw the lower trend line which is {line C} find out the most recent bottom tail and connect it to the left shoulder. Connect the right side support trend line from the bottom tail to the right shoulder line {line D.} Trading the diamond top pattern isn’t much harder than the other trading formations; here you only wait for the breakout to happen to take a trade. When price action breaks the pattern it indicates the buyers finally lost their control and sellers take over the whole show and they are ready to print the brand new lower low or higher high {according to the circumstances}.

Diamond Pattern Trading Strategies

Trading The Bearish Diamond Pattern

The image below represents the Diamond pattern on the EURUSD daily chart.

The image below shows our entry and exit in the EURUSD forex chart. As you can see in the image below, when price action followed all the rules of the bearish diamond pattern, we took the sell entry in this pair. Price action blasts after the breakout and it prints the brand new lower low. The Diamond pattern is quite a powerful pattern in the market, and it holds the ability to completely reverse the direction of the trend, so don’t take this pattern lightly, follow all the rules and go for the bigger targets. Initially, we set the smaller take profit in this pair, but the stronger seller move, convince me to go for the bigger targets in this pair. When the market gives you the opportunity milk the market as much as you can and go big.

Trading The Bullish Diamond Pattern

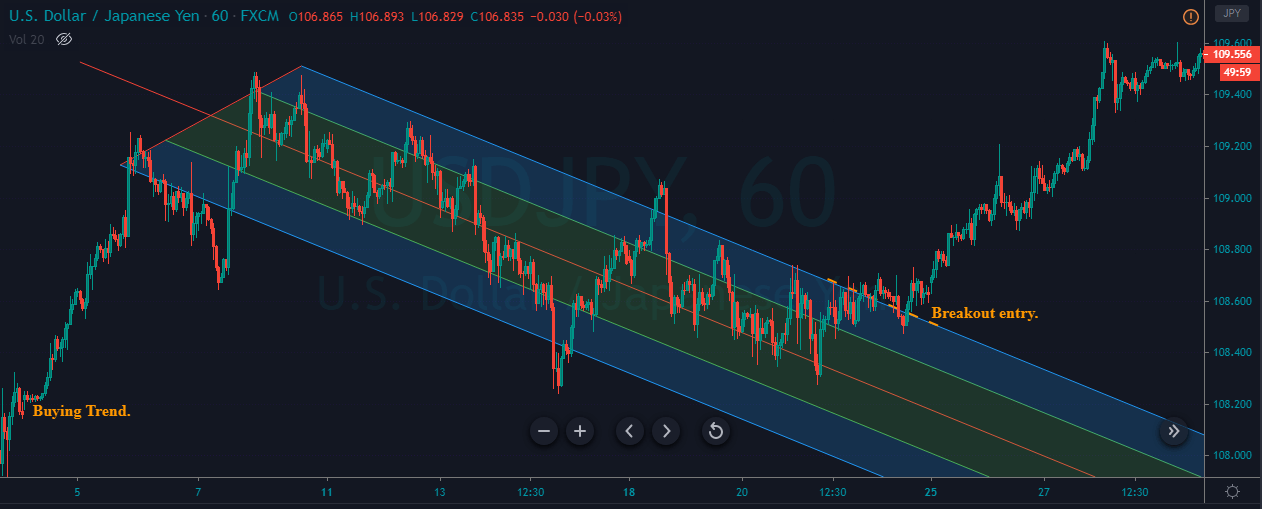
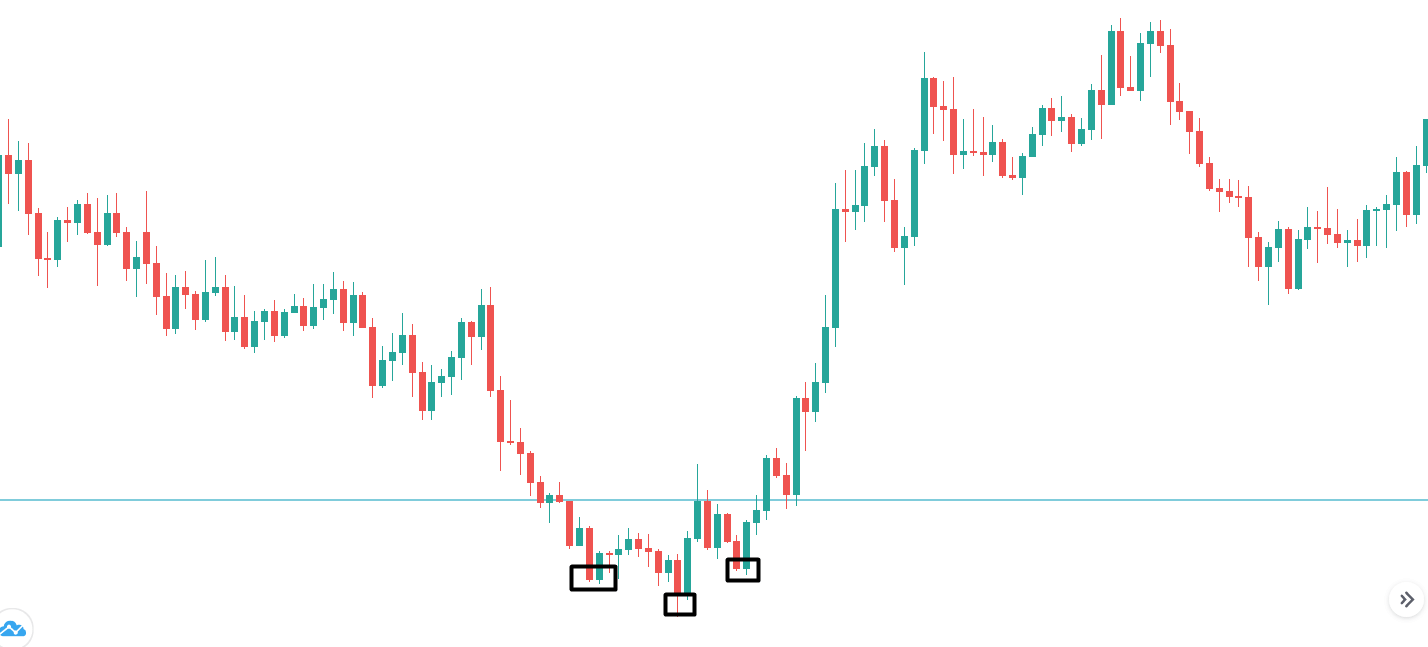
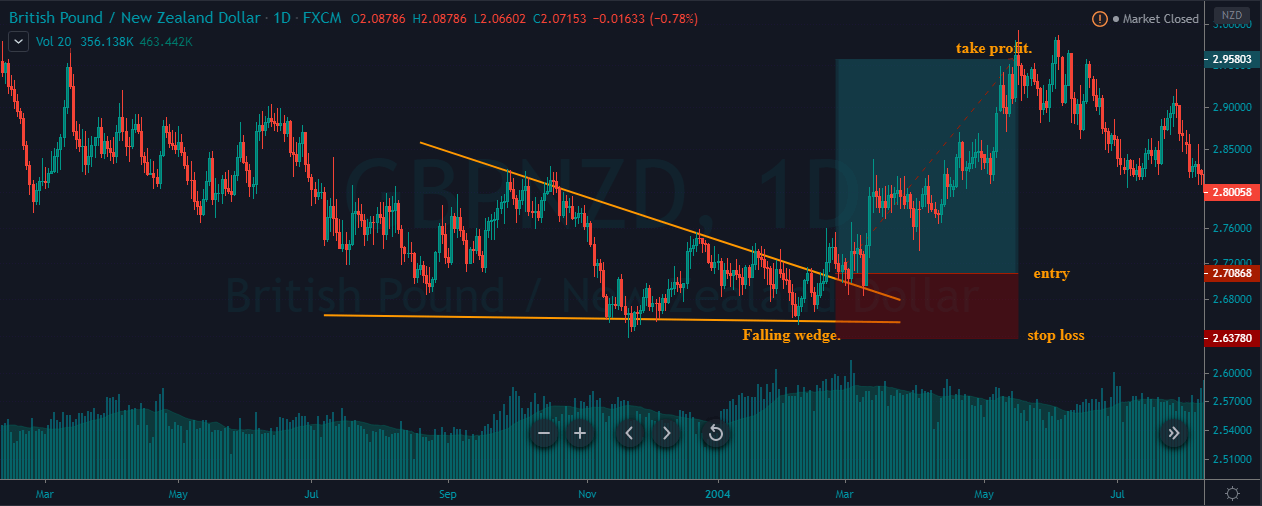
The image below represents the bullish diamond pattern on the EURUSD daily chart.

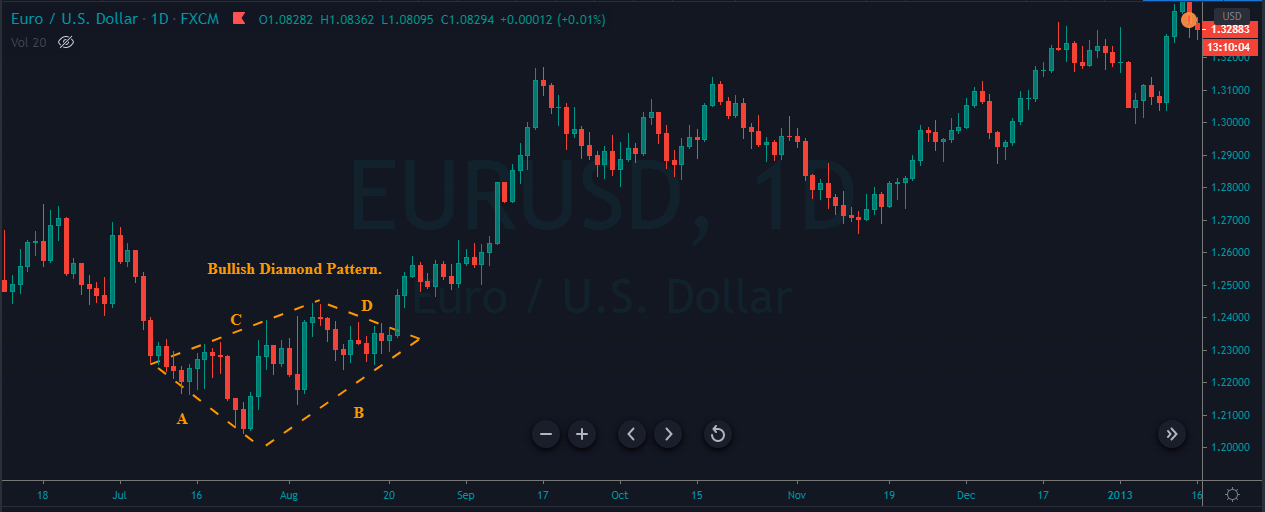
Before printing the diamond pattern, price action was in a strong downtrend, which is a good sign for us. What most of the traders do is they don’t like to follow all the rules and they sometimes trade the bullish diamond pattern in an uptrend and they end up losing in the trade. It’s not about the pattern only, the key to successfully trade all the pattern is to find out the pattern at the location where it makes the sense to trade.

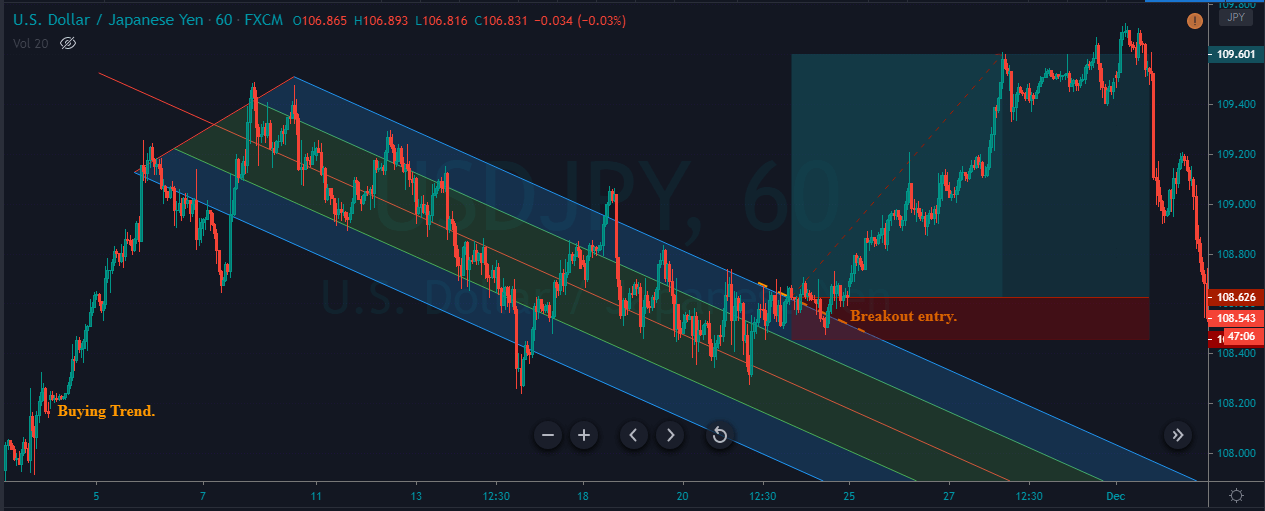
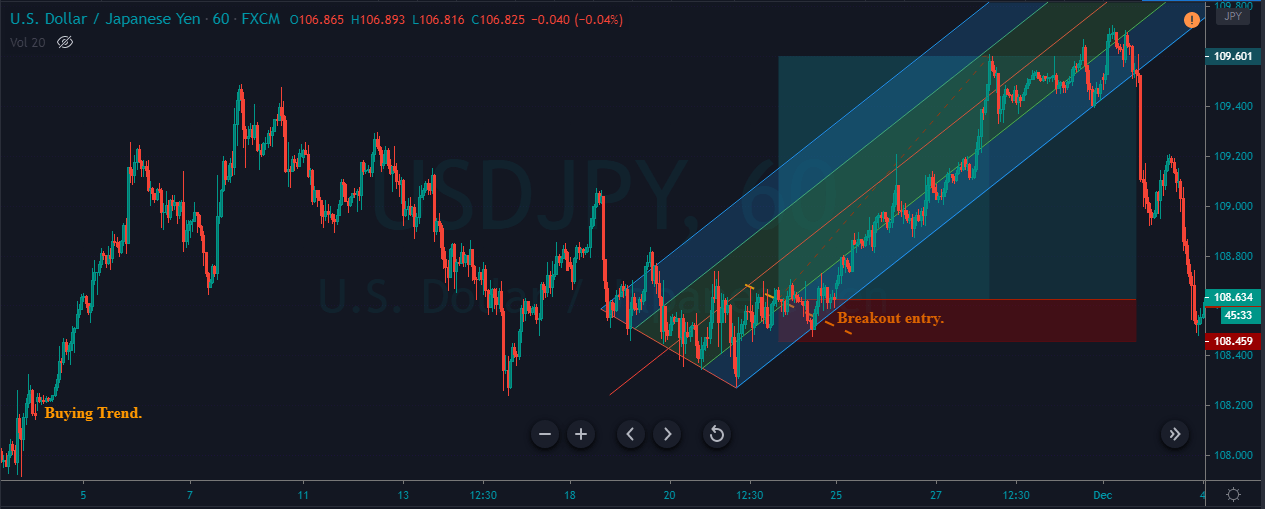
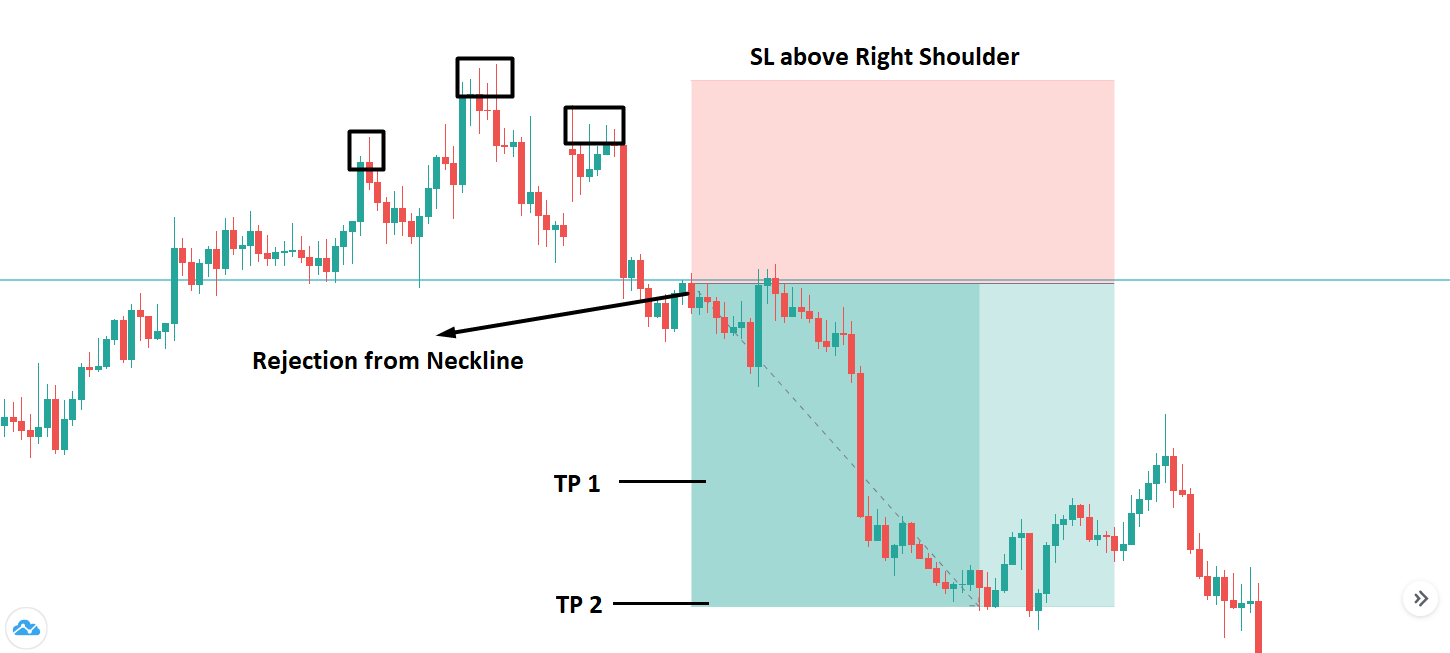
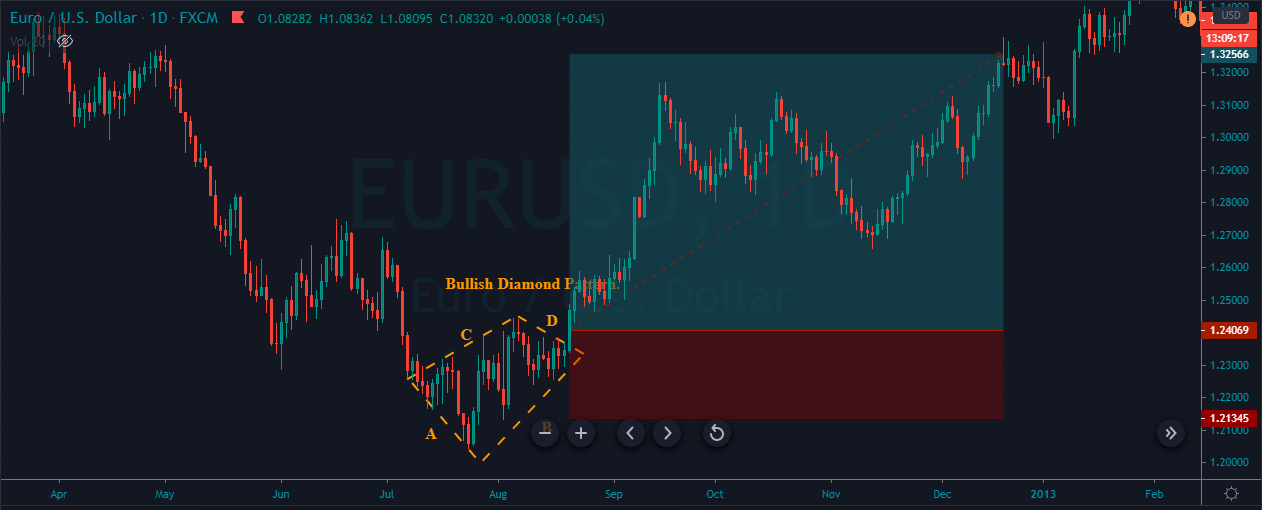
As you can see in the below image when the diamond pattern appears and it fulfilled all our rules we took the buy entry in this pair. After our entry price action prints the brand new higher high but we choose to close our position at the major resistance zone. The stop-loss order was just below line D, because line D is a breakout line and it acts as a major support to price action.

Conclusion

The diamond patterns are very rare to find out on the price chart, but when this pattern appears it often gives a good risk to reward ratios trades. If you are a beginner at this pattern, then first of all train your eyes to find this pattern on the price chart. As you gain experience you will automatically start spotting this pattern on the price chart. First of all, form the top resistance line by connecting the left shoulder to the higher high of the price action {line A}. Then connect the higher high to the right shoulder {line B}. Next draw the support trend line from the left shoulder to the tail {line C} and the tail to the right shoulder {line D}. Wait for the price action to break below or above the pattern {according to the market circumstances} to take the trade. For identifying the better and more opportunities, it is suggestible to find out this pattern in a highly liquid pair. It doesn’t matter which timeframe you trade this pattern appears everywhere and in every market, just simply take the advantage of the pattern by following the rules.

Categories
Forex Basic Strategies

Ever Heard Of The Andrew’s Pitchfork Forex Trading Strategy?

Introduction

Pitchfork is a technical indicator developed by Alan Andrews. This indicator consists of three parallel lines- These three lines help us identify the possible support and resistance levels. They also do help us in recognizing potential breakout and breakdown levels. With this, we can identify possible trading opportunities in the Forex market. Long term investors use this indicator to identify and gauge the overall cycles that affect the activity of the underlying currency pair.

Three lines of Andrew’s pitchfork tool are as follows. The first one is the median trend line in the center, and the two equidistant trend lines on each side. Moving from left to right of the chart, these lines are drawn by selecting the three points, which are usually a reaction of highs and lows. As long as price action holds inside the Andrew pitchfork tool, it indicates that the trend is in place. Reversals occur when the price breaks the pitchfork.

Andrew’s pitchfork indicator can be used on all the timeframes, and it works on every single chart. Note that this indicator works very well on all types of securities, such as stocks, cryptocurrencies, futures, or the Forex market.

Picking The Three Points

The first step to know before using Andrew’s pitchfork tool is to select the three points for drawing the trend lines. The first point that we chose must be either a high or low that occurs on the price chart. Once that point is chosen, we must identify the trough and peak to the right and left sides of this point. This must be a pullback, which is opposite in the direction of the ongoing trend. Once these points have been isolated, the indicator is placed on the price chart. The two prongs formed by the peak and trough serves as a support and resistance of the trend as shown below.

Trading Strategies Using The Andrew Pitchfork Tool

Mini Median Method

This one is the most basic and popular strategy used by the traders to trade the market using the Pitchfork indicator. We must place the Andrew Pitchfork tool in a strong ongoing trend and look for the buy/sell opportunities.

In the below image, we marked a few trading opportunities presented by this indicator.  We can see that when the price hits the lower line of the tool, we went long. Likewise, we have activated sell trades when the price action hits the median line. This strategy is basic, but it provides a good risk to reward ratio trades in a strong trending market.

In case of a buy entry, exit your position when the price hits the median line. Conversely, take sell when price reverses at the median line, and we can book our profit at the lower line. Place the stop loss a few pips above your entry and ride the move.

This approach works best for aggressive traders who prefer to pull the trigger when prices reach any significant level. So, if you are an aggressive trader, you can go with this approach. But if you are a conservative/confirmation trader, follow the next strategy.

For Conservative Traders

Most conservative traders do not prefer taking many trades in a single day because they tend to seek extra confirmation before pulling the trigger. This Pitchfork strategy is for them.

When the price action approaches the lower line of the indicator, wait for the price action to hold there to take entry. The holding confirms that the price action respects the dynamic support line, and going long from here will be a good idea.

As you can see in the below price-chart, the USDJPY was in a strong uptrend. We have identified three opportunities to go long, but out of three, only two trades were held at the lower support line to confirm the entry. Both of our trades worked very well, and they went on to make a brand-new higher high.

By using this approach, we can safely trade the market. We must always go for smaller stops because the holding at any significant area confirms the power of buyers.

Breakout Trading

Breakout trading is a popular way to trade the markets. Most of the highly successful traders, market technicians, chartists, banks, hedge fund managers use this approach to trade the Forex market. In this strategy, let’s understand trading the breakouts successfully by using the Andrew Pitchfork tool.

The idea is to find a strong trending market first and wait for the price to pullback. When the price gives enough pullback, place the Andrew pitchfork tool on price action and wait for the breakout in the ongoing trend direction. When the breakout happens, take the trade in the direction of the ongoing trend.

As you can see in the below image, the USDJPY was in an uptrend, giving quite deeper pullbacks. When we got enough pullback, we applied the tool on the price action, and when the breakout happened, we went long. Look for the breakouts only in the direction of the ongoing trend.

The chart below represents our buy entry and risk management in this pair. We went long when the breakout happened, and the stop-loss order was placed just below the breakout line.

There are several ways to book our profits. We can use indicators like RSI and Stochastic to confirm our exits. Here we have used the pitchfork itself to book our profit in the above-discussed trade. When we activate a trade at the breakout, the first thing we must do is to apply the Andrew Pitchfork tool in the direction of our trade and wait for the price action to break the tool to book the profits.

In the below image, we applied the tool when our trade took off, and at around 109.60, the price strongly broke the Andrew pitchfork tool. This is an indication for us to close our whole buying position. Also, you can notice that after our exit, the price action blasted to the south.

Conclusion

Just like other trading tools, Andrew pitchfork is not perfect. We need to have strong knowledge of the money management techniques in place before using this tool on live markets. If you are a novice trader, it is advisable to gain experience by experimenting with this tool on the demo account. Using this tool first hand, we are sure that you will discover various ways of using this tool. This will enhance your ability to understand the market better. Cheers!

Categories
Forex Basic Strategies

Trading The Most Popular ‘Head and Shoulders’ Pattern Forex Strategy

Introduction

Head and shoulder is a famous market reversal pattern. Most of the new and experienced traders use this pattern to identify the potential market reversal trade. Traders can use this pattern in every market, including forex, cryptocurrency, stock, indices, and commodities.

In this pattern, there is an indication that the price is trying to make a new higher but cannot do it. In the forex market, it is essential to understand the sentiment of buyers and sellers. In that sense, head and shoulder is a prominent price pattern indicating what buyers and sellers are doing in the market and how buyers got rejected from a potential zone.

What is the Head and Shoulder Pattern?

Head and shoulder is a price pattern that usually appears in an uptrend and indicates a price zone from where buyers are going to lose their momentum. A complete head and shoulder pattern indicates the start of a bearish trend. Therefore, if you want to join the bearish trend as early as possible, you should take trading decisions based on this pattern to have a better risk: reward ratio.

The head and shoulder pattern has three elements, as marked in the below chart.

The left shoulder is the ordinary swing high of a bullish trend. Later on, the head indicates another swing high indicating the continuation of the bullish trend. However, the right shoulder indicates that the price is unable to make another high above the head, which is an indication that buyers are losing their momentum.

On the other hand, the inverse head and shoulder are like the head and shoulder pattern that appears after a bearish trend. It indicates a potential market reversal from a bearish trend to the upside.

In the image below, we can see how an inverse head and shoulder looks like.

How to Identify the Head and Shoulder Pattern?

The head and shoulder pattern is prevalent in the chart that does not require any effort to see. You can easily spot it with the naked eye. Moreover, there are some Expert Advisors (EAs) or trading indicators that automatically show the head and shoulder pattern.

You can draw the head and shoulder pattern using the trendline (without ray) despite the automotive process. Later on, we should focus on the location of the pattern. If the head and shoulder pattern appears near any significant support level, it might not work well due to the lack of space for further price decline.

Overall, the head and shoulder pattern from a significant resistance level or key resistance level can provide a potential market reversal opportunity. Furthermore, head and shoulder patterns with significant economic events often make the level important among traders.

Head and Shoulder Pattern Trading Strategy

If you have read the above section, you would know that it is not difficult to find the price’s head and shoulder pattern. The profitability ratio of this pattern is very high, based on the previous trading result. There are several ways to make trades based on the head and shoulder trading strategy. However, the most reliable way to take the trade is from the neckline breakout.

Timeframe

The head and shoulder price pattern in a daily chart is more reliable than the head and shoulder pattern in a 5 minutes timeframe. The accuracy of this trading strategy increases if you move to a higher timeframe. However, it is often difficult for traders to take trades based on a weekly or monthly timeframe as it requires a lot of time and balance. Based on the retail and institutional traders, any time frame from 1 hour to a daily chart is perfect for this trading strategy.

Currency Pair

The head and shoulder trading strategy works well in all financial markets, including forex, cryptocurrency, stocks, indices, and commodities. Therefore, there is no barrier to use it on specific currency pairs. However, it is recommended to trade in major currency pairs as there is enough liquidity to provide a substantial movement without any unnecessary spike.

Entry

After forming the head and shoulder pattern, it is crucial to measure the price action at the neckline area. The neckline is a support level based on the lowest swing point of two shoulders and one head. In this trading strategy, you should wait for the price to break below the neckline with a big candle breakout. The strength of the breakout will indicate how reliable the upcoming bearish pressure is.

Later on, wait for the price to correct towards the neckline again with a corrective speed and enter the trade as soon as the price rejects the neckline with a bullish reversal candlestick.

Stop Loss

The stop loss will depend on two categories. If you are an aggressive trader, you can put the stop loss above the reversal candlestick with 10-15 pips buffer. In case the market moves above the neckline and hits your stop loss, it would indicate that the price made a false break below the neckline. However, the conservative approach is to put the stop loss above the left shoulder with some buffer. It would save your trading balance from the unusual market noise.

Take Profit

The first take profit level should be based on the 1:1 risk: reward ratio. You can close 50% of the position at the first take profit level and wait for the 100% of neckline to head for the final take profit.

Moreover, you should be more cautious in setting the take profit level by considering the near-term support and resistance levels. In the example below, we can see how the price broke below the neckline and retested it again to create a trading opportunity. Moreover, this image refers to how to set the stop loss and take profit levels.

Conclusion

The forex market is the world’s biggest financial market, which is very uncertain. Therefore, no trading strategy can guarantee a 100% profit. There is some possibility that your trade might hit the stop loss after taking the entry, instead of moving down. In that case, you should take the loss and wait for further trading opportunities.

The best way to keep yourself profitable in the market is to use appropriate money management and trade management rules for trading. Therefore, if you take 1% or 2% risk per trade, any unusual stop loss might not affect the overall balance.

Categories
Forex Course

119. Learning To Trade The Wedge Chart Pattern

Introduction

The Wedge is a technical chart pattern that is commonly used by the traders, market technicians and chartists to find the upcoming market trend. This pattern is always formed at the bottom/top of the trend, indicating a potential change in the market’s direction. In short, the Wedge is a trend reversal pattern. One key benefit of the Wedge pattern is they it is comparatively easy to identify on the price charts. This pattern is traded by most of the technical traders as it provides precise entries and exits.

There are two types of Wedge patterns – The Rising Wedge & the Falling Wedge.

The Rising Wedge

The Rising Wedge is a bearish reversal pattern, and it appears in an uptrend. This pattern seems to look wide at the bottom and contracts as the price move higher. To form a Rising Wedge pattern, two higher highs must touch the upper line; likewise, two reaction lows to the lower line. The point at which the upper and lower lines merge indicates the completion of the pattern.

The Falling Wedge

This pattern is just opposite to the Rising Wedge pattern. It appears in an ongoing downtrend, and it is a bullish reversal pattern. The appearance of these patterns is an indication for us to go long. This pattern begins wide at the top and contracts as the price moves lower. To form this pattern, the two lower lows must react with the support line, and the two higher lows must react with the resistance line. When both the lines converge, we can say that the pattern is complete.

Trading The Wedge Chart Pattern

The Rising Wedge 

The below chart represents the formation of a Rising Wedge chart pattern on the GBP/CAD Forex pair.

There are two ways to trade the Rising Wedge pattern. We can go short when the price hits the upper resistance line, and if the price breaks the below line, holding our positions for longer targets is a wise thing to do. The second and the conventional way is to wait for the price action to break below the support line and take the sell position only after the confirmation.

In the example below, we took sell entry when the price action broke the support line. Place the stop-loss just above the recent high and ride the markets for deeper targets. We had booked our profits when the price action started to struggle as it is an indication of a market reversal soon.

The Falling Wedge Pattern

The image chart represents the formation of the Falling Wedge pattern in the GBP/NZD Forex pair. We can see that both the parties were fighting in a downtrend and when the market prints a Falling Wedge pattern, it is an indication for us to go long.

At the beginning of March, the price broke above the Falling Wedge pattern, and we end up entering for a buy. The stop-loss was placed just below the support line, and the take profit was at the major resistance area.

That’s about Raising & Falling Wedge pattern and how to trade them. If you have any questions, please let us know in the comments below. Also, to learn advanced trading strategies related to this pattern, you can follow this link. Cheers.

[wp_quiz id=”74092″]