Introduction
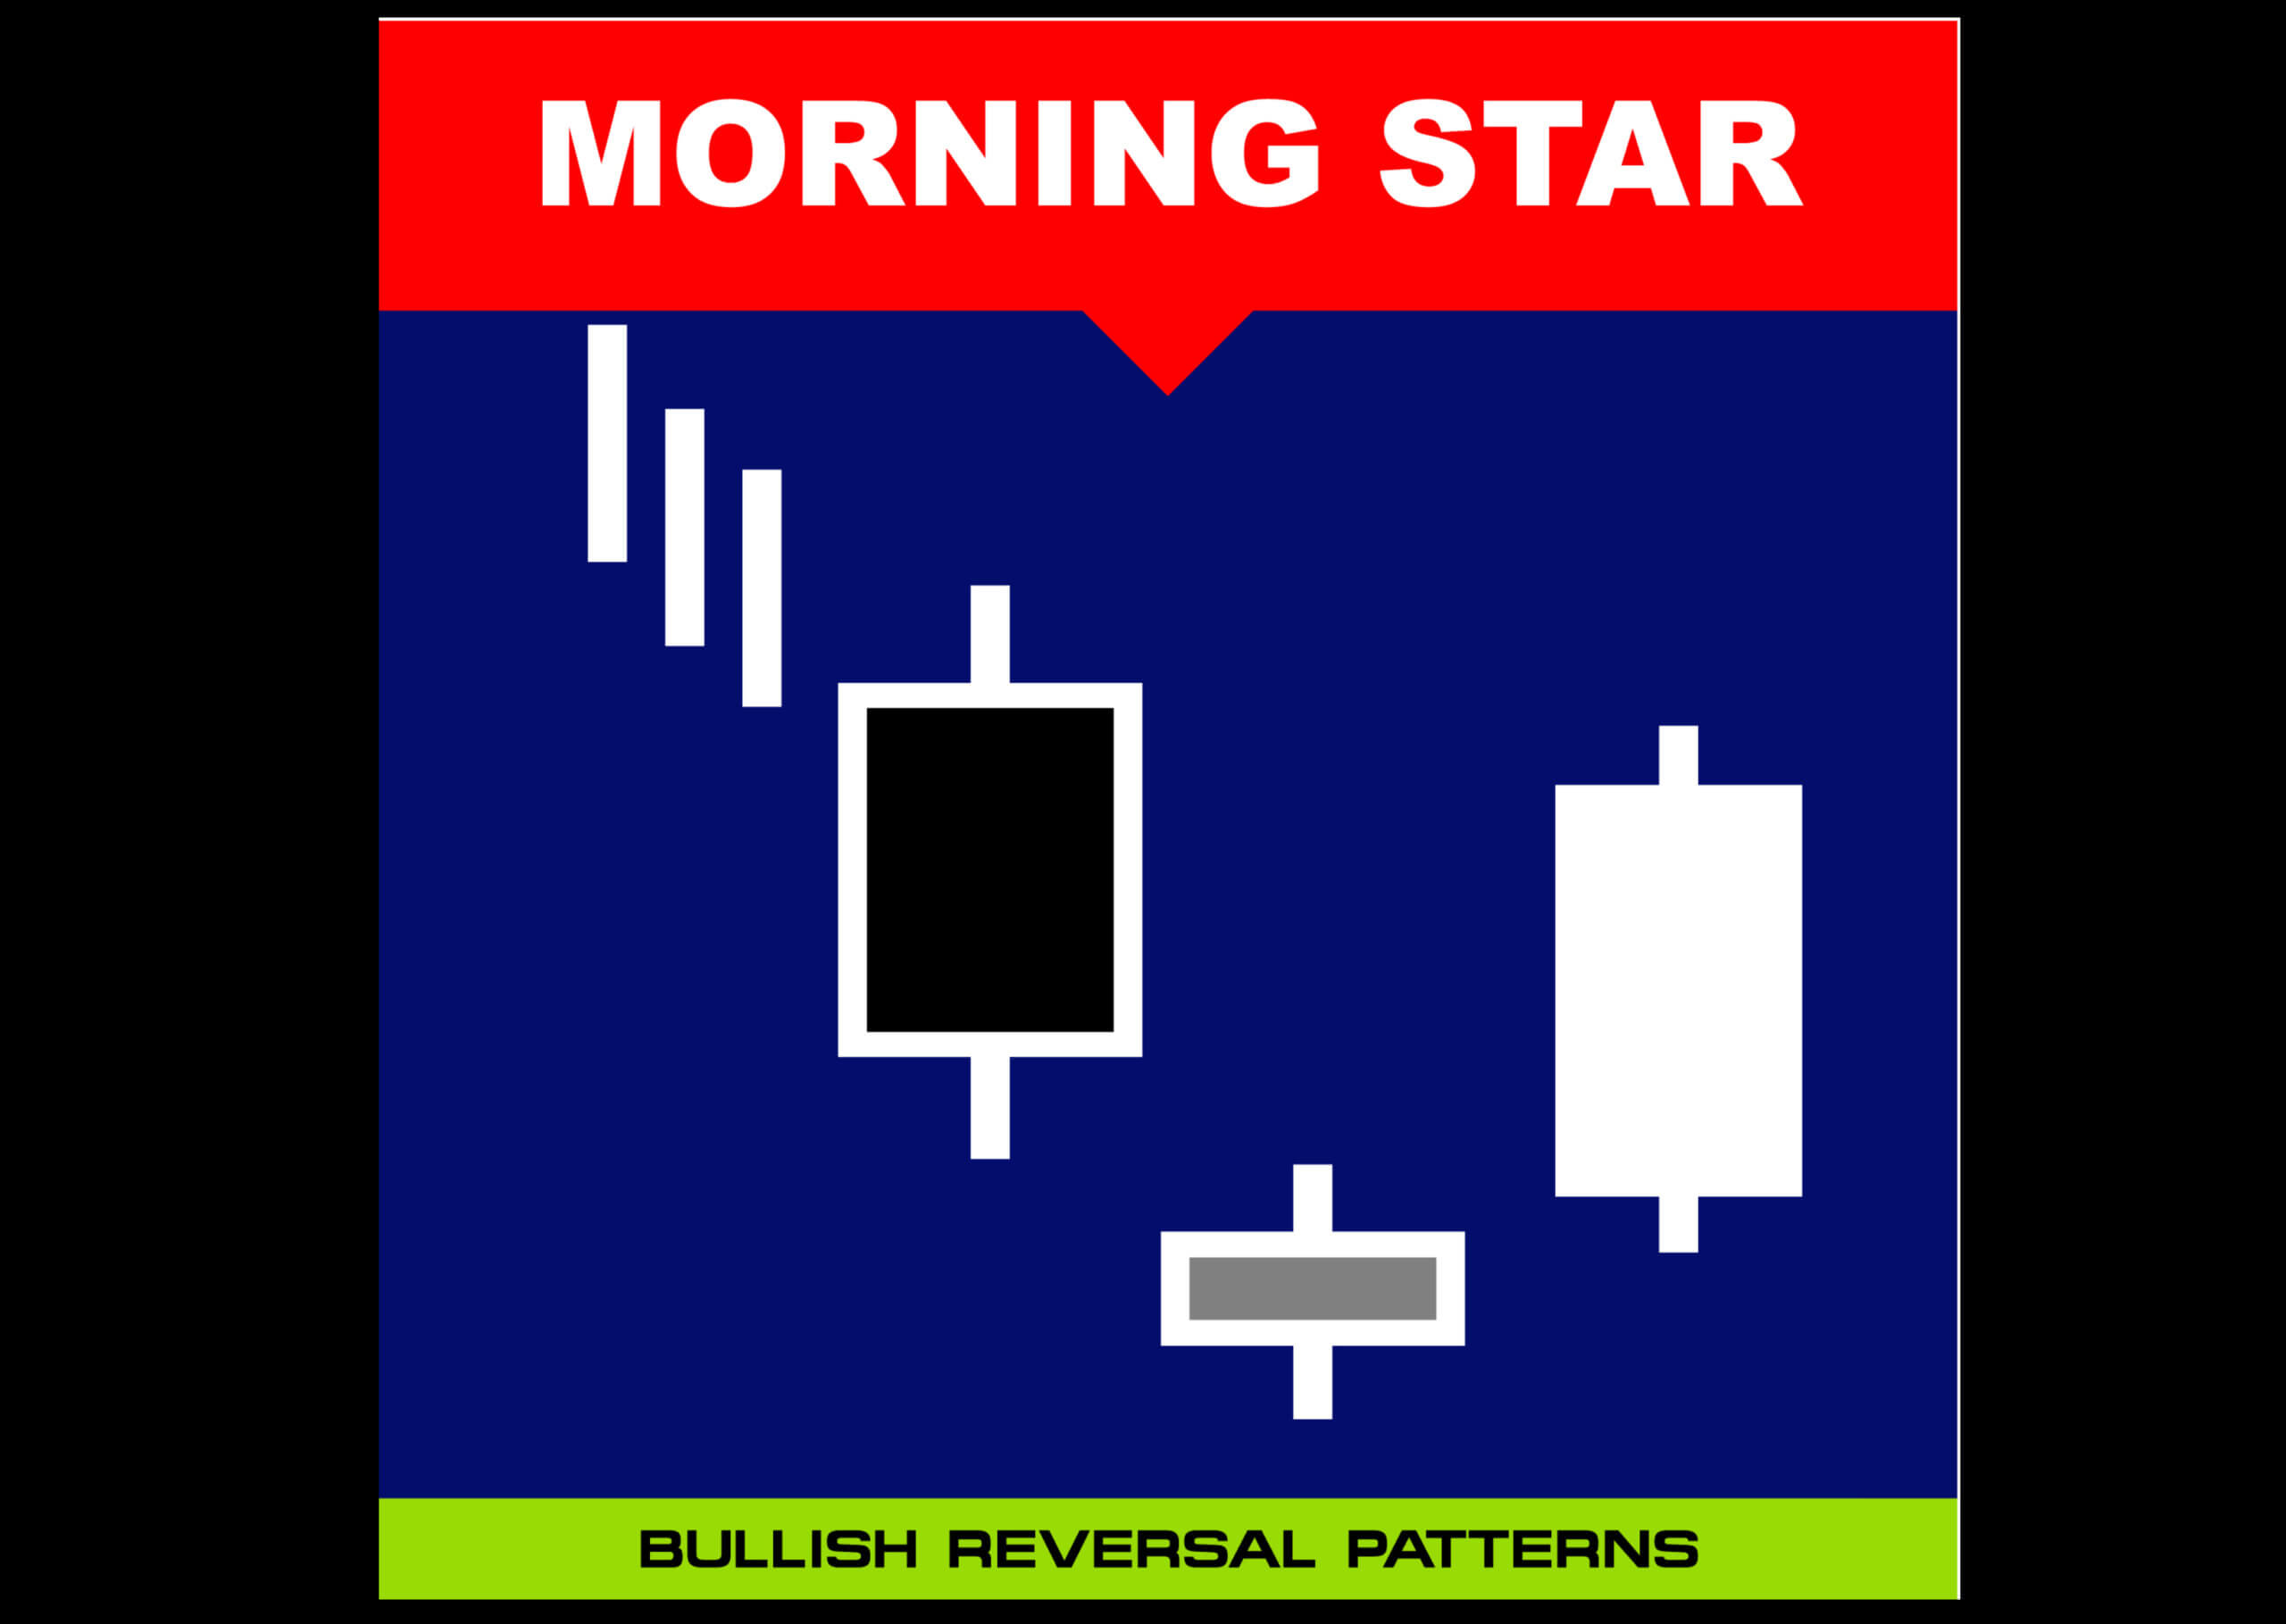
Morning star is a bottom reversal pattern, and it primarily consists of three candlesticks that indicate the bullish sign. This pattern warns the weakness in an ongoing downtrend that, in turn, suggests the start of an uptrend. Traders observe the formation of a Morning Star pattern on the price chart, and then they can confirm it with other technical tools.

The Three Candlesticks Of Morning Star Pattern
- Large Bearish Candle
- Small Bullish or Bearish Candle
- Large Bullish Candle
The most fundamental thing to remember is that the market should be in a downtrend to trade the Morning Star pattern. To confirm the downtrend, mark the lower lows and lower highs.
Large Bearish Candle is the first part of the Morning star reversal pattern. The bearish candle indicates the bears are in complete control, which means the continuation of the selling pressure. At this point in the market, we should only be looking for the sell trades as there is no sign of reversal yet.
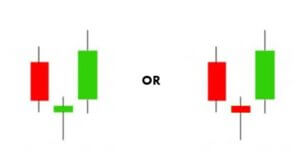
Small Bullish/Bearish Candle is the second candle that begins with a bearish gap down. This candle indicates that the sellers fail to push the price lower, despite trying really hard. The price action ends up forming a quite small bullish/bearish or Doji candle. If this candle is a small bullish candle, it’s an early sign of trend reversal.
Large Bullish Candle is the third candle that holds the most significance because the real buying pressure is revealed in this candle. If this candle begins with a buying gap, and if buyers can push the prices higher by closing the candle even above the first red candle, it is a definite indication of a trend reversal.
Trading strategy – Morning Star Candlestick Pattern
As we know by now, the Morning star is a reversal pattern. It mainly indicates the bulls taking over the trend while the bears lose the grip. Most of the beginners tend to trade the Morning Star pattern stand-alone. But we do not recommend this as it is not reliable enough. Always pair this pattern with some other credible indicators, support resistance levels, or trend lines to make profitable trades.
Morning Star Pattern + Volume
In this strategy, we have paired the Morning Star pattern with the volume. The volume plays a significant role in pattern formations. If the first red candle shows a low volume, it is a good sign for us. Then, if the second candle is green and the volume rises, it indicates the buying pressure. Lastly, the long green candle’s volume must be high. The high volume on the last candle shows the confirmation of the upcoming buy trend. If the third bullish candle has low volume, then try avoiding that Morning Star Pattern because the volume is not indicating the bullish reversal. If you observe the third candle closing with high volume, take up the buying position and ride the uptrend until there are any indications of a trend reversal.
Confirm the downtrend on the trading timeframe
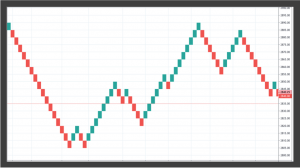
Confirmation is very important because, if there is no downtrend, there’s no point in trading the Morning Star pattern. You can confirm the downtrend on a higher timeframe or on your trading timeframe. As you can see in the below image, the overall trend of the CAD/CHF Forex pair was down.

Find out the Morning star pattern on your trading timeframe
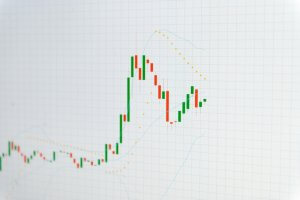
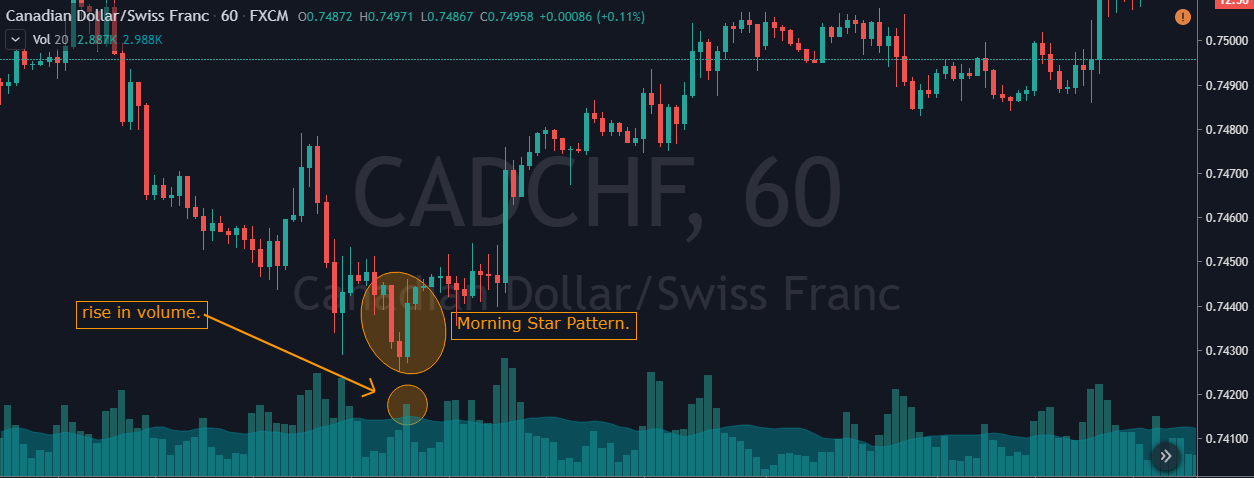
As you can see in the below CAD/CHF chart, the market prints the Morning Star pattern by following all the rules of our strategy. The first red candle was with low volume, and the second one was a small red candle. Hence there is no indication to go long in this pair yet. The very next was a long green candle with high volume. This is a strong indication of a trend reversal.
Entry, Take Profit and Stop Loss
We should be entering the trade when the next green candle closes. There are so many different ways to book profit. We can close the position at any resistance area or supply-demand zone. In this trade, we hold our positions because we took the trade from the beginning of a new trend. You can also close your positions when the price goes near the higher timeframe’s significant resistance level.

Pairing this pattern with volume makes it more reliable to trade. So it is a good idea to place the stop loss just below the second candle. In the above picture, you can see that we have put the stop loss just below the second candle, and we have also booked the profit at the higher timeframe’s major resistance area.
Reliability of Morning Star Pattern
This pattern is very easy to identify on the price chart if you are an intermediate trader. Even novice traders can easily spot it on the chart with little practice. Morning Star pattern often gives us well-defined entries and good risk-reward ratios. The only limitation of this pattern is that, if the sellers are strong enough, the prices could go further down despite the formation of the Morning Star Pattern. Hence it is always recommended to combine this pattern with some other trading tools rather than trading it stand-alone.
We hope you find this article informative. Try trading this pattern when you see a perfect downtrend next time. Let us know how the results have been in the comments below. Cheers!