Introduction
If you are a Forex trader, you can agree-many winning strategies exist out there. And Renko charts are among the handy weapons you can deploy to your advantage. This write-up will help you grasp handy tips to get your feet wet, as well as scaling your trading into a profitable trajectory.
Renko charts are not very popular as bars or candlesticks among traders. However, they can be very profitable when a trader uses them correctly. Renko chart trading is a robust way to analyze price trends, and even superb when you combine it with another tool to confirm entry and exit positions.
What Is Unique With Renko?
Well, Renko charts only show you the price movements of an underlying asset without factoring in time and volume. The formation of a Renko bar or body is in one direction. And it forms only when prices move by a predefined amount in pips. You can adjust the number of pips per block to suit your needs or trading strategy.
Also, a subsequent Renko bar can only form either adobe or below a previous one. It’s that model that shows you the price direction with unique preciseness.
Their naming arises from Japanese “Renga,” which means brick. Therefore, Renko charting arises from a series of blocks. In the light of Forex trading, the charting of the blocks moves up or down with prices.
Advantages of Trading Forex using Renko charts
- Renko charts are simple in both ease of interpretation and use.
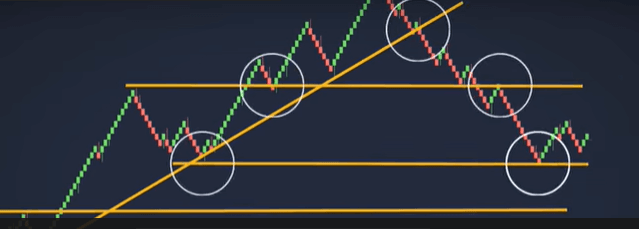
- Great for determining the levels of support and resistance.
- Traders can adjust the block sizes to suit their trading needs.
- Renko charts are great at signaling price breakout or reversal.
- Ideally, Renko charts only show you how prices are moving.
Overall, Renko charts give traders an edge with overly volatile commodities like Oil and Gold. The charting digs deeper into the pricing histories. The charting model behind Renko builds on plotting price on the -Y-axis Vis a Vis time.
Renko beats conventional price-charting by removing insignificant price movements.
There are three metrics that Renko shades off from ordinary price action. And they are:
- Any false price breakouts
- The candle-wicks
- The price volatility
Ideally, it pays attention to the critical metrics: support, resistance, and the trend.
Whenever prices move, Renko converts that into a commensurate block on the chart. And every block forms after price confirmations. The reality is, Renko charts do not work with partial blocks. They have to be wholesome and in line with the set numbers per single block.
As a trader, it makes great sense if you’re able to sift out short-term fluctuations out of a price chart. Beauty is Renko charting is a great tool at that. Price volatility is the greatest enemy for many traders, especially if you can only bring in a small trading margin.
While most traders can establish trends from normal price- charting, Renko charting is another wholesome set of trading tools to help you sharpen your decisions while trading.
More Pointers with Renko Charts
As indicated earlier, Renko charting creates blocks after by concurrently establishing the closing positions of a previous block. Next, subsequent blocks can only form either below or above a previous one.
Using the precedence above, Renko charting brings you a precise tool into your trading arsenal to help you view trends more clearly. Along with that, it’s also important to calculate the most appropriate block size – in line with the asset you target to trade.
Calculation of Renko blocks
There are two documented methods for the determination of the optimal sizes of Renko blocks.
First is the ATR or Average True Range. It relies on the ART indicator to determine the height of an ordinary candlestick.
Second is the model where a trader provides a predefined value for the size of a block.
So, new blocks only form when price movements meet the minimum value set for a block.
Sniffing a Buy Opportunity with Renko Charts
Image credits: best-trading-platforms.com
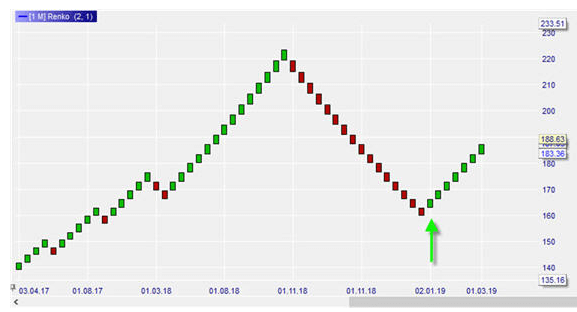
Renko charts help traders spot trend directions very clearly. And there are two ways to spot an opportunity to go long. Using the image above, a monthly view of a stock’s prices is visible. Simple, green bricks signify uptrends, while the ref ones signify the downtrend.
Primarily, the years 2017 and 2019 are trends – good opportunities to go long (buy). Towards the end of 2018, there’s a trend reversal (bricks turn red- the opportunity for buyers to exit and pocket profits)
Also, the same trend reversal creates an opportunity for traders to go short and also take profits. Look at 2019 also; the green bricks signify the continuity of the uptrend.
Image Credits: best-trading-platforms.com
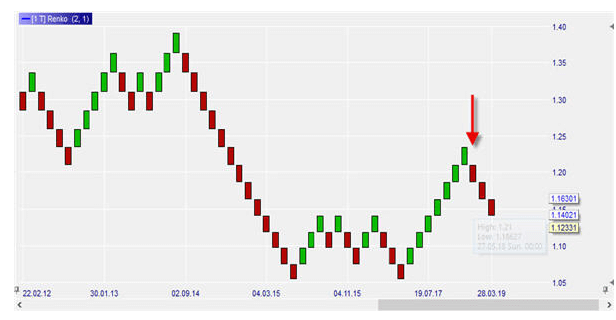
Look at the figure above, the EUR/USD pair oscillations ranging from 1.0500 – 1.1500 from 2015 through to -2016. Also, notice the uptrend starting from 2017 but with a reversal along the way. Uptrends are opportunities to go long, while downtrends are opportunities to go short.
Pro Tip: If you are looking to upscale your trading success, Renko charts greatly help. However, ensure that aside from mastering them, it’s excellent to confirm the trends, support, and resistance levels using one or more indicators.
Keep in mind that trading success arises from careful analysis of entry and exit positions. Upfront, it may seem cumbersome – taking time to do the due diligence in the analysis. Utmost, do not trade with emotions. Renko charts and many other tools will help you sharpen your analysis.
The preciseness and effectiveness of a strategy arise from long spells of practical use. Renko is a super-tool for scalping when you compare it to classical price charting or bar or candlesticks.
Other handy trade signal tools to combine with Renko Charts
- Simple Moving Averages -SME Enter trades with three bars in the direction of the trend and 10 SME sloping downwards or upwards. (This will help you avoid false breaks in a reversal against the trend)
- On Balance Volume –OBV Enter trades when you confirm the trend and SME as tally that with OBV indicator’s direction.
Parting Shot
Renko charting brings in more preciseness for your trend confirmation in line with price action and the trend. It helps you filter out the noise with volume and time and leaves you with price direction only. For successful scalping, incorporating Renko is a better way to go about it. Renko charts help you keep the focus on the trend for position trades and note it’s the reversal in good time to exit.


