Introduction
Sometimes it is best to choose the simplest path of trading. The Relative Strength Index (RSI), invented by Welles Wilder, is one of the oldest and most popular technical analysis tools. If best traders in the world were asked to rank the technical indicators, RSI would certainly be accorded in the top five. It has the unique ability to measure turns in price by measuring the momentum of the turn, which is impossible by any other technical tool in technical analysis.
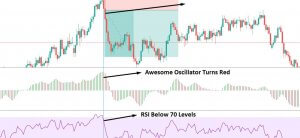
The standard RSI setting of 70 and 30 serves as a clear sign of overbought and oversold, respectively. The RSI rollercoaster is a strategy that we have developed to take advantage of these turns in the market. The purpose of RSI rollercoaster is to make money from range-bound currency pairs.
Time Frame
This strategy is suitable for trading on the ‘daily’ time frame. It can also be used on the smaller time frames, but the success rate is not very encouraging.
Indicators
As the name suggests, we will be using the RSI indicator for the strategy. No other indicators will be used. Sime knowledge of price action will be helpful.
Currency Pairs
This strategy applies to all the currency pairs listed on the broker’s platform. If trading on the lower time frame, we need to look for highly liquid currency pairs.
Strategy Concept
The key to the RSI rollercoaster strategy versus the traditional RSI strategy is the way of trading the overbought and oversold levels. Here we look for a reversal candle, which provides a sign of exhaustion before taking the trade. This way, we prevent ourselves from picking the top or bottom of a ‘range’ by waiting for an indicator confirmation.
This strategy works best in a ‘ranging’ market where overbought and oversold signals are far more true indications of change in direction. Furthermore, from experience, we have observed that the setup is much more accurate on the ‘daily’ charts than on the smaller time frames such as the 4 hours or 1 hour.
The primary reason for this difference is that ‘daily’ charts include far more data points into their subset and, therefore, change in momentum tends to be more meaningful on longer time frames. Nevertheless, the disproportionate risk to reward ratio in this setup makes even the shorter time frame trades worth considering. We keep in mind that although the setup will fail more frequently on the shorter time frames, the losses will generally be smaller, keeping the overall risk manageable.
Trade Setup
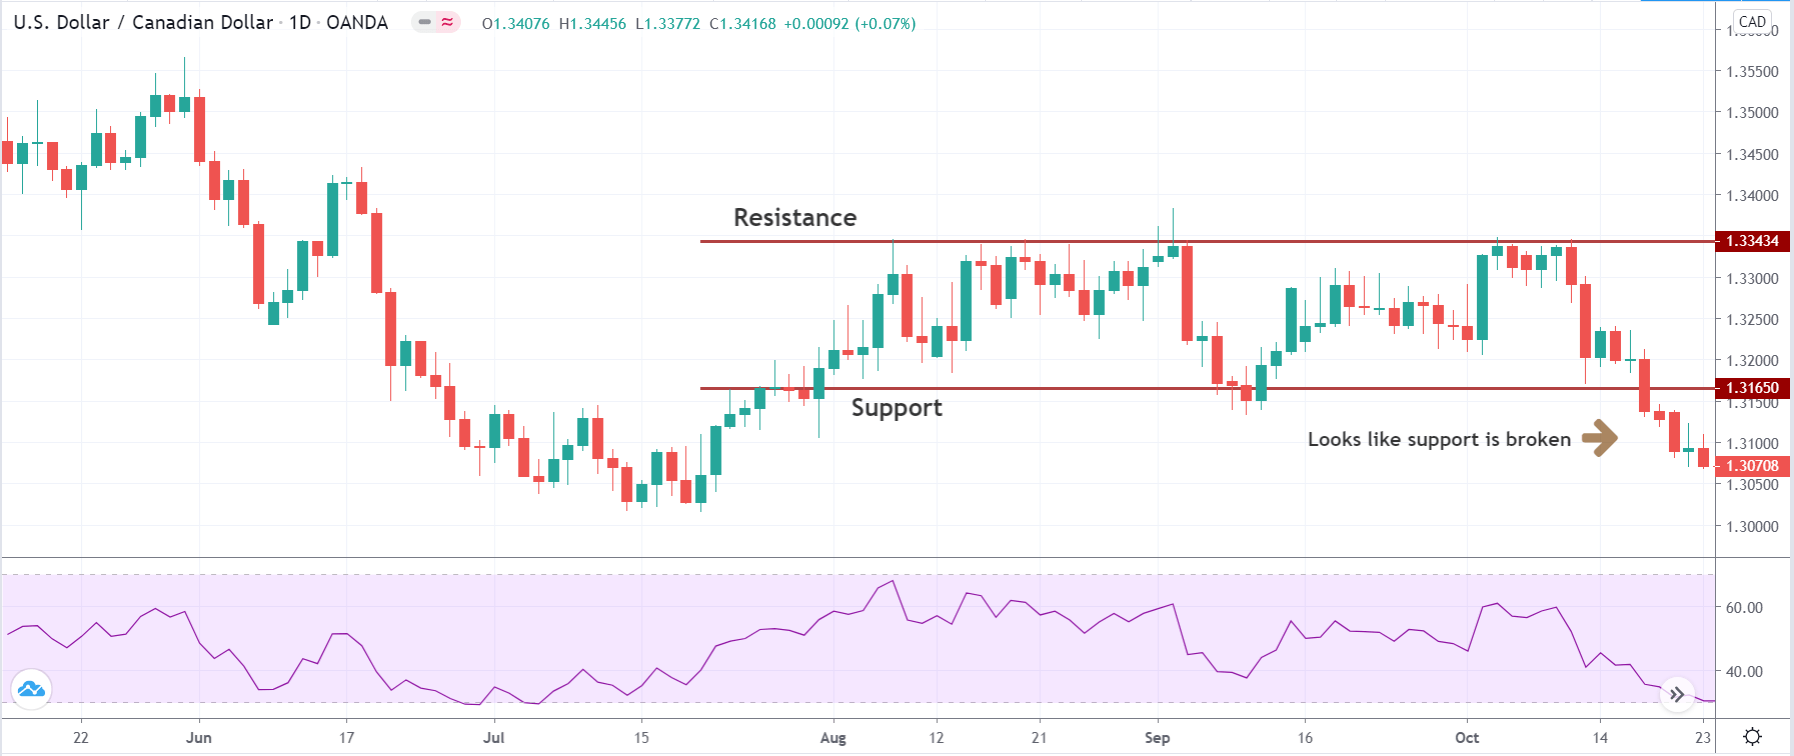
In order to explain the strategy, we have considered an example of such a trade that was carried out on the USD/CAD pair. As the strategy produces a better result on the ‘daily’ time frame, we will be applying it to the ‘daily’ time frame chart. Let us see the steps to execute the strategy.
Step 1
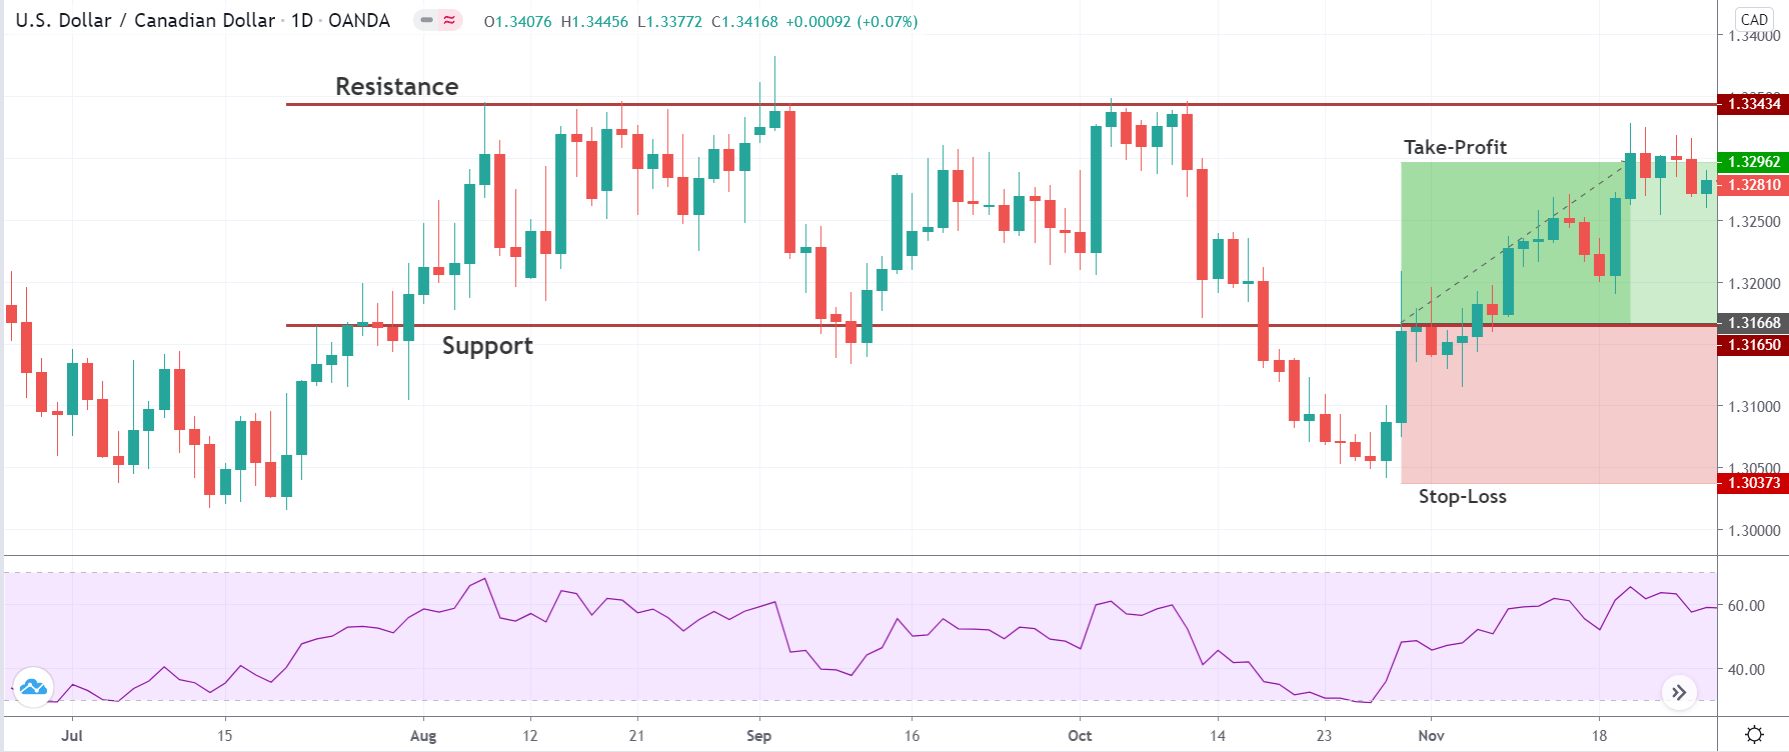
The first step of the strategy is to open the ‘daily’ (preferable) time frame chart of the desired currency pair. Identify key levels of ‘support’ and ‘resistance.’ A ‘support’ or ‘resistance’ is only valid if the price has reacted off from this area at least twice. If the price has reacted only once, that means a ‘range’ has not yet been established.
The below image shows the clear formation of a ‘range’ where the price has reacted multiple times from the ‘ends.’

Step 2
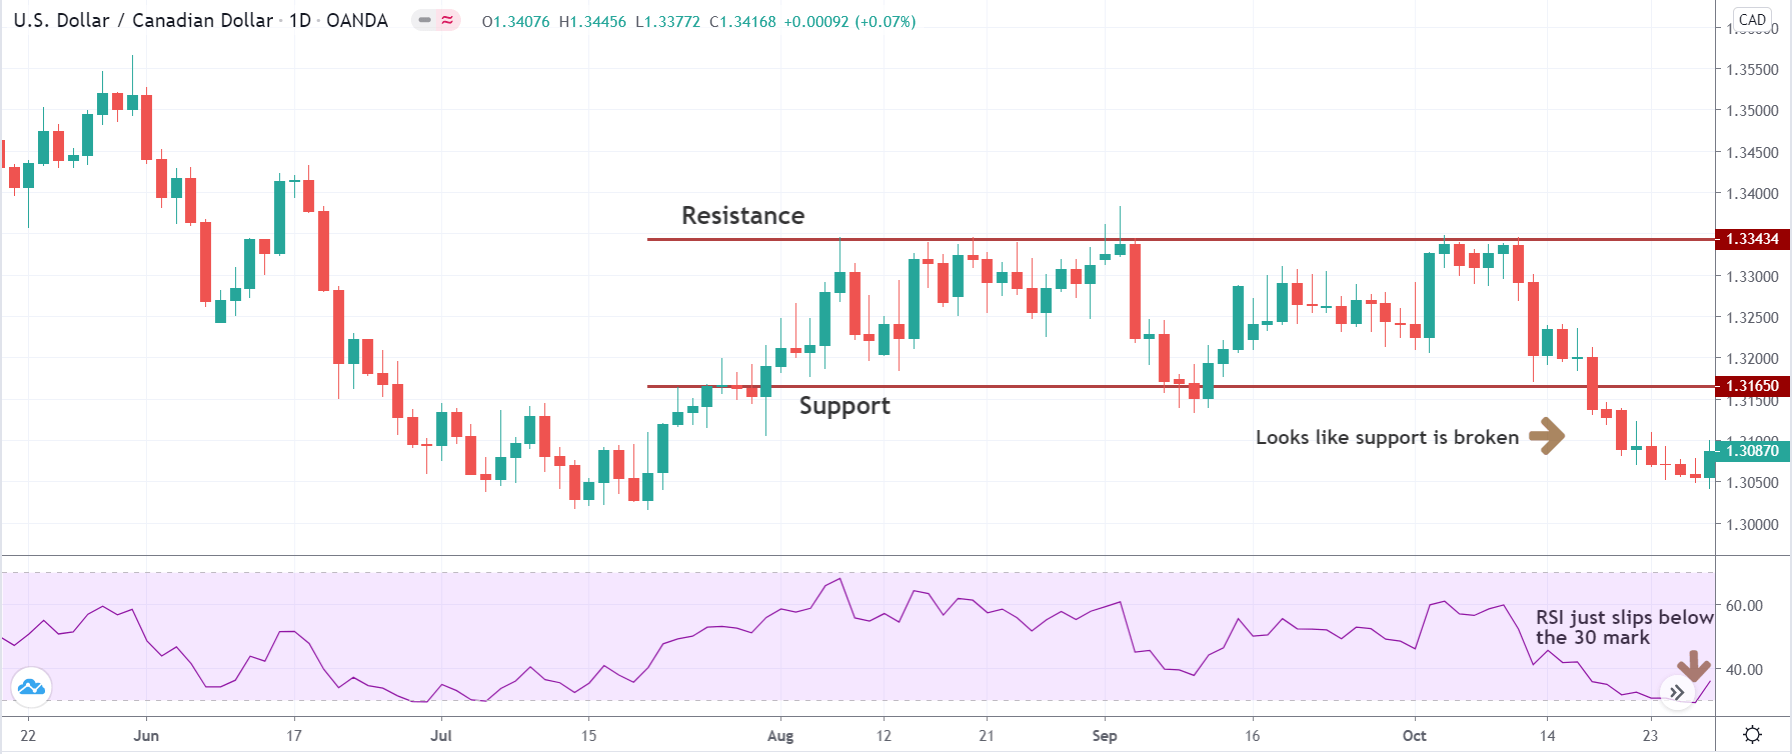
In this step, we wait for the RSI indicator to cross above the 70 ‘mark ‘when the price is near ‘resistance’ or cross below the 30 marks when the price is near ‘support.’ During this time, the price action of the chart is not of much importance. Once the RSI shows a reading below 70 after crossing it, we will look for ‘sell’ opportunities depending on the price action. Similarly, when the RSI shows a reading above 30 after crossing below it, we will look for ‘buy’ opportunities depending on the price action.
In this case, we can see that the price breaks down below ‘support,’ which is an indication of ‘sell’ as per the theory of support and resistance. But as per our strategy, we will not be looking at the price action in this step, and we will focus only on the RSI indicator.
A few days later, we see that the RSI goes below the 30 ‘mark’ for a moment and starts moving higher. This is our first indication of going ‘long’ in the market.
Step 3
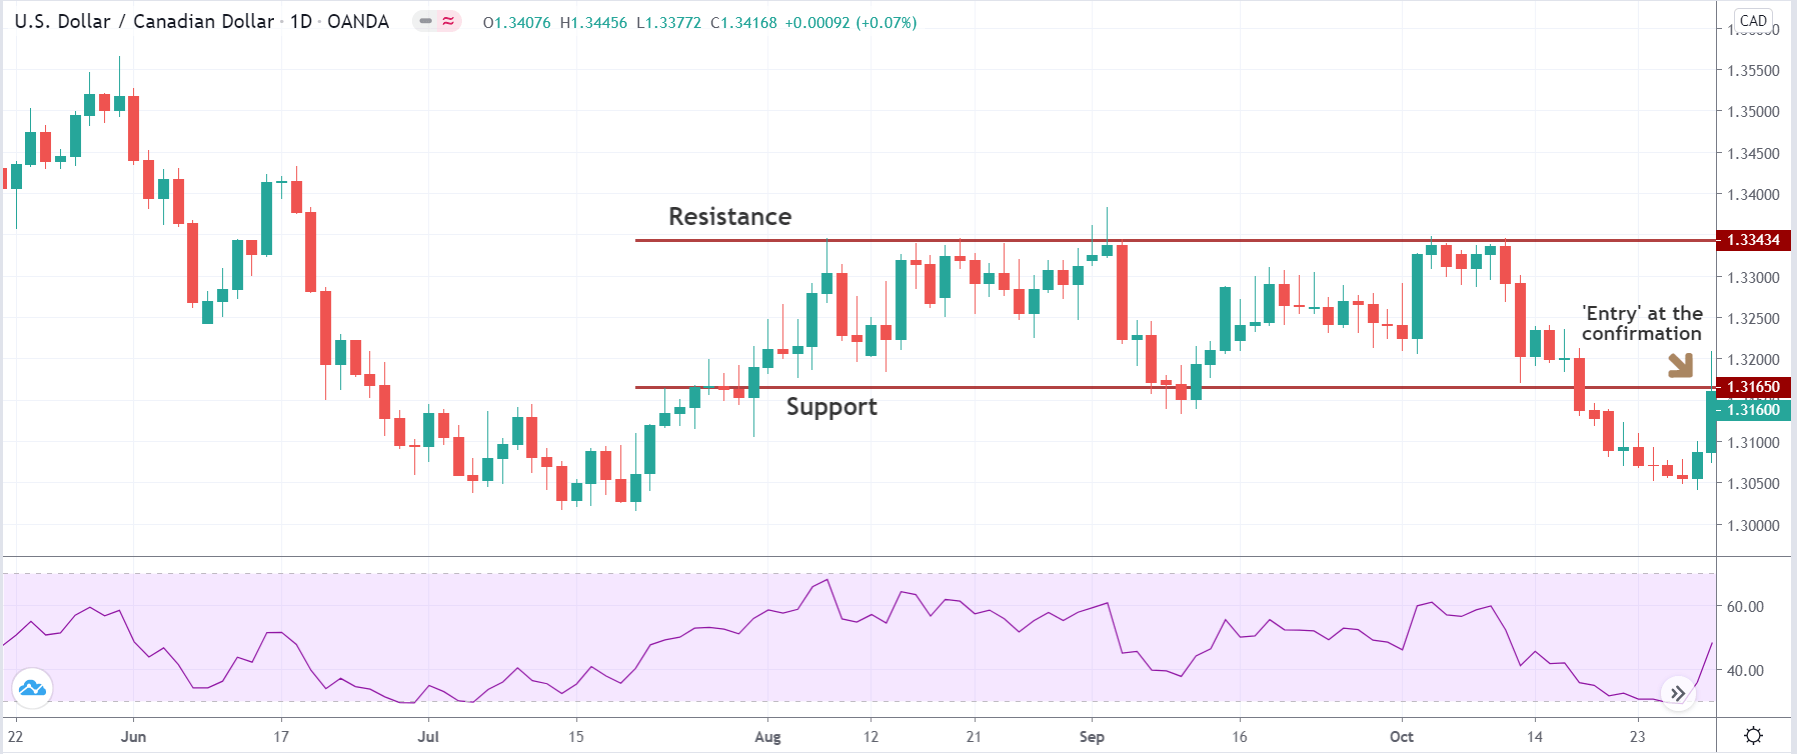
We ‘enter’ for a ‘sell’ when the price moves back into the ‘range’ after the indication from RSI. Similarly, we enter for a ‘buy’ when the price moves back into the ‘range’ after the indication from RSI. This price action indicates a false breakout or breakdown, which is identified rightly with the help of an indicator.
In our case, we are entering ‘long’ in the currency pair after we get a confirmation in the form of a bullish candle, as we can see in the below image.
Step 4
In this step, we determine the ‘stop-loss’ and ‘take-profit‘ levels for the strategy. When executing a ‘long’ trade, the stop-loss will be placed just above the ‘high’ where the price created a false breakout. And when executing a ‘sell’ trade, the ‘stop-loss’ will be placed just below the ‘low’ from where the price created a false breakdown. The ‘take-profit’ depends on the major trend of the market. If we are trading against the trend, it should be kept at 1:1 risk to reward or even a little lesser than that. If the ‘trade’ is taking place with the trend, it can be kept at 1:2 risk to reward.
Strategy Roundup
The RSI rollercoaster strategy is designed to squeeze as much profit as possible out of the turns at ‘support’ and ‘resistance.’ Instead of immediately entering into a position when the market moves into an overbought or oversold zone, the RSI, along with a little bit of price action, keeps us away from the market until we get a confirmation sign of the exhaustion. The RSI rollercoaster is almost always in the market, as long as we see wild moves on either side of the ‘range’ to stop-out traders.