Introduction
Bill Williams was the one to first developed the Awesome Oscillator, and it essentially indicates the market momentum. On the other hand, RSI (Relative Strength Index) is a trading indicator that provides an idea of the overbought and oversold zone. In the Awesome Oscillator based trading strategy, we will use the Awesome Oscillator to determine the market direction and use the RSI to increase the probability by eliminating unwanted market movements.
The Awesome Oscillator
Bill Williams has created the Awesome Oscillators to identify the market momentum of a currency pair. Besides the forex market, this trading strategy works well in all financial markets, including the stock, indices, cryptocurrencies, and commodities. The elements of this trading indicator are pointed out in the image below.
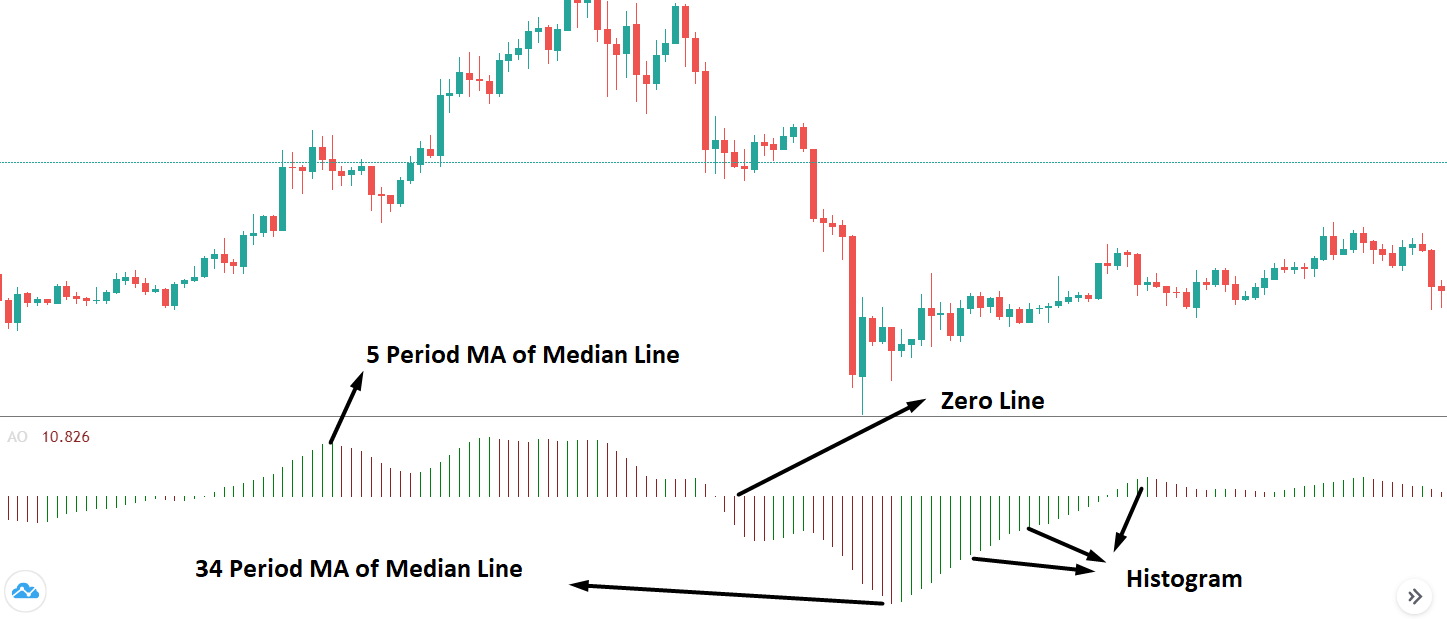
- The first element of Awesome Oscillator is the 34 period’s simple moving average indicating the median of the last 34 candlesticks.
- 5-period simple moving averages indicate the median of the last five candlesticks.
- Histogram and Zero Line.
Let’s have a look at how these elements represent in a market:
- When the Awesome Oscillator is below the zero lines, we should focus on the short term moving average. If the 5 SMA moves below the 34 SMA, it will indicate a downtrend.
- If the position of Awesome Oscillator is above the zero lines, we can consider the trend as an uptrend.
- If the Awesome Oscillator histogram moves to the green zone, we can consider the candlestick that moved higher than the previous candle.
- We will consider the histogram at the red zone that is smaller than the previous candlestick.
- The rules mentioned above are not exact buying and selling signals. Instead, it provides a trading opportunity where traders should consider other confirmations.
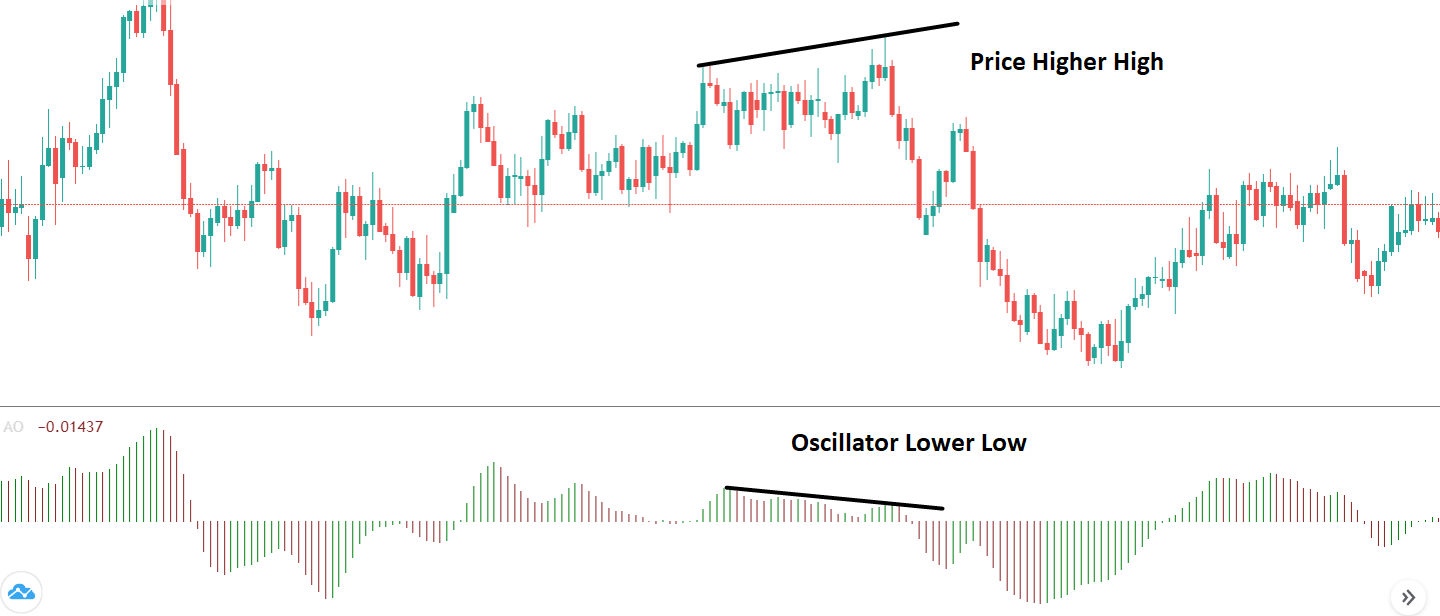
We can also identify the divergence between the price and the Awesome Oscillator to find a trading opportunity.
If you see the price of a currency pair to make a lower low from the left side to the right side, but the Awesome Oscillator makes the opposite, you can find a potential divergence. In divergence, the Awesome Oscillator should create two peaks above the zero lines considering the market condition.
Awesome Oscillator with RSI Trading Strategy
In this trading strategy, we will combine the Awesome Oscillator to identify the market momentum and the Relative Strength Index to get the overbought or oversold zone. If we can combine these accurately, we can make a trading strategy that can provide a good profit.
This strategy works very well in most of the currency pairs and time frames. Therefore, we can take swing trade, day trade, and even position trade. Besides the technical formation using these two indicators, we will use price action to enter the trade. Moreover, we will use stop loss and take profit as a risk management tool before taking the trading decisions.
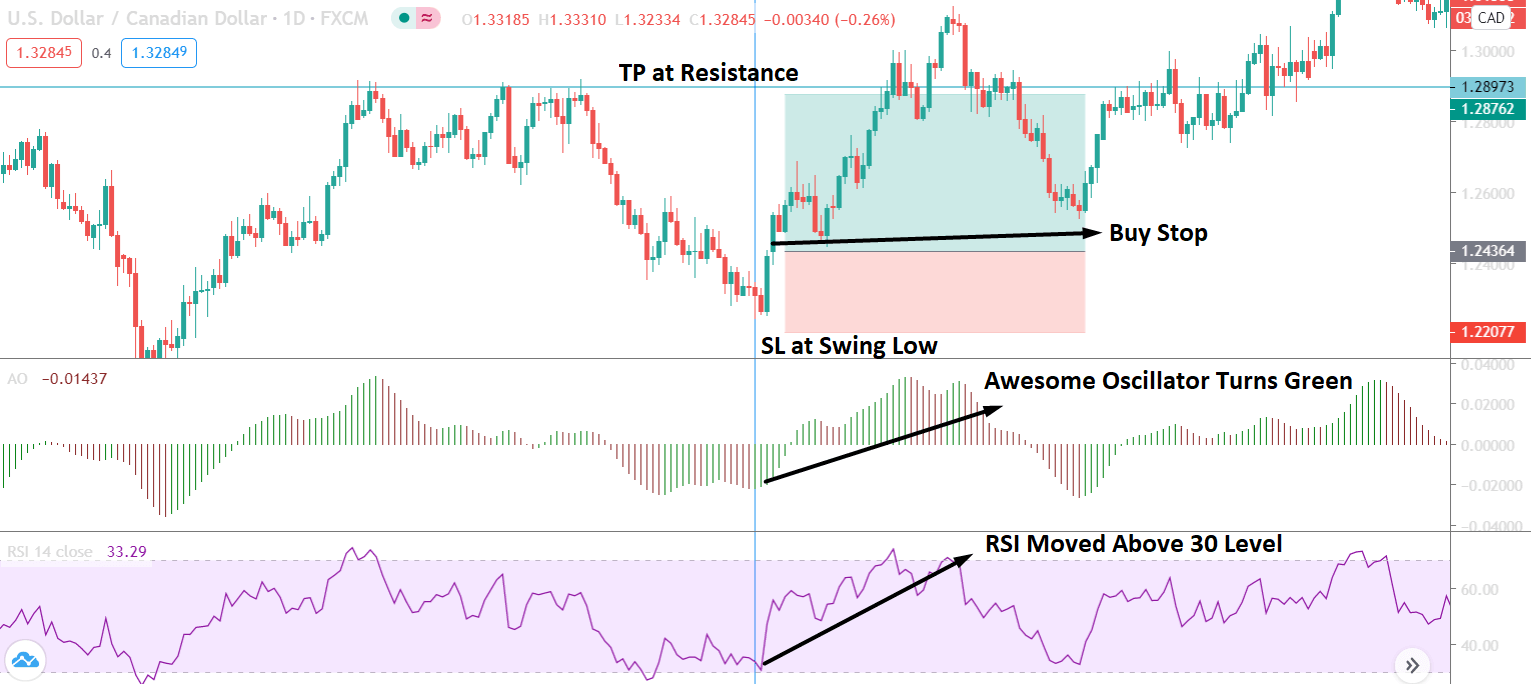
Now let’s move to the trading strategy. In the image below, we can see the visual representation of how to trade using the Awesome Oscillator RSI trading strategy. The rules for buying and selling of a currency pair are mentioned below:
Buy Trade Setup
- At first, the RSI should be below the 30 levels and point to an upward reversal.
- When the RSI moves above the 30 levels, we will consider buying signals only if the Awesome Oscillator shows a green bar.
- When the green bar appears, we can place a buy stop about 2- 5 pips above the current candlestick and allow the price to take our trade automatically.
- Sometimes RSI might signal 1-2 candlestick later than the Awesome Oscillator. In that case, we can consider trading entry by taking a smaller lot.
Sell Trade Setup
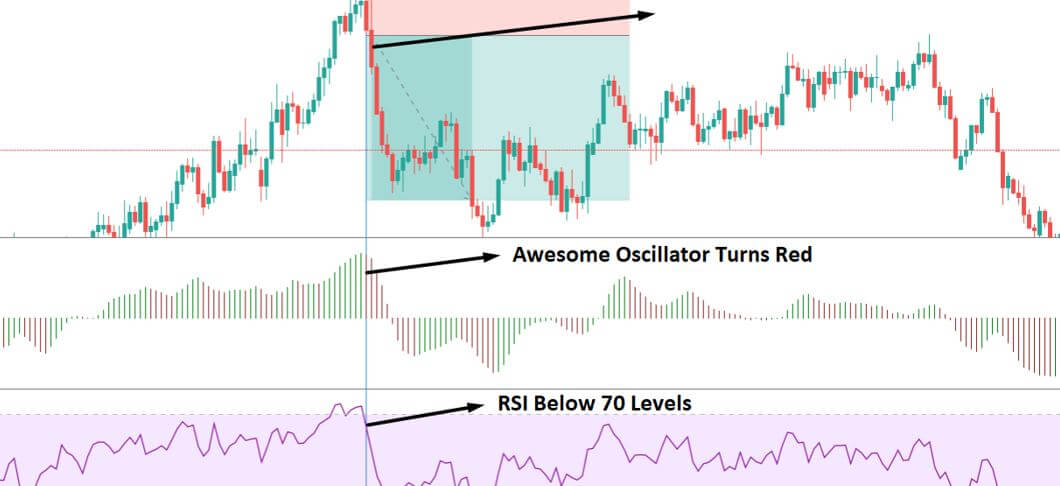
- At first, the RSI should be above the 70 levels and point to a downward reversal.
- When the RSI moves below the 70 levels, we will consider selling signals only if the Awesome Oscillator shows a red bar.
- When the red bar appears, we can place a sell stop about 2- 5 pips below the current candlestick and allow the price to take our trade automatically.
- Sometimes RSI might signal 1-2 candlestick later than the Awesome Oscillator. In that case, we can consider trading entry by taking a smaller lot.

In this strategy, we did not consider the histogram crossing zero lines. However, suppose you want to increase the probability of your trading. You can look at the zero line cross as a further trading condition that will indicate the overbought and oversold zone.
Stop Loss And Take Profit Idea
The stop loss and take profit idea is a vital element of any trading strategy. There are many ways to set take profit and stop-loss depending on the market swing low and Sewing high. In a buy trade setup, the stop loss should be below the recent swing low with 10 to 15 pips buffer. Similarly, in a sell trade, the stop loss should be above the recent swing high with 10 to 15 pips buffer.
Another idea of a stop-loss plan is to set it at 1.5X ATR. It will indicate the actual volatility of the currency pair that you are trading. Besides the stop-loss setting, take profits can be set with a multiple-level approach. You can hold your position until the Awesome Oscillator crossed above or below the zero lines. Later on, you can monitor the momentum of the price to identify the next take profit level.
Summary
Let’s summarise the awesome oscillator and RSI trading strategy:
- If the RSI is above the 70 levels and points downward movement, we will consider selling setups only, and if the RSI starts to move from the 30 levels, we will consider buying only.
- To enter the trade, we can take a pending order above or below the previous candle if other conditions meet.
- The stop loss should be below the swing low or swing high with some buffer or at 1.5 X ATR.
- For setting take profit, you can hold the trade until the Awesome Oscillator crosses above or below the zero lines. Moreover, if the market conditions allow you to extend the take profit.
In every trading strategy, trade management is an essential tool that a trader should not ignore. In the forex market, we anticipate the price based on our technical and fundamental analysis. As we trade on probabilities, there will be conditions where the market will hit our stop loss. Therefore, strong trade management is the only way to keep your balance steady growth.