Introduction
Previously, we discussed several trading strategies that involved a combination of different indicators, but the number did not exceed two or three. In today’s article, we present a trading system that is based on five different Exponential Moving Averages, combined with the Relative Strength Index (RSI). This strategy will make a lot of sense to traders who are at an intermediate level of trading. It is totally mechanical in nature and requires a thorough understanding of technical indicators of MT4 or MT5.
Time Frame
The strategy can almost be used on any time frame, but a larger one is preferred, 1 hour or higher. This means the strategy is not suitable for trading during the day.
Indicators
As said, we will use five different Exponential Moving Averages and one Relative Strength Index (RSI). This is the reason we need to be well versed in the technical indicators.
Currency Pairs
This strategy can be used with any currency pair. Also, with few commodities as well. Liquidity will not be an issue here since we are trading on the higher time frames.
Strategy Concept
Firstly, we use 80-period EMA to identify the major trend of the market. If the price is above 80 EMA, we say that the market is in a bull market, while if it is below the 80 EMA, the market is in a bear market. Secondly, we use the 21-period and 13-period EMA to point out the current trend direction, meaning, the current minor trend within the major trend. If the EMA with a shorter period is above the one with the longer period, we have a minor bull trend, and vice versa.
Third, we use the other two EMAs with even shorter ‘periods’ in conjunction with the Relative Strength Index (RSI) to generate entry signals. These are the 3-period EMA and 5-period EMA. The crossing of these two EMAs supported by the appropriate value of RSI, tells us whether to go long or short in the currency pair.
However, a more conservative approach would be by ignoring the entry signals, which are in the opposite direction of the major trend. Therefore a ‘long’ entry signal would be generated when the 3-period EMA penetrates the 5-period EMA from below and starts moving higher. Also, the 80-period EMA must be below the price action discussed above, and RSI must have a value exceeding 50. We execute the trade once the signal bar closes beyond the 5-period EMA.
Conversely, a ‘short’ entry will be taken when the 3-period EMA penetrates the 5-period EMA from above and continues lower. This must be coupled with an RSI value below 50, and 80-period EMA be above the price action.
Trade Setup
In order to explain the strategy, we have considered the 4-hour chart of USD/CAD, where we will be applying the rules of the strategy to execute a ‘long’ trade.
Step 1
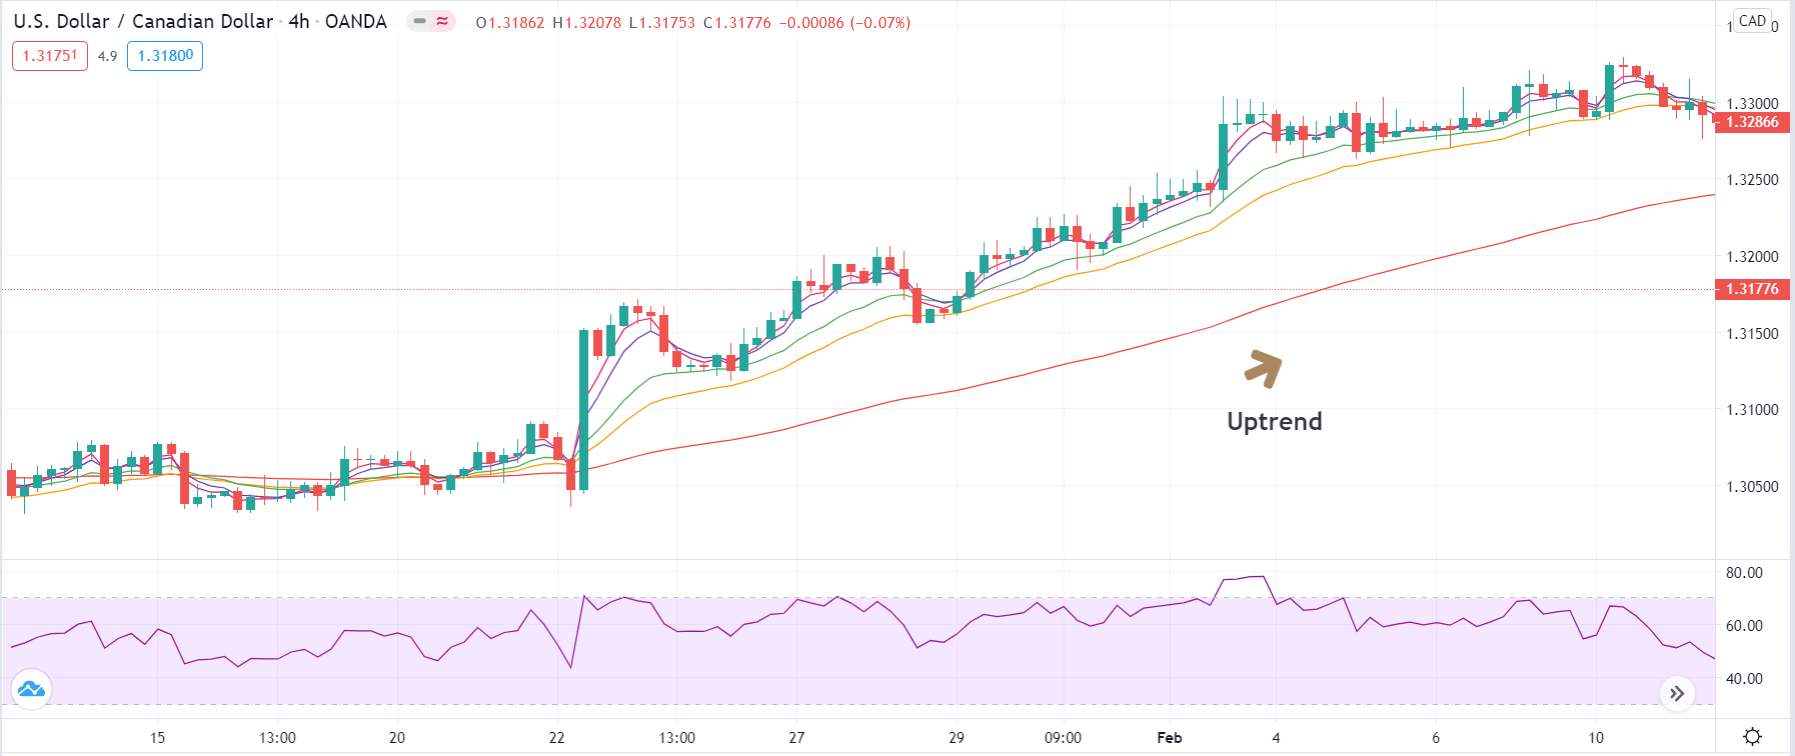
Since this a trend-based strategy, the first step is to identify the major direction of the market using the 80-period EMA. It is important that the price remains above the EMA for at least four consecutive higher highs and higher lows before we can call it an uptrend. Likewise, the price should be below the 80-period EMA for a minimum of 4 lower lows and lower highs.
The below image shows a clear uptrend visible on USD/CAD on the 4-hour chart.
Step 2
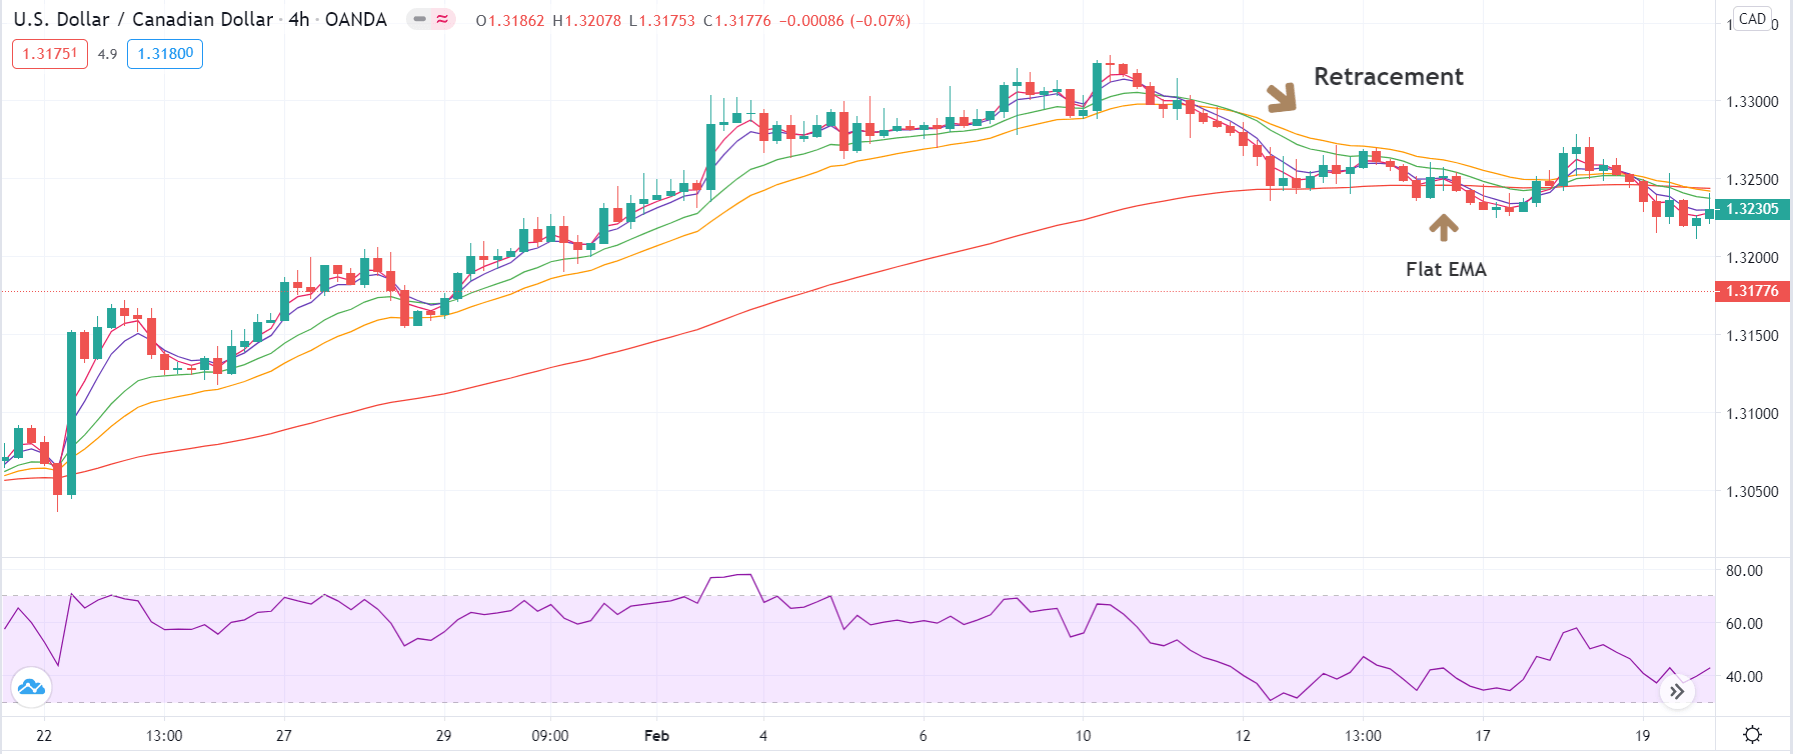
Once we have identified the trend, we need to wait for a price retracement that could give us an opportunity to enter the market and ride the trend. We need to evaluate if this a true retracement or the start of a reversal. In this step, we should wait until the price develops a ‘range’ or the 80-period EMA becomes flat. This partially confirms that the retracement is real, and the price could be making a new ‘high’ or ‘low.’
In the example we have taken, we can see how the price starts to move in a ‘range’ along with the flattening of the EMA. Next, let us discuss the ‘entry’ part of the strategy.
Step 3
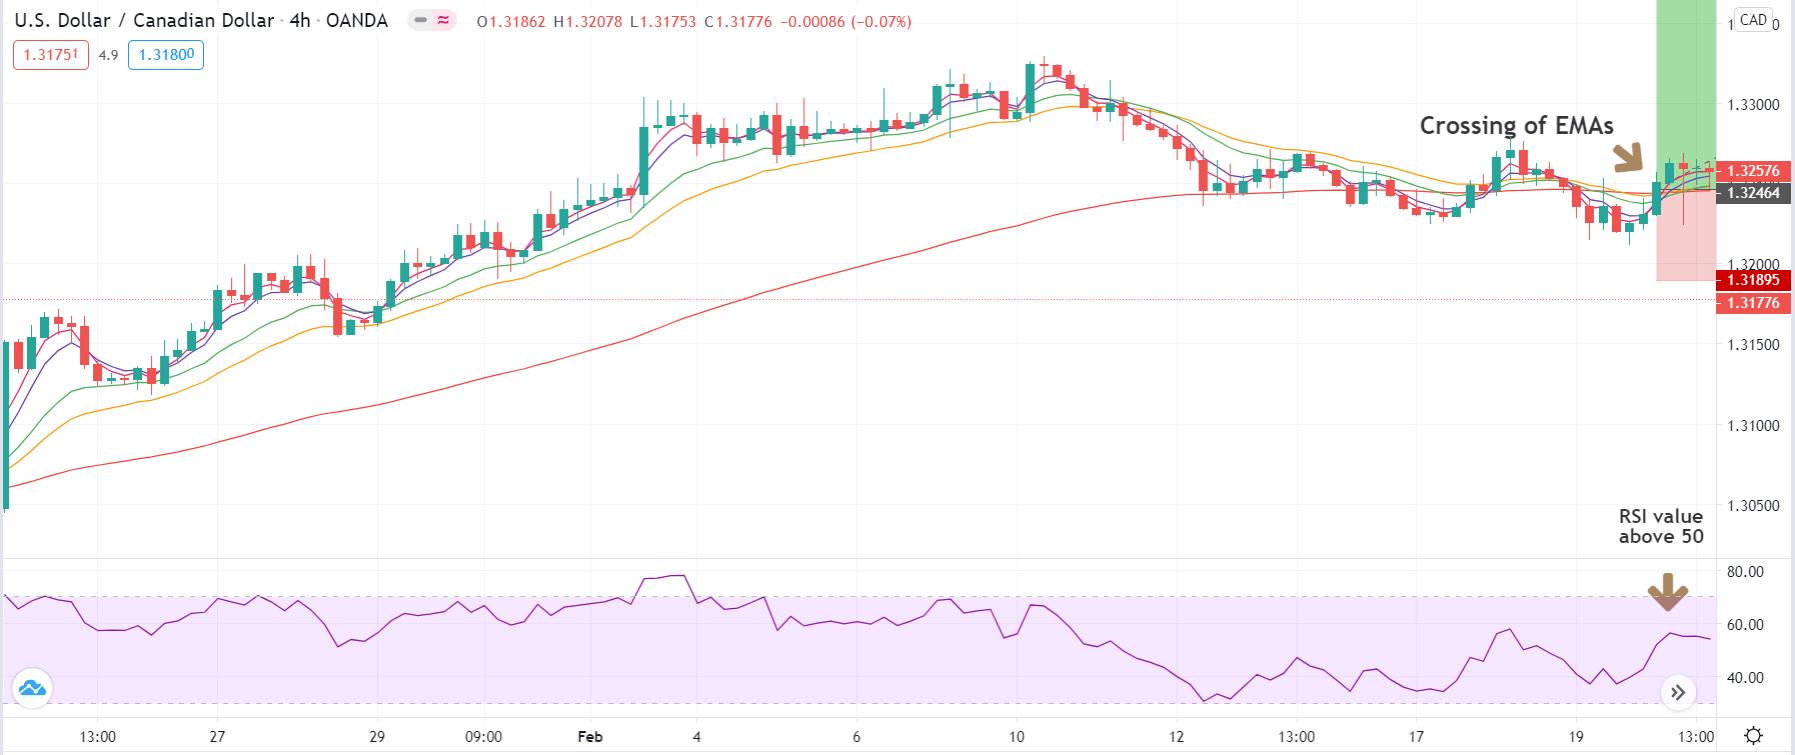
We shall enter the market for a ‘buy’ when all the smaller EMAs cross the 80-period from below. The 3-period EMA should penetrate the 5-period EMA and start moving forward to generate a reliable ‘buy’ signal. Along with this, at the entry bar, the RSI should be above the 50 levels, and both the 3 and 5 periods EMA should cross the 13-21 EMA channel. Once all of these conditions are fulfilled, we can take a risk-free entry into the market. The same rules apply while taking a ‘short’ trade but in reverse.
The below image clearly shows the ‘entry’ where all the conditions mentioned above are met.
Step 4
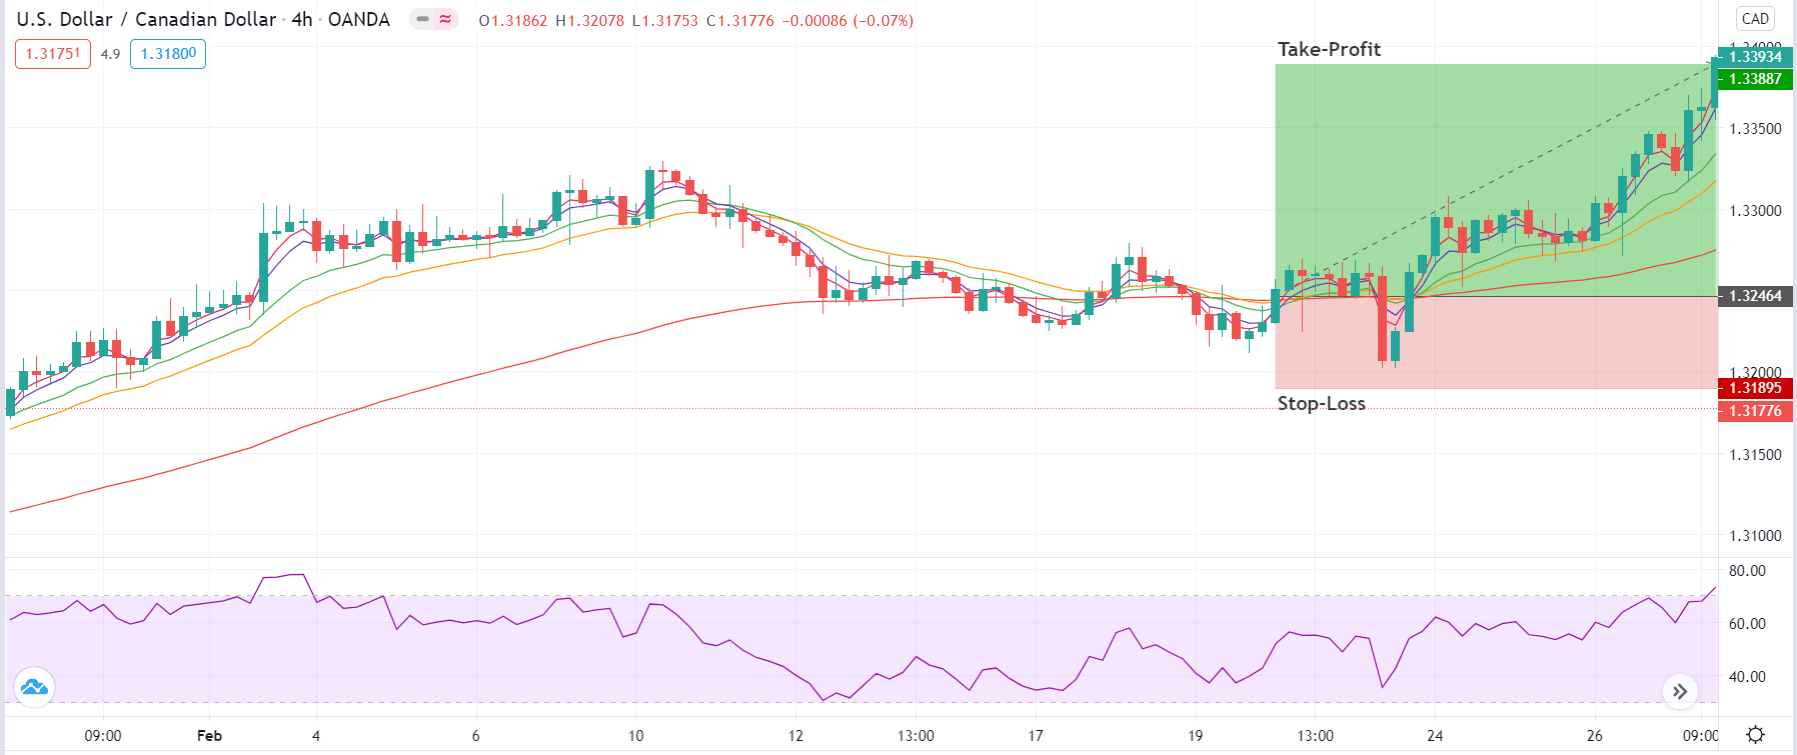
Once we have entered the trade, we need to determine the stop-loss and take-profit levels. For this strategy, the take-profit and stop-loss are placed in such a way that the resultant risk-to-reward of the trade is 2.5. The RR is derived mathematically, where we have taken into consideration the possibility of a new ‘high’ or ‘low’ as we are trading in a strong trending environment.
Accordingly, we have set the take-profit and stop-loss in our example, as shown below.
Strategy Roundup
Combining two or more technical indicators has always proven profitable for traders. The above-discussed strategy considers the trend of the market, momentum, strength of the retracement, and shift of ‘highs’ and ‘lows,’ which makes it an amazing strategy to be used while trading part-time or full-time. Since there are many rules and requirements for the strategy, the probability of occurrence of trade-setup is less, but once formed, it can provide amazing results.


