Categories
Forex Price Action

The Daily-H4 Combination Trading: Do Not Only Look for Reversal Candle

The daily–H4 combination traders are to wait for the daily chart to produce a reversal candle first to look for entry. Once the chart produces a daily reversal candle, traders are to flip over to the H4 chart; wait for consolidation and an H4 reversal candle to trigger an entry. We must not forget that if the daily chart is trending, the daily-H4 combination trading strategy may offer entry as well. In today’s lesson, we are going to demonstrate an example of that.

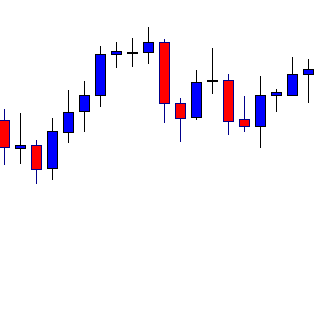
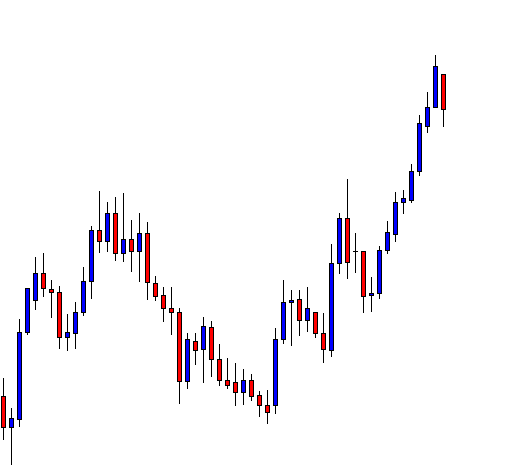
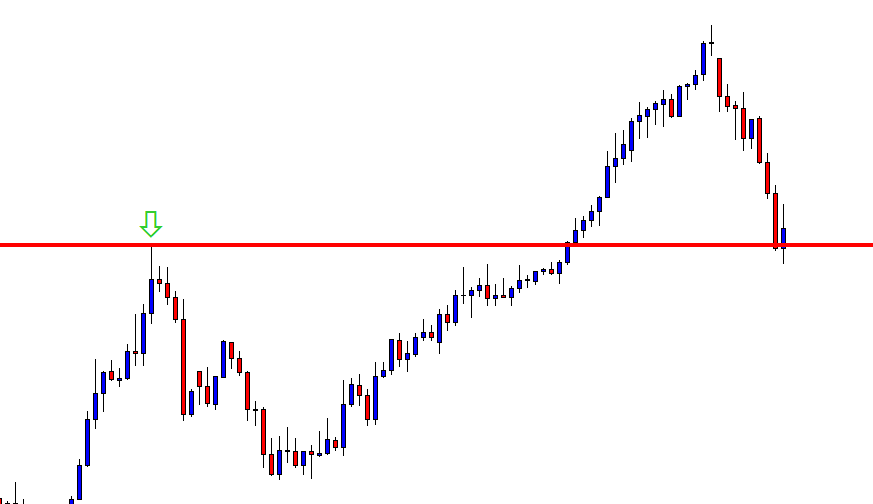
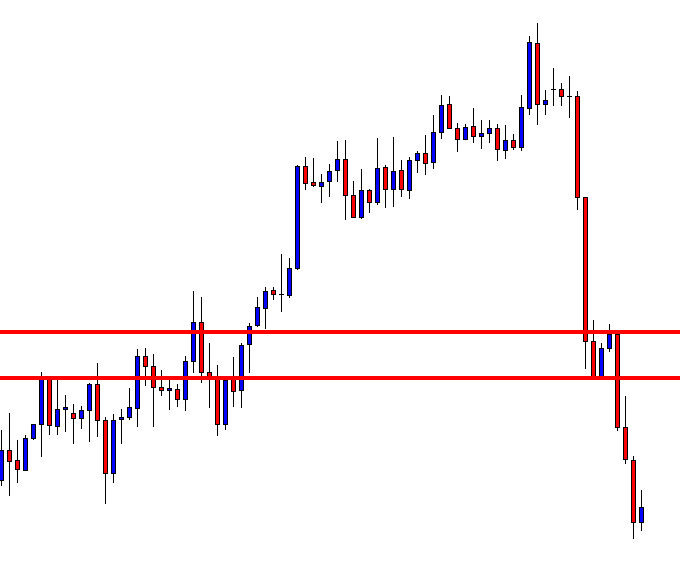
This is a daily chart. The pair produced a bullish engulfing candle and three more bullish candles followed. The daily-H4 combination traders are to keep their eyes on the pair right after it produces that bullish engulfing candle. Let us assume on the fourth day, we flip over to the H4 chart as well.

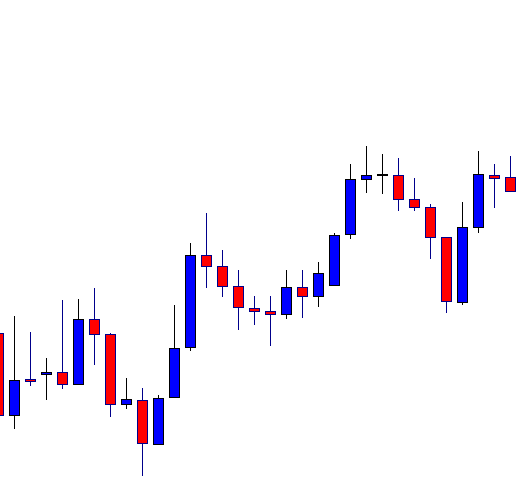
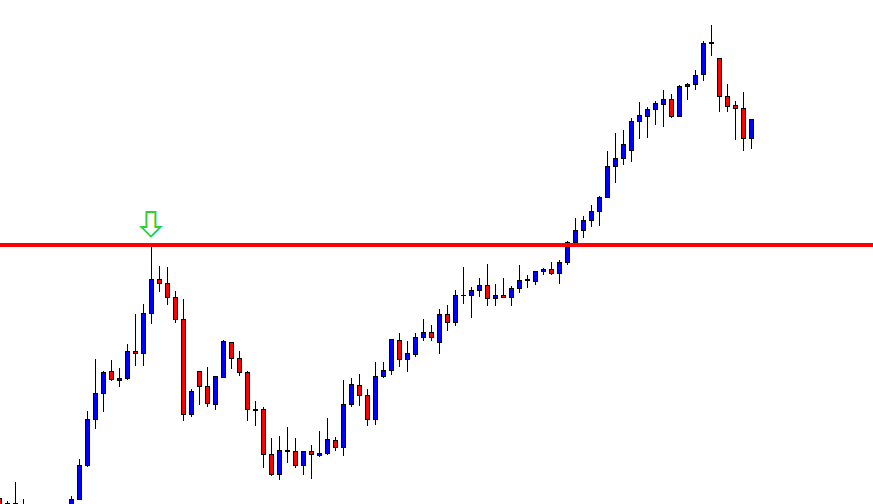
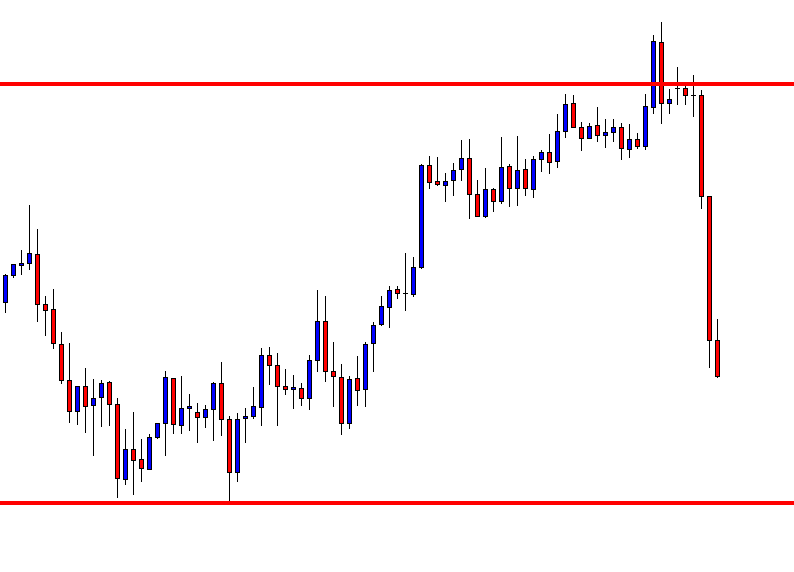
This is how that H4 chart looks. The chart shows that after making a bullish move, the price starts having consolidation. The last candle comes out as a bearish pin bar. It seems the chart may take time to produce a bullish reversal candle to offer a long entry. Then again, we never know. It may be just around the corner.

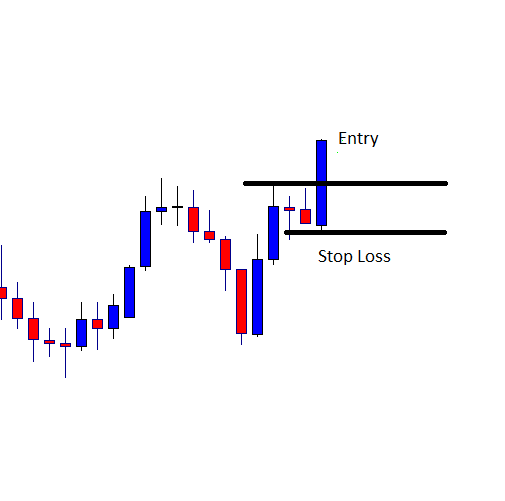
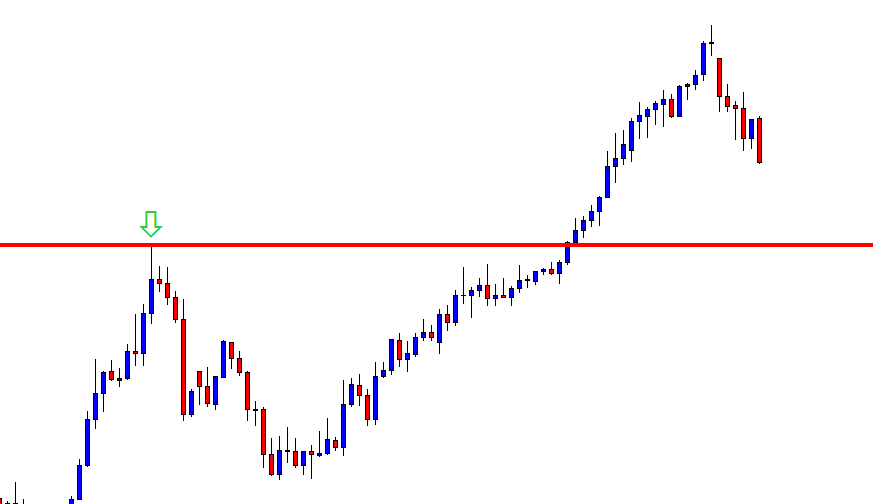
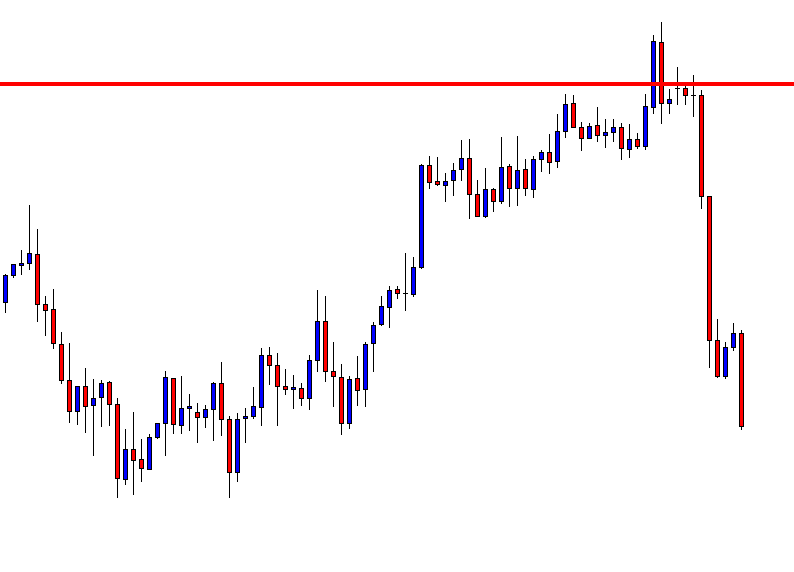
The char produces a good-looking bullish engulfing candle closing well above consolidation resistance. The buyers may trigger a long entry right after the last candle closes by setting stop loss below consolidation support and by setting take profit with 1R. Let us move to the next chart to see how the trade goes.

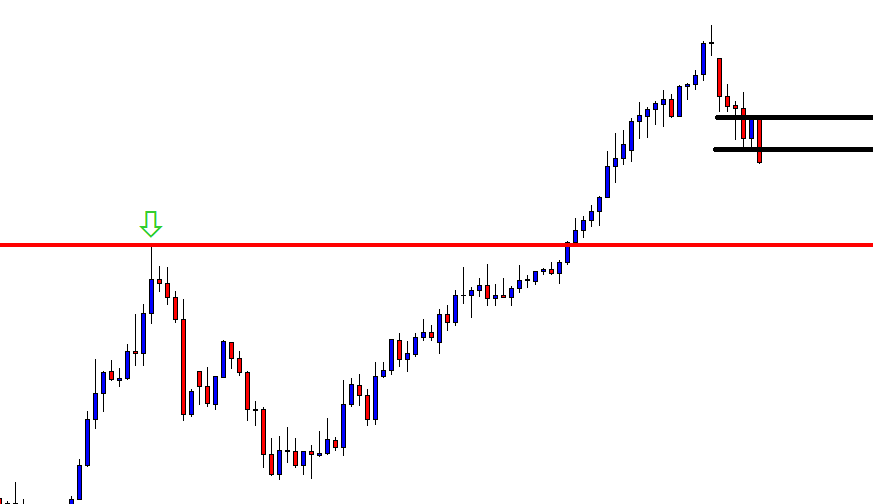
The price consolidates again. After producing such a good-looking signal candle, it seems a bit unusual. The last candle has a bearish body but it has a long lower shadow. Be patient and see what the price does next.

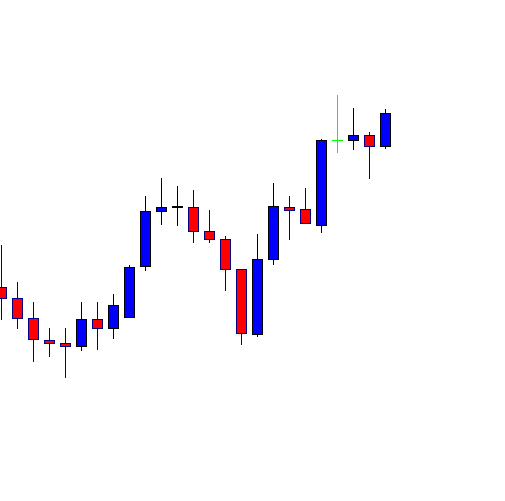
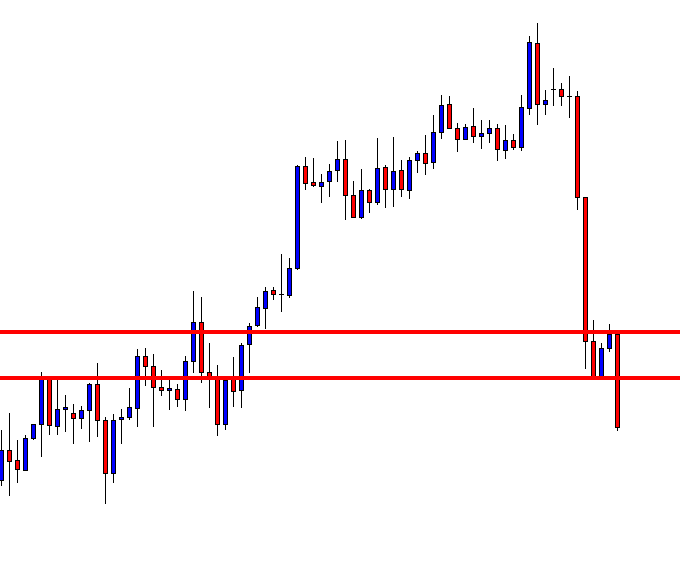
Look at the last candle. It comes out as a bullish engulfing candle. This is a strong sign that the price may head towards the North now. As far as the last candle is concerned, the price may not take too long to hit the target.

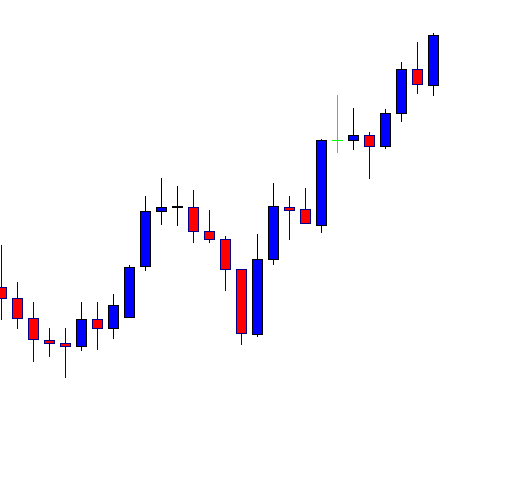
As expected, the price heads towards the North with good bullish momentum. It produces only one bearish candle before hits the target. As it seems, a bearish inside bar followed by a bullish engulfing candle may push the price towards the North further. Anyway, the buyers have achieved their 1R here with ease.

The message we get from today’s lesson is that if the daily chart is trending, we may keep an eye on the H4 chart to take entries with the trend as well. If it produces a reversal candle, we may look for entries too. However, we must not look for short entries if the last daily candle is bullish and vice versa.

Categories
Forex Daily Topic Forex Price-Action Strategies

Significant Levels Must be Counted

Price action traders are to take entry and exit by determining support and resistance on the naked chart. Significant highs and lows are considered to draw support and resistance, which help traders find out stop loss, take profit as well as risk-reward. In today’s article, we are going to demonstrate an example of a level holding the price as support, where the price had a rejection earlier. Let us find out how we are to deal with such levels.

This is the daily chart. The price heads towards the North with good bullish momentum. Look at the last candle. It is a strong bearish candle with a long solid bearish body. The daily-H4 chart combination traders may want to flip over to the H4 chart to find short entries.

This is how the H4 chart looks. The price has been bearish. The last candle comes out as an inside bar. If the price consolidates and produces a bearish candle breaching the lowest low, the sellers may go short on the pair. The question is, where do they set their take profit level? Look at the red line, which is drawn right at the point where the price had a rejection earlier. The level of support is further down, but the red-lined level is a significant level, which the sellers must consider before making any selling decision on this chart.

The price produces a bearish engulfing candle breaching the lowest low. It means that the price has found its resistance. The sellers may draw two lines here to identify their stop loss and entry point.

This is how it looks with two drawn lines. The live above is the stop loss level. The price breaches the line and closes below it. Thus, the sellers may trigger a short entry right after the candle closes. Let us proceed to the next chart to find out how the trade goes.

The price heads towards the South with good bearish momentum. Look at the last candle, which comes out as an inside bar. It produces right at the flipped support. This is where the price had a strong rejection earlier. The sellers shall set the take profit right here. Some traders may take out partial profit and use trailing stop loss by making sure that they do not lose even a single penny. Both have pros and cons. However, the matter of fact is they must count such level before making any trading decision. It helps them determine the take profit level, risk-reward, and trade with more winning chances.

Categories
Forex Price-Action Strategies

Choppy Daily Chart, H4 Chart Still Offering an Entry

In today’s price-action lesson, I am going to divulge an example of the daily-H4 chart combination offering an entry. Usually, it is best to trade on the daily-H4 chart combination when the price is having a solid trend on the daily chart. However, not all the time the price is going to have a strong trend on the daily chart. The price action may be trapped within zones and still offer an entry.

The daily chart shows that the price has been roaming around within two levels. The last candle comes out as a bearish engulfing candle. The candle forms at the resistance zone. The level of support is not too far away. Let us have a look at the same chart with those two levels.

The chart shows that the price may find its next support at the red marked line. The price had a bounce at the level earlier. As far as the daily chart is concerned, the price does not have enough space to travel towards the South. However, the daily-H4 chart combination traders may have another equation to play with. Let us flip over to the H4 chart and find that out.

The H4 chart shows that the price heads towards the South with extreme bearish pressure. Traders are to wait for consolidation and bearish breakout to go short on the pair. The selling pressure is too high to consolidate though. Then again, the sellers must not give up. Let us find out what happens next.

The price starts having the correction. It may find its resistance nearby and offer a short entry upon a bearish breakout. On the other hand, if the price goes too far towards the North, the risk-reward factor may hold the sellers back to go short.

The price goes towards the North for one more candle and produces an H4 bearish engulfing candle closing below the level of consolidation support. The last candle looks to be a fantastic signal candle and the price still has some room to travel towards the South. Let us have a look at the same chart with consolidation support and resistance.

The equation gets much simpler with those two lines. A short entry may be triggered right after the last candle closes by setting Stop Loss above consolidation resistance. Take Profit may be set at the last swing low or wait until a bullish reversal candle on the H4 chart. Let us find out what the price does after triggering the entry.

The price heads towards the downside with good bearish pressure. The last H4 candle comes out as a bullish Inside Bar. The sellers may want to close the entry here.

We have seen that as long as the daily chart’s support/resistance offers a lucrative risk-reward for the H4 traders, they may be able to find entry occasionally even though the price is not having a strong trend on the daily chart.