Categories
Forex Basics

Some Spikes are Not to Be Ignored

Forex traders often struggle with spikes on their trading charts. The Line chart does not show spikes, but Candlestick Chart does. Price action traders usually use candlestick charts as one of their weapons to trade effectively. Thus, they face this problem every now and then. There is no sure method confirming which spikes are to be ignored, and which are not to be ignored. We have to be sensible about that. In today’s lesson, we find out a kind of spikes that are not to be ignored. Let us get started.

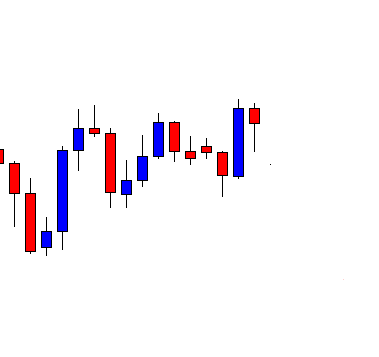
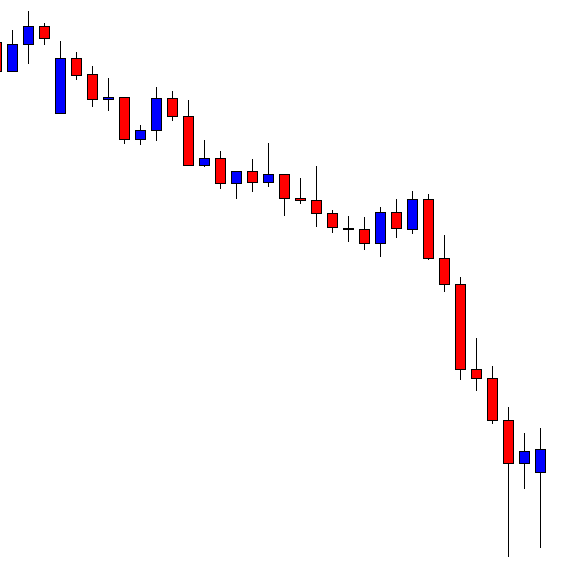
The price heads towards the South with good bearish momentum. It finds its support and produces a bullish reversal candle. The last candle comes out as a bullish candle as well. The sellers are to wait for a bearish reversal candle to go short in this chart.

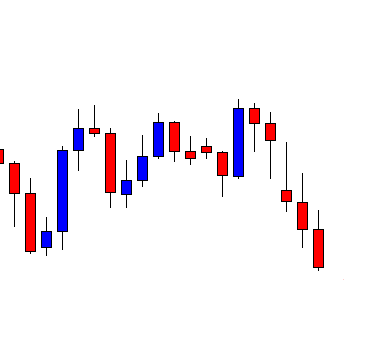
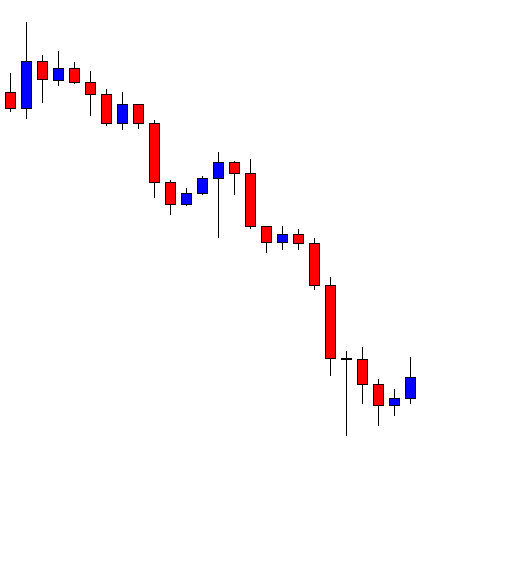
Here comes the bearish reversal candle that the sellers wait in such price action. We have not drawn any resistance line. If we closely observe, we find that the last two candles’ bodies suggest a line of resistance. Candles’ bodies play a significant role in determining the support/resistance line. Let us draw a line of resistance here.

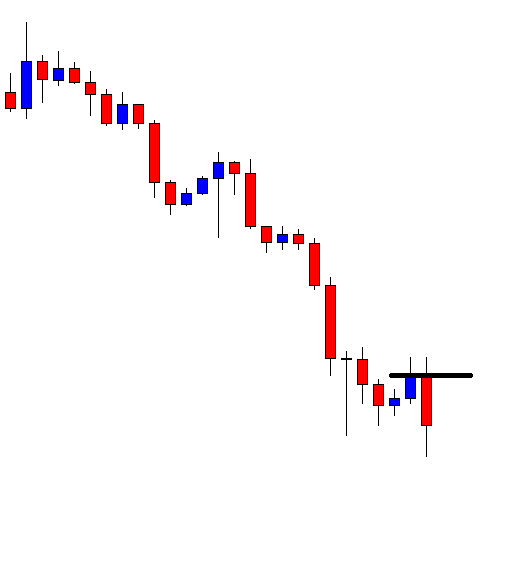
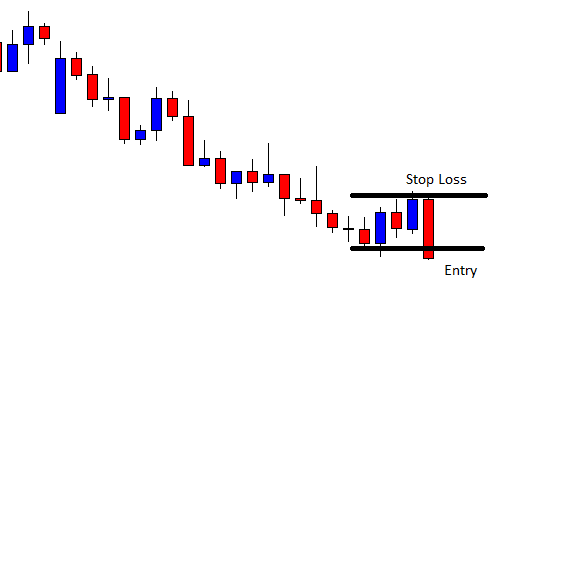
Here it is. The combination of the last two candles and their bodies suggests that we may draw a line right above their bodies. In most cases, we are to do this. However, the last two spikes have something more to think about. If we closely look, we find that the last two spikes are lined up. They have had their rejection at the same level. This means that the line is significant, which must not be ignored. Thus, if we want to take entry here, we may count the line above as the level of resistance. Let us have a look at the chart below with more drawn lines.

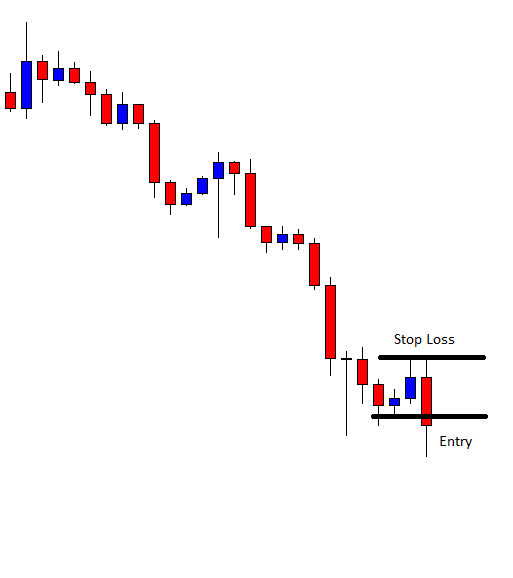
Look at the Stop Loss level. To be safe, we may not ignore such levels, where the price gets rejected multiple times. The candles may end up having spikes, but these spikes shall be counted to determine our stop loss, take profit, and breakout level. Let us not proceed to find out how the entry goes.

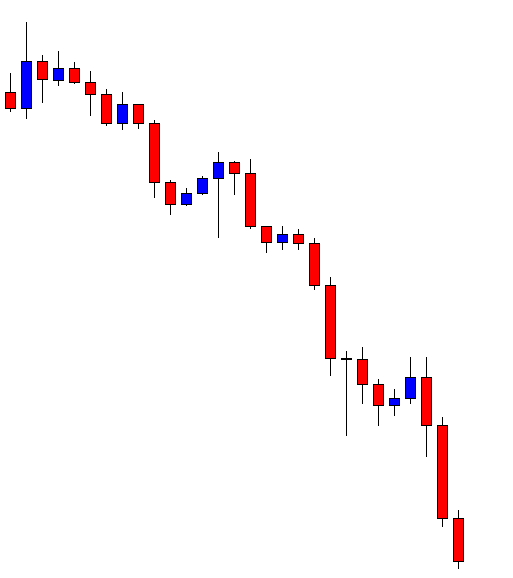
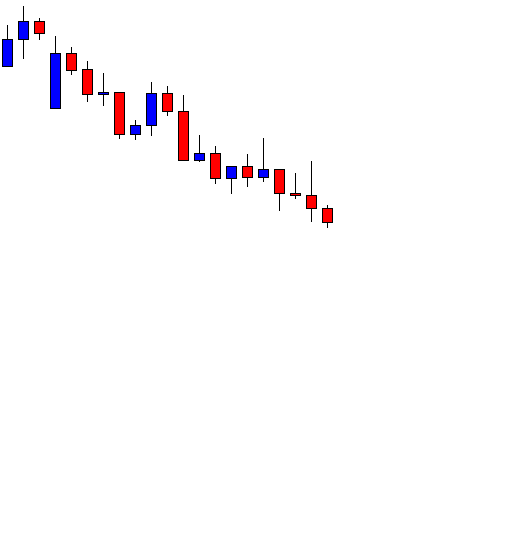
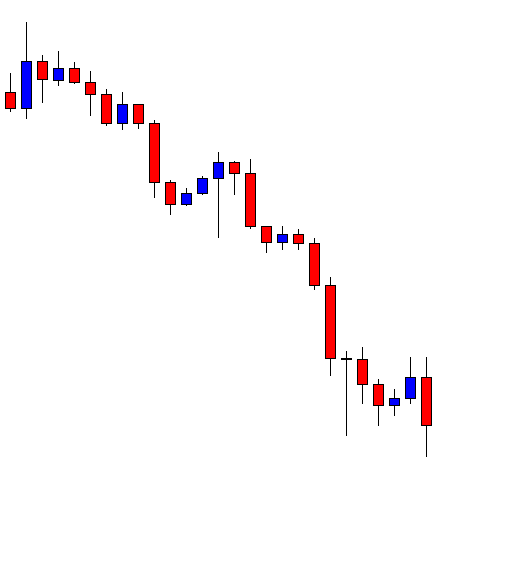
The trade setup works well for the traders. The price heads towards the South with more bearish pressure. It gets 1R to the sellers in a hurry. Now many of us may say the price never goes back to the level. In 80% of cases, the price does not go back near to the resistance. In the rest of the 20% cases, it may go. That is when we are to take an unnecessary loss. As they say, it is better to be safe than sorry. Let us be safe with spikes like these.

Categories
Forex Daily Topic Forex Price-Action Strategies

Forex Traders: Get Patience, Optimism, and Never Give Up Attitude

In today’s lesson, we are going to demonstrate an example of the daily-H4 combination trading, which makes traders wait for a long time. Usually, if the daily chart produces a daily reversal, it creates an H4 entry within a day or two. In today’s lesson, the H4 chart takes four days after creating a daily reversal to produce the signal candle. Let us find out how it offers us entry.

This is a daily chart. The chart shows that it produces a bearish inside bar at a strong resistance zone. An inside bar is not a strong reversal candle, but a strong resistance zone may attract the sellers to look for short opportunities. The daily-H4 combination traders are to flip over to the H4 chart for the price to consolidate and produce a bearish reversal candle to offer a short entry. We flip over to the H4 chart later. Let us now have a look at the daily chart with four more daily candles.

The chart produces four more candles that are bearish. However, the daily-H4 combination traders do not get any A+ entry to go short. Should they skip eyeing on this pair? Never, they need to perform the same duty. As long as the last daily candle is bearish, they are to flip over to the H4 chart. The last candle on this chart is bearish. Let us flip over to the H4 chart this time.

You may notice that the H4 chart does not make deep consolidation followed by a bearish engulfing candle to offer them a short entry so far. Traders are to flip over to the H4 chart every day with no luck. Let us proceed to the next H4 chart.

The chart shows that it is having a deep consolidation. The last candle comes out as a bullish engulfing candle. However, the chart is still bearish biased unless it produces a bullish daily reversal candle. The sellers are to wait for an H4 bearish engulfing candle closing below consolidation support to offer them a short entry.

Here it is. The last candle comes out as a bearish engulfing candle closing well below consolidation support. The sellers may trigger a short entry right after the last candle closes with 1R.

The price heads towards the South with extreme bearish pressure. The price hits 1R with ease. Some traders may even make much more than 1R by taking a partial profit. In the end, it ends up being a prolific entry.

It does not come easily, though. The daily-H4 combination traders are to keep eying on the charts for four consecutive days. The H4 chart produces the signal on the fifth day after producing the daily bearish reversal candle. This is why Forex traders need to have patience, optimism, and never give up attitude.

Categories
Crypto Guides

What Problems Do Stable (cryptocurrency) Coins Solve?

Introduction

We have learnt a lot about cryptocurrencies and their properties in our previous guides. Even though this financial instrument has gone through a lot of up & down in the last three years of the past decade, many financial experts believe that this asset class can still be considered a potential investment. Some experienced crypto traders believe that Bitcoin, at its peak (~$18,000 in Dec 2017), is still undervalued. This is because of the strong fundaments Bitcoin possesses. Not just Bitcoin, the entire crypto market has enormous investment potential in this decade.

The Need for Stable Coins

But there is one thing that concerns both short-term and long-term crypto investors – which is undoubtfully the volatility. Most of the cryptos currently present in the market possess huge volatility. This is one crucial reason why most of the investors are not confident enough to invest in this space. This volatility is also the reason why cryptos cannot be used as a standard medium of exchange. Hence the need for a Stable Currency or Stable Coin has risen.

A Stable Coin is a currency that has all the critical properties of typical crypto while achieving price stability. This stability in price is achieved by pegging their value to the major fiat currencies like USD & Euro in a 1:1 ratio. One of the very first and famous stable coins is Tether, and its value is pegged to USD. So the value of one Tether (₮) is always equal to one US Dollar ($). The main goal of any stable coin is to achieve maximum decentralization while maintaining price stability. But in the case of Tether, even though it has most of the properties of crypto, it is highly scrutinized ever since it is pegged with the USD.

Significance of Stable Currency

Stable Currency, as the name suggests, provides both short-term & long-term stability for the traders and investors. Short-term stability allows users to make day to day transactions just like fiat currencies. While the long-term stability provides confidence for the investors to include these stable coins in their portfolio. For instance, in the case of extreme bear markets, crypto traders and investors must need some stable storage where they can protect their portfolio from significant losses. The only other way is to convert all these cryptos to desired fiat currencies and convert back to crypto again once the downtrend is over. This sounds redundant. Isn’t it?

But with the help of stable coins in their portfolio, investors can just trade the cryptos that are bleeding for stable coins and hold them without having to worry about the volatility. Apart from the investment point of view, stable coins can also help short-term crypto traders to confidently keep their profits that they have gained within the exchange wallets (in the form of stable coins). But in the absence of stable coins, they will have to continuously worry about them losing their profit value due to the high volatility.

If you are interested in adding stable coins to your portfolio, we have mentioned some of the most promising ones below.

TetherMakerDAOTrue USDCarbon

Many stable currency projects like these have come to existence after Tether, and some of them showed promising results. However, a completely decentralized stable coin that can be used for day-to-day transactions securely is yet to come.

Categories
Forex Harmonic

The 5-0 Harmonic Pattern

Harmonic Pattern Example: Bearish 5-0 Harmonic Pattern

The 5-0 Harmonic Pattern

Like the Shark Pattern, the 5-0 pattern is a relatively new pattern discovered by the great Scott Carney. Carney revealed this pattern in his second book in his harmonic series, Harmonic Trading: Volume Two.

The 5-0 pattern is easily one of the wonkiest looking patterns. Depending on where you are at with your knowledge of harmonic patterns, the 5-0 will look foreign. And this is primarily because the 5-0 Pattern starts a 0. If you are used to seeing XABCD,  then 0XABCD will undoubtedly look odd.

5-0 Elements

  1. The pattern begins (begins with 0) at the beginning of an extended price move (direct quote from Carney’s work).
  2. After 0 has been established, an impulse reversal at X, A, and B must possess a 113 – 161.8% extension.
  3. The projection off of AB has a 161.8% extension requirement to C. C can move beyond the 161.8% extension but not beyond 224%.
  4. D is the 50% retracement of BC and is equal to AB (a Reciprocal AB=CD Pattern).
  5. The reciprocal AB=CD is required.

One of the best ways to interpret this pattern is to view it from an exasperated trader’s point of view. If we take the Bullish 5-0 Pattern as an example, then we can see why. The AB leg ends with B below X, creating a lower low. We then get an extended move in time where the BC leg is the most prolonged move with C ending above A. The movement from B to C may take on the appearance of a bear flag or bearish pennant. C to D shows intense shorting pressure and a belief among bears that new lows are going to be found. Instead, we get to D – the 50% retracement of BC. Instead of new lower lows, we get a confirmation swing creating a higher low. That move will more than likely generate a brand new trend reversal or significant corrective move.


Sources: Carney, S. M. (2010). Harmonic trading. Upper Saddle River, NJ: Financial Times/Prentice Hall.  Gilmore, B. T. (2000). Geometry of markets. Greenville, SC: Traders Press.  Pesavento, L., & Jouflas, L. (2008). Trade what you see: how to profit from pattern recognition. Hoboken: Wiley.

Categories
Forex Daily Topic Forex Psychology

Two Mistakes Novice Traders Should Avoid

On this article we are going to discuss two mistakes novice traders should avoid to succeed in the financial markets. Reading a book about trading or a strategy article on a website makes trading the markets seem easy, But that is far away from the truth.

Judgmental errors

“We typically trade our beliefs about the market, and once we’ve made up our minds about those beliefs, we’re not likely to change them” – Van K. Tharp


Joe Novice comes to the markets, after reading a marvelous book explaining to him how to win easy money in the markets. The book has beautiful charts describing how. Joe has learned a lot from this book. Now he knows what bull and bear candlesticks are. He has learned to distinguish patterns. Head and shoulders, double tops and bottoms, the Morning Star and its counterpart the evening star. He also learned some handy indicators such as the Stochastics, the RSI, and the MACD. Finally, he has also get acquainted with the concepts of support, resistance, and breakout. He thought that was key to succeed

Prices Move faster in real-time than on a book illustration.

Joe founded his account with his first $1,000 to experience the exciting world of big wins. Then he downloaded his MT4 station to begin operating. He created the setup recommended in the book and started looking for major pairs and decided that for his scalping purposes, he should use 1-minute charts.

The first thing that surprises Joe is that prices are continually moving. He was switching from pair to pair on his laptop, but nothing happened until he left the chart and moved to another one. The price action seems to occur only when he wasn’t looking! That made him think that he must concentrate on just a couple of charts at a time.

Also, Joe had a hard time making decisions. For some reason, the strategy explained in the book only was evident after the fact. The right moment to trigger the trade seemed never to show. He was late to pull the trigger most of the time, and when not late, the moment to pull it did not appear right.

Representation Bias

How can a trader make money using patterns and levels everybody sees?

The fact is that all technical analysts are able to spot support and resistance levels. So why people make money trading breakouts? Or don’t they?

People believe in charts as if they were truths. They believe that charts represent the activity of the markets. In fact, bars or candlesticks are just approximations to that activity. The issue is that what we see is the representation of past action, but we do not see the reasons why the price arrived at that place.

What if most traders really didn’t have the right information to make decisions. What if only a handful of privileged traders owned that knowledge? Let’s suppose that these smart guys have the privilege to see where is the real supply zone. The zone where they’d do the worst harm to the herd of dumb traders. Wouldn’t it be logical that they tried to stretch the price to that zone to collect the best available prices, then turn back and move the price to the opposite side?

Under that assumption, the next day or week, another technical analyst would see the price extension and figure out where the stop-loss should be. It will reason the optimal place to be just below that zone. However, the fact is that there is an action-reaction phenomenon in the markets. The actions of the market participants change history. The market is an experiment, on which the scientist influences the result with his acts. If he were to trade the previous day, he might have decided the same way as did those who were that day in the market, and, so, would be wiped as the others.

So, how should we proceed?

The strategy should have clear rules of entry, stop-loss, and profit-taking

Traders should back-test the strategy and optimize some parameters. Then they should forward test it in a demo account or using one micro-lot.

After a list of 30 trades, the trader should have a minimum of data samples to approximate percent winners and reward to risk ratio: The two most critical parameters of any strategy. We do not talk about drawdown here, because drawdown is a dependent variable: it can be computed knowing the percent losers and changes with position size.

When deciding about stop-loss placement, Do not use pivot levels. These are already known to the sharks of the market, and will inevitably fail.  The best stop-loss placement is using the Maximum Adverse Excursion technique, a concept by John Sweeney.

Of course, to be able to use MAE, you should record your trades accurately, recording also the MAE information.