
In today’s price-action lesson, I am going to divulge an example of the daily-H4 chart combination offering an entry. Usually, it is best to trade on the daily-H4 chart combination when the price is having a solid trend on the daily chart. However, not all the time the price is going to have a strong trend on the daily chart. The price action may be trapped within zones and still offer an entry.


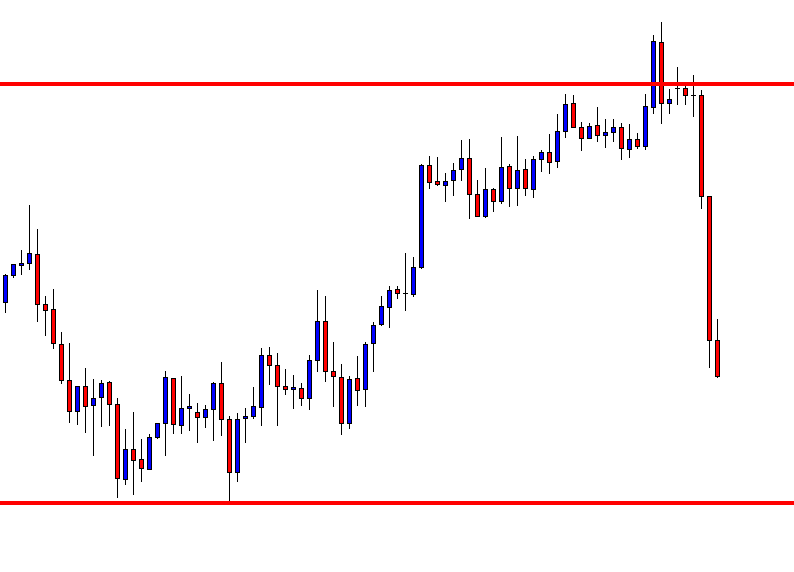
The daily chart shows that the price has been roaming around within two levels. The last candle comes out as a bearish engulfing candle. The candle forms at the resistance zone. The level of support is not too far away. Let us have a look at the same chart with those two levels.

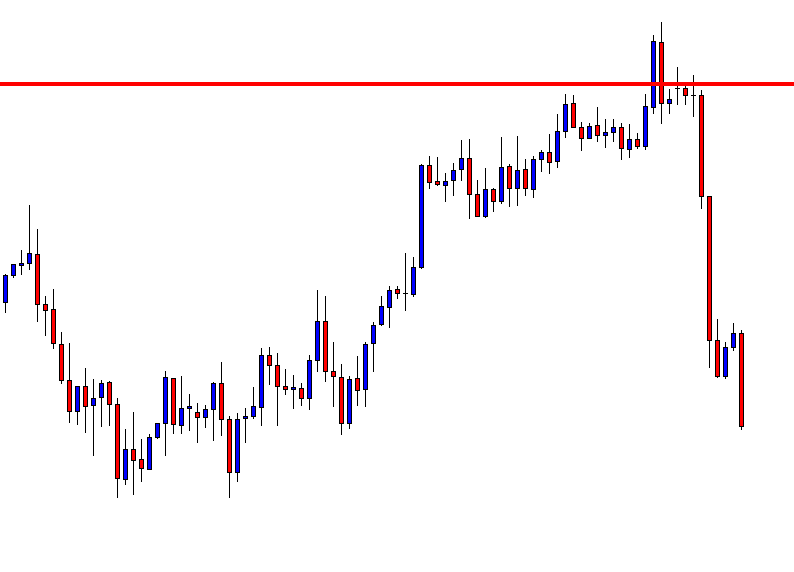
The chart shows that the price may find its next support at the red marked line. The price had a bounce at the level earlier. As far as the daily chart is concerned, the price does not have enough space to travel towards the South. However, the daily-H4 chart combination traders may have another equation to play with. Let us flip over to the H4 chart and find that out.
The H4 chart shows that the price heads towards the South with extreme bearish pressure. Traders are to wait for consolidation and bearish breakout to go short on the pair. The selling pressure is too high to consolidate though. Then again, the sellers must not give up. Let us find out what happens next.

The price starts having the correction. It may find its resistance nearby and offer a short entry upon a bearish breakout. On the other hand, if the price goes too far towards the North, the risk-reward factor may hold the sellers back to go short.
The price goes towards the North for one more candle and produces an H4 bearish engulfing candle closing below the level of consolidation support. The last candle looks to be a fantastic signal candle and the price still has some room to travel towards the South. Let us have a look at the same chart with consolidation support and resistance.
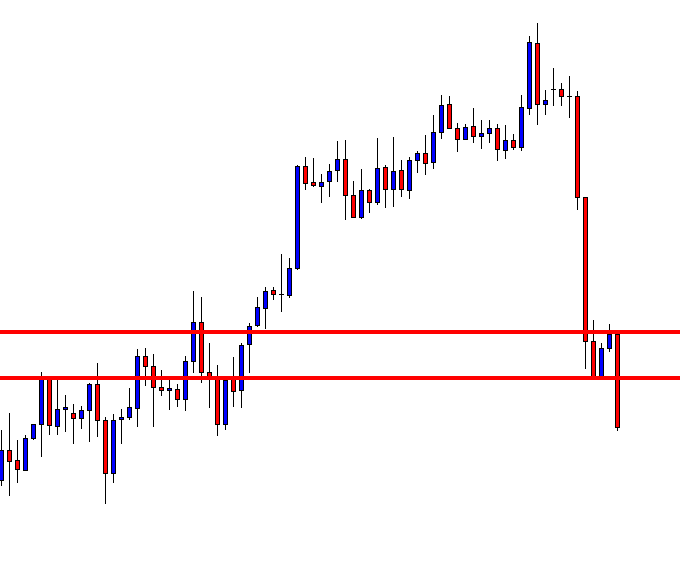
The equation gets much simpler with those two lines. A short entry may be triggered right after the last candle closes by setting Stop Loss above consolidation resistance. Take Profit may be set at the last swing low or wait until a bullish reversal candle on the H4 chart. Let us find out what the price does after triggering the entry.
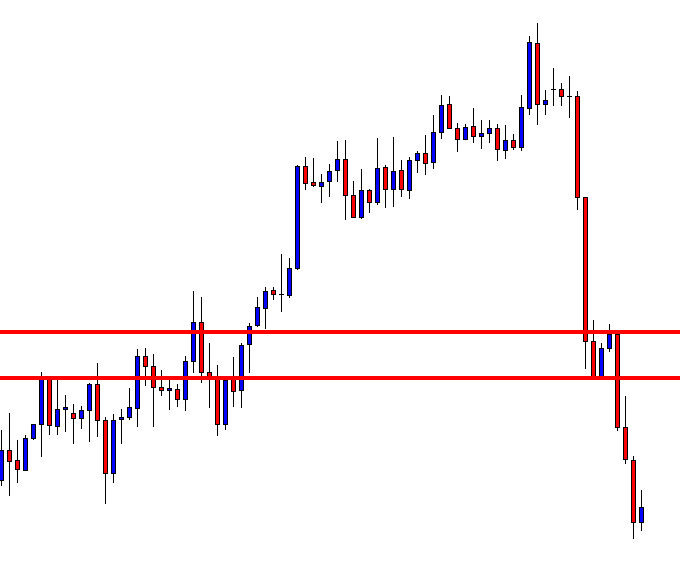
The price heads towards the downside with good bearish pressure. The last H4 candle comes out as a bullish Inside Bar. The sellers may want to close the entry here.
We have seen that as long as the daily chart’s support/resistance offers a lucrative risk-reward for the H4 traders, they may be able to find entry occasionally even though the price is not having a strong trend on the daily chart.