
We have been learning the daily-H4 chart combination trading, where we flip over to the H4 chart once we get a daily reversal candle. In today’s lesson, we are going to demonstrate the strategy, which offers entry in a different way. This strategy is quite handy. We find out the reason in a minute.

This is a daily chart. The chart produces a bullish engulfing candle, with its the swing high far enough. This allows that daily-H4 chart combination traders enough space to hunt for pips. This is time for the traders to flip over to the H4 chart.
The H4 chart shows that the price heads towards the North with good bullish momentum. The last candle comes out as a bullish candle. However, it closes within the last H4 candle’s resistance. Traders are to wait for consolidation and bullish H4 reversal candle to go long on the pair.

The price consolidates and produces a bullish reversal candle. However, the price does not breach the consolidation resistance yet. Moreover, you may have noticed that there have been six H4 candles. It means the whole trading is passed, but the price does not make any breakout. Please note that if the H4 chart does not produce a reversal candle followed by a breakout at the highest high or lowest low within the next day, the daily-H4 chart trade setup is not valid anymore. This means we have wasted our time. It is a part of trading. We must take it professionally. However, we may have good news here. Let us flip over to the daily chart again.
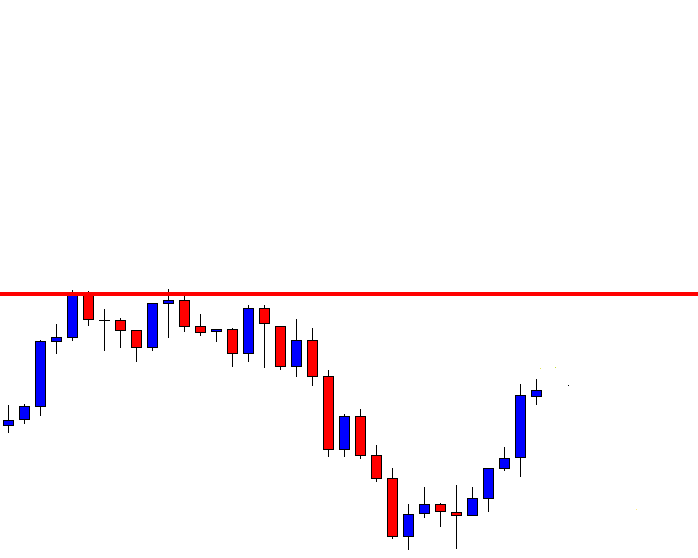
The last daily candle comes out as an Inside bar. As far as the candlestick pattern is concerned, the price is bullish biased. If we get a bullish engulfing candle closing above the last two candles, the price may head towards the red marked level.

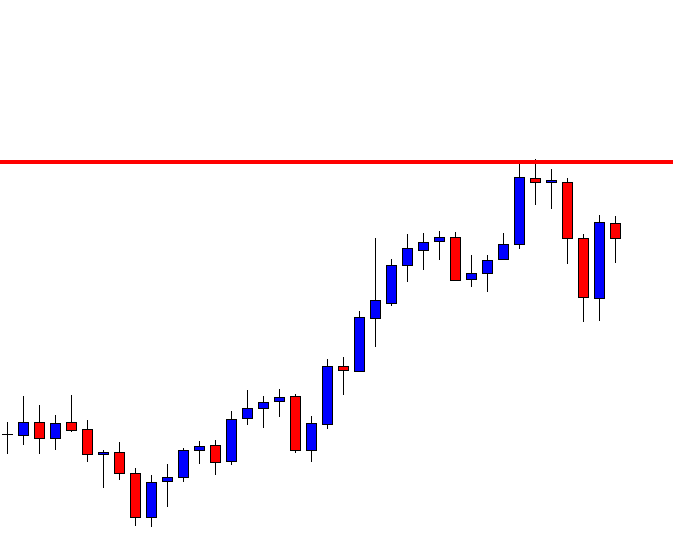
Here it comes. A bullish engulfing candle with a long lower shadow closes above the last two candles. This is a buy signal to go long for the daily traders (it is a daily chart). Daily traders may trigger a long entry right after the candle closes. Take Profit level is to be set at the red marked level, and Stop Loss is to be placed below the signal candle’s lower low. Make sure that it offers a 1:1 risk-reward ratio, at least. Let us find out how the trade goes.
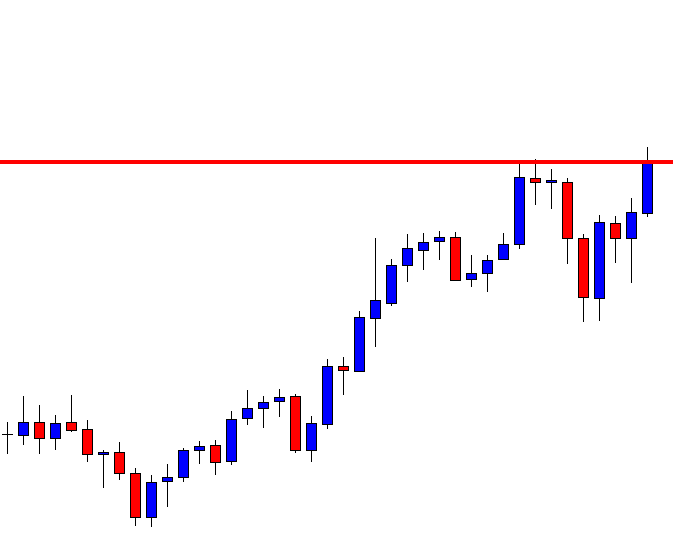
It goes well. It may go towards the North further. Nevertheless, traders may either close the whole trade or take partial profit, at least. The bottom line is we may be eying on a pair to take an entry on a daily-H4 chart combination. The H4 timeframe may not offer an entry. However, the daily chart may do. This is how our effort, time never go in vain, but we make most of our invested time and effort.