
In today’s article, we are going to demonstrate an example of price action trading on the daily chart. In price action trading, a reversal candle or reversal pattern means a lot. Usually, the engulfing candle, track rail, morning start, or evening star are considered strong reversal candles or patterns in price action trading. On the other hand, the inside bar is not considered a strong bearish reversal candle. In the daily-H4 chart combination trading, an inside bar still may offer a good entry since traders take their final decision depending on the H4 chart. To trade on the daily chart, it may be a different case in most cases. Let us have a demonstration of this.

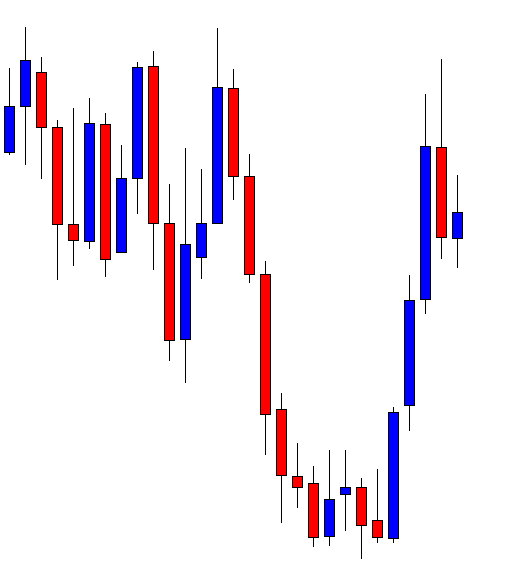
After being bullish for several daily candles, the chart produces an inside bar at a resistance zone. To trade on the daily chart, traders wait for the price to produce a corrective candle followed by another candle towards the trend’s direction. Over here, traders are to wait for a bullish corrective candle followed by a bearish reversal candle closing below the level of support to offer a short entry.
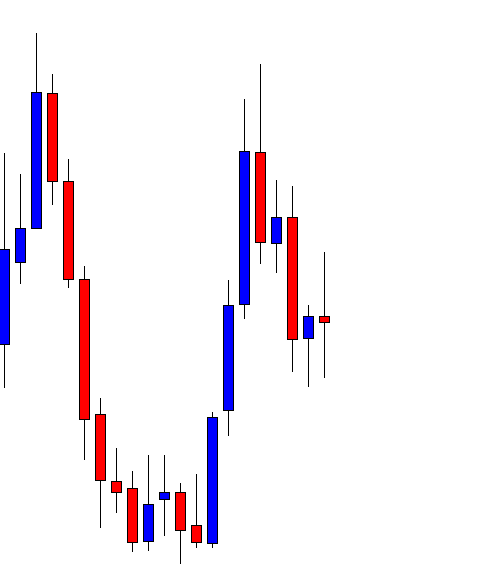
The chart produces a bullish inside bar. Things are going according to the sellers’ expectations. If the chart produces a bearish engulfing candle closing below the last candle’s lowest low, the sellers may trigger a short entry. Let us proceed to the next chart.

The last candle comes out as a bearish engulfing candle closing well below the level of support. The nearest swing low is far enough, which offers an excellent risk-reward. The sellers may trigger a short entry right after the last candle closes.
Things are not going according to the sellers’ expectations. Anyway, the sellers must be patient with the position. Let us proceed to the next chart and find out what the price does next.
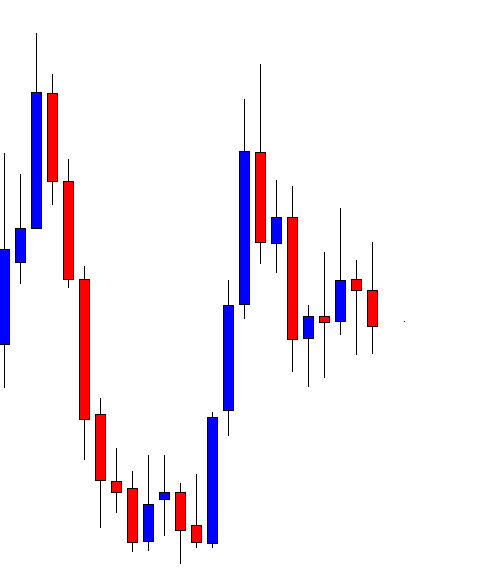
The price consolidates for several candles. The last two candles look good for the sellers. However, the level of consolidation support is still held. Do not forget the point that the sellers have been holding the position for the last five trading days.
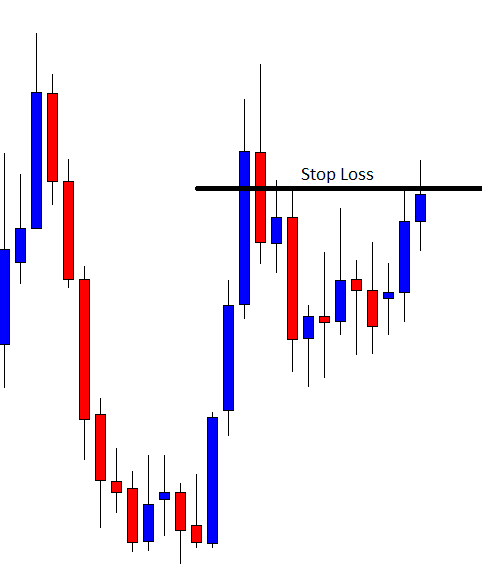
It makes the sellers wait longer and heads towards the North to hit the stop loss. Taking a loss or getting the stop loss hit is a usual incident in the Forex trading. However, if we dig into this case study, we find that apart from the trend-initiating candle, everything gets A+. In trading on the daily chart, an inside bar may get us a profit on many occasions. However, if we compare it with other strong reversal pattern or candle, the winning percentage may not impress us.