Categories
Forex Fibonacci

Fibonacci Levels Help Traders Make Better Trading Decision

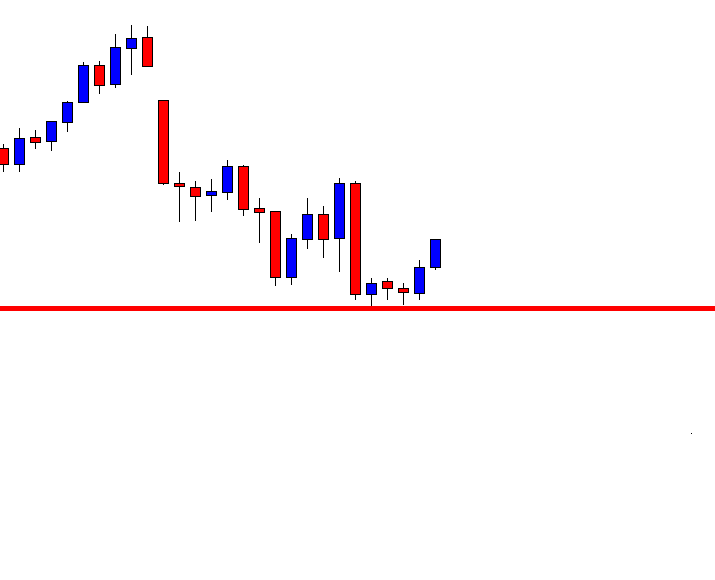
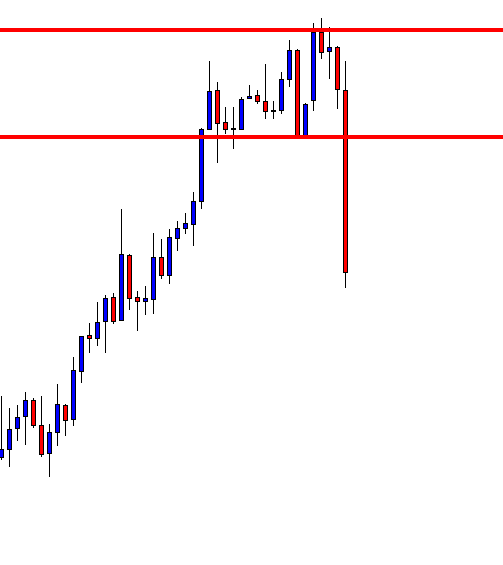
In today’s lesson, we are going to demonstrate a chart where the price makes a strong bearish move from a Fibonacci level. It has two messages, which we will find out soon. Let us get started with the chart’s price action.

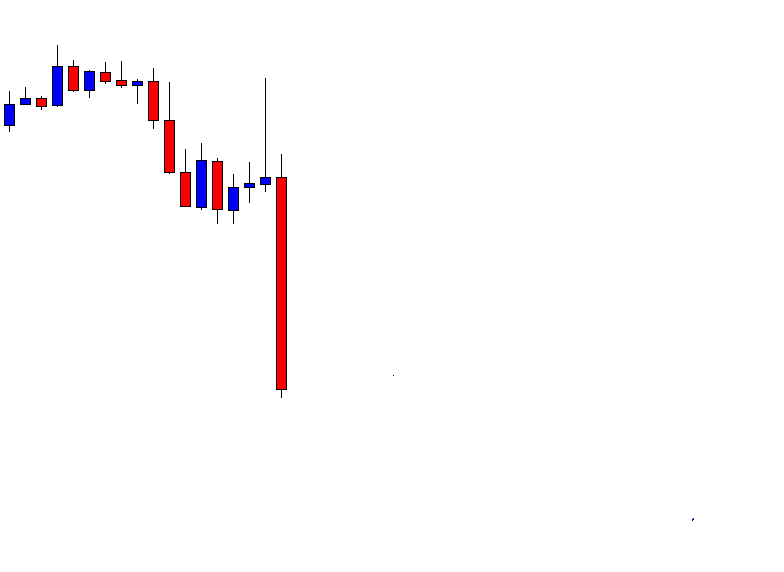
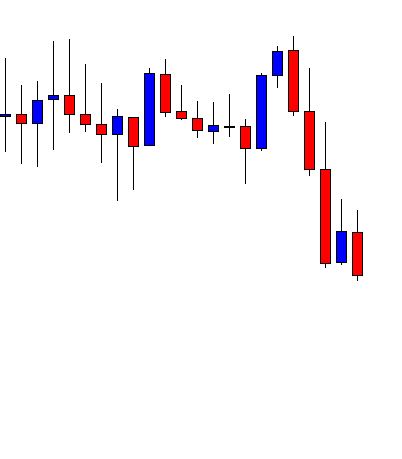
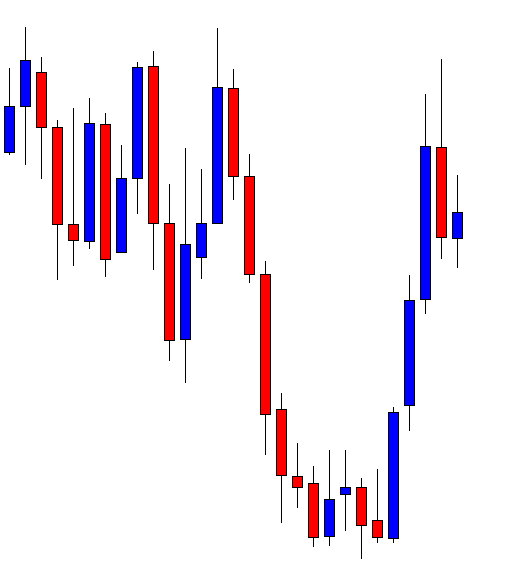
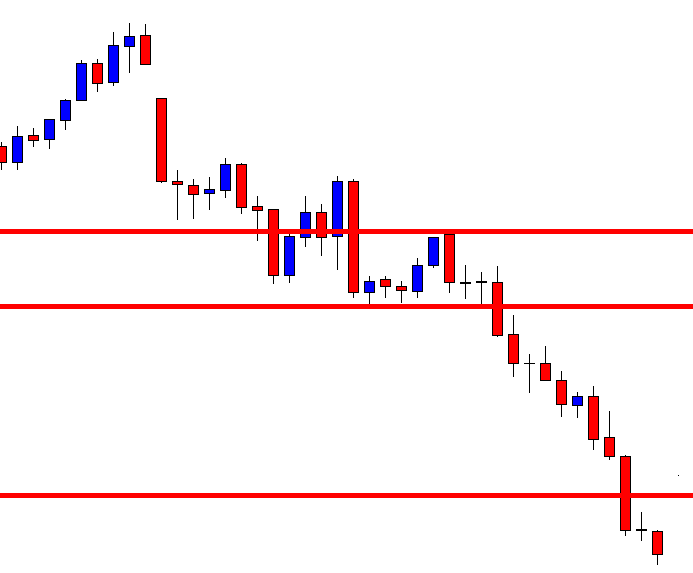
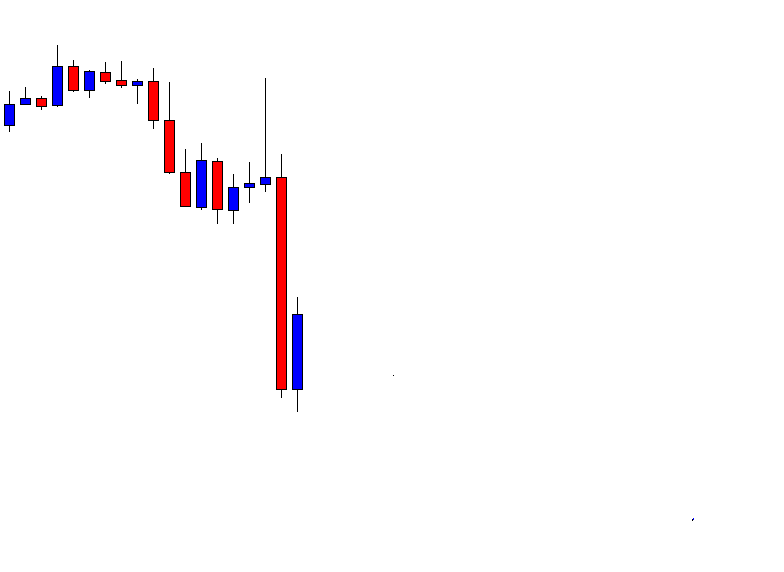
The chart shows that the price makes a strong bearish move. The last candle comes out as a long bearish candle, which states that the sellers dominate over the buyers. Traders may want to wait for the price to make a bullish correction to go short in the pair with more aggression.

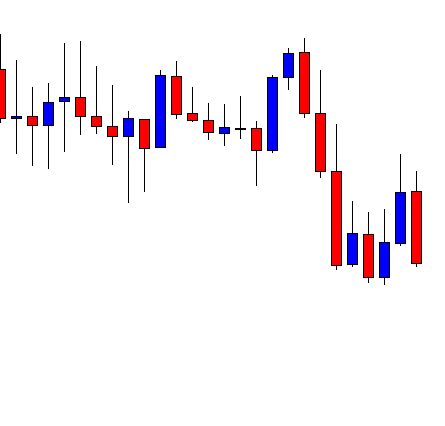
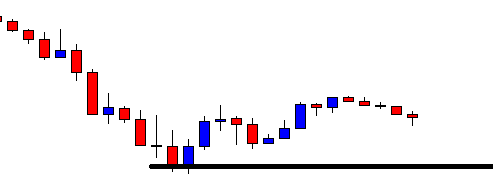
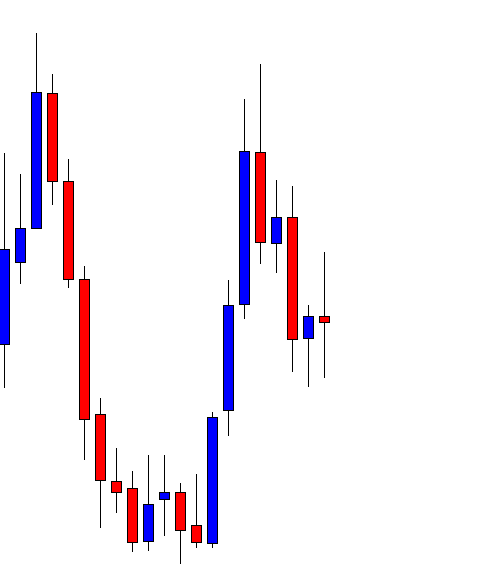
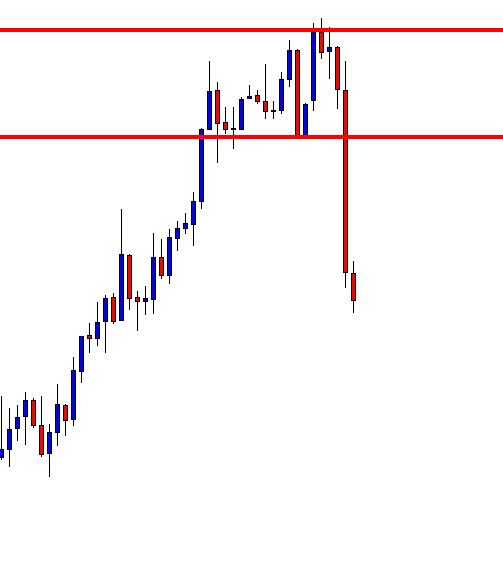
The chart produces a bullish inside bar. The sellers are to keep their eyes on the pair to get a bearish reversal candle to go short. It seems that the pair may produce a strong bearish reversal candle (the signal candle) soon.

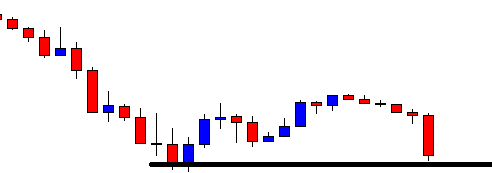
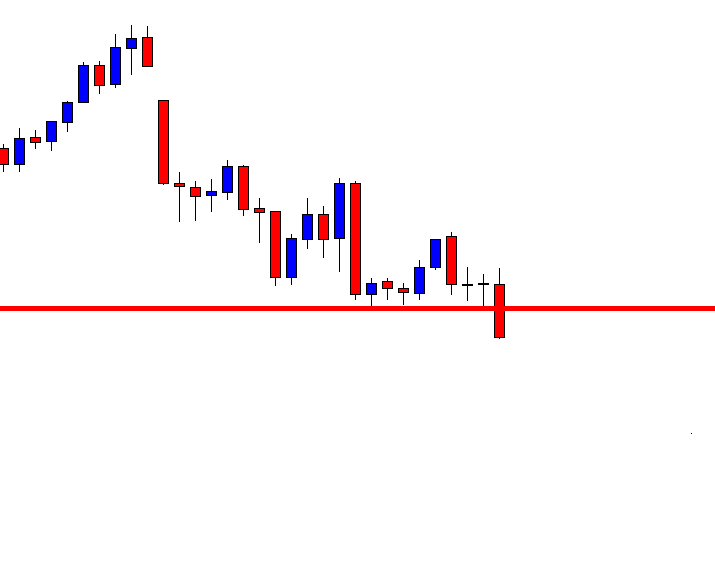
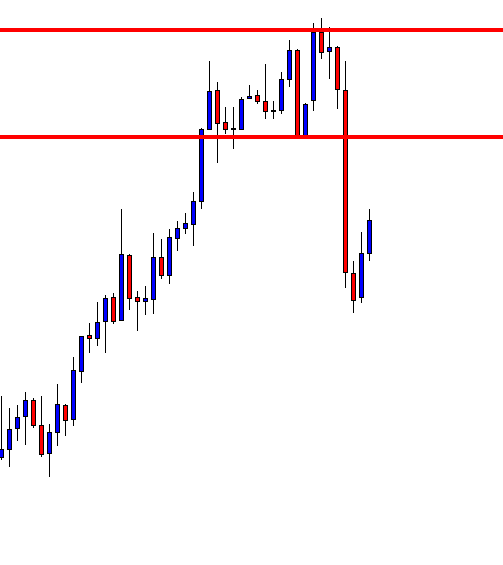
The chart produces a bearish inside bar, which is not the sellers’ favorite to go short. The price makes a little bearish move and heads towards the North again. Look at the last candle in the chart. It comes out as a bearish engulfing candle, which is one of the strongest bearish reversal candles.

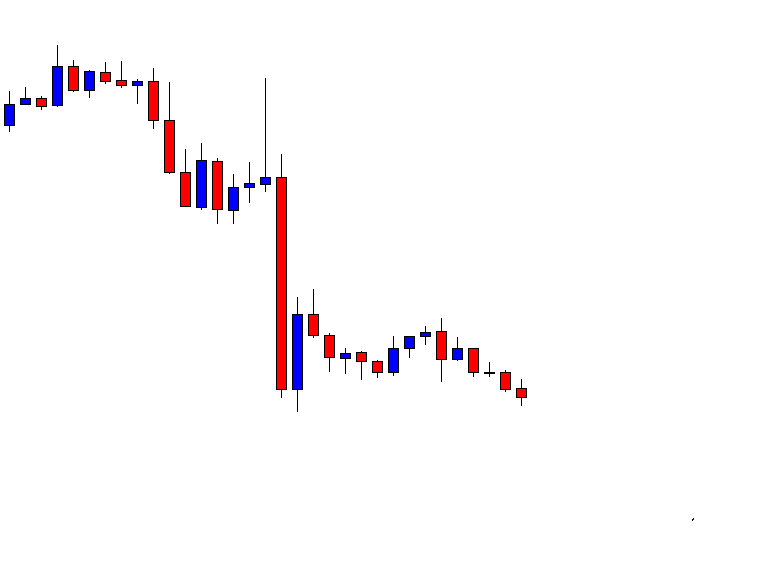
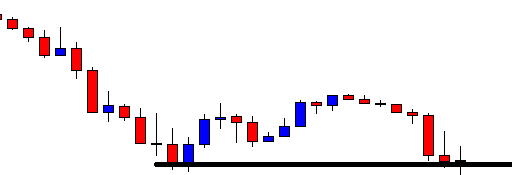
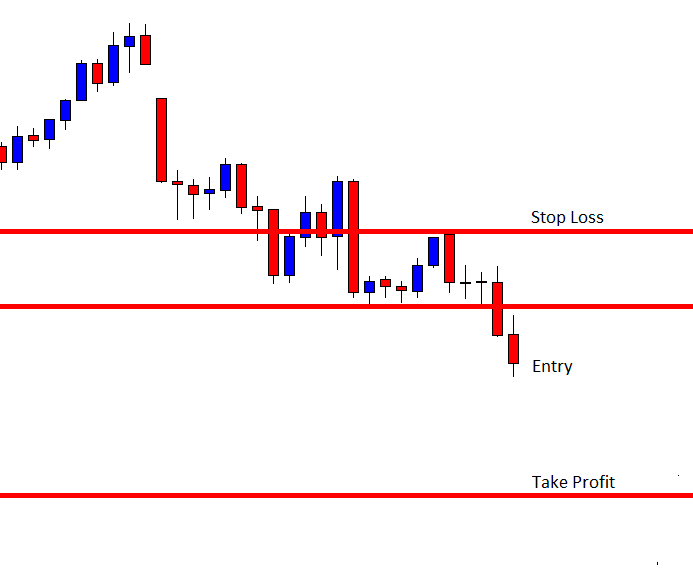
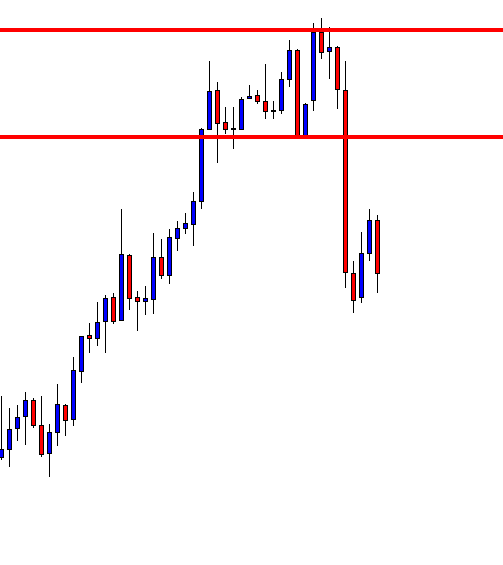
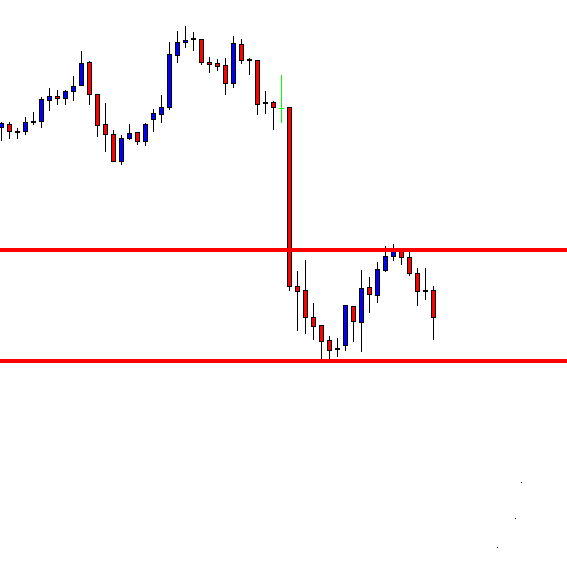
As expected, the bearish engulfing candle drives the price towards the South. The sellers on the minor chart are going short. Thus, the price is about to make a breakout at the last swing low on the chart as well.

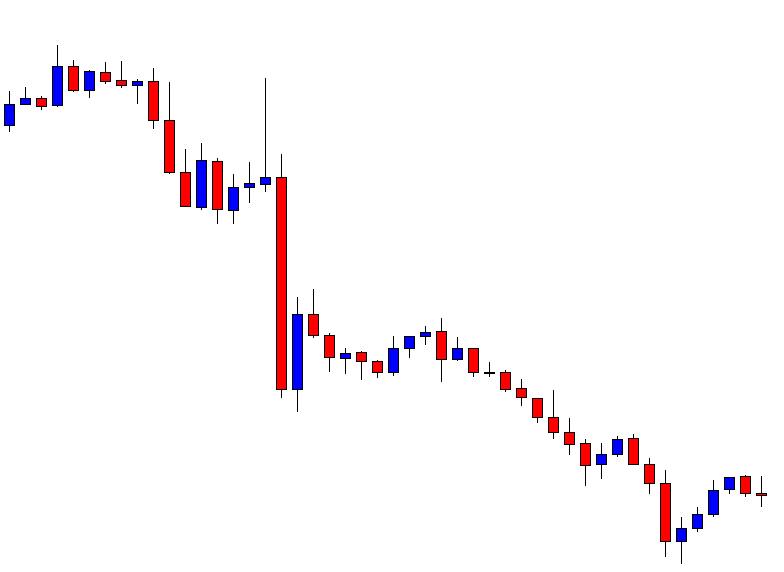
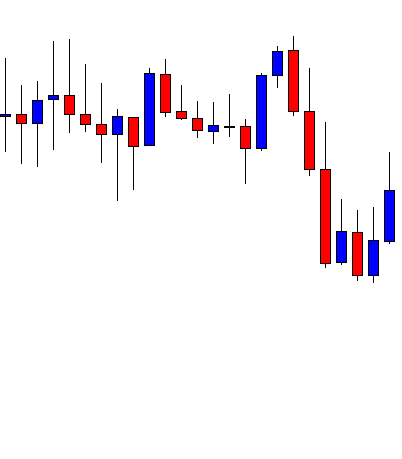
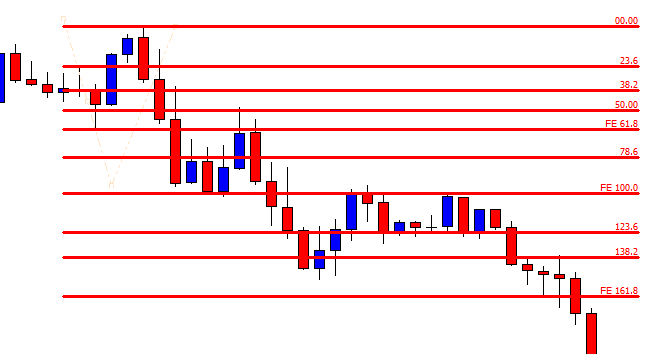
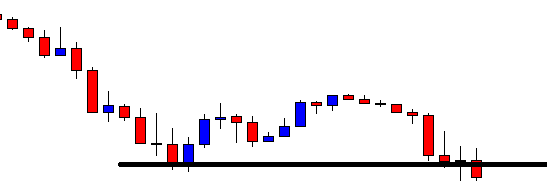
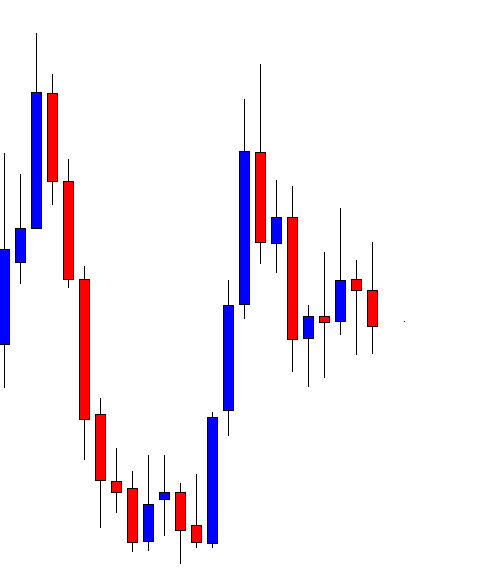
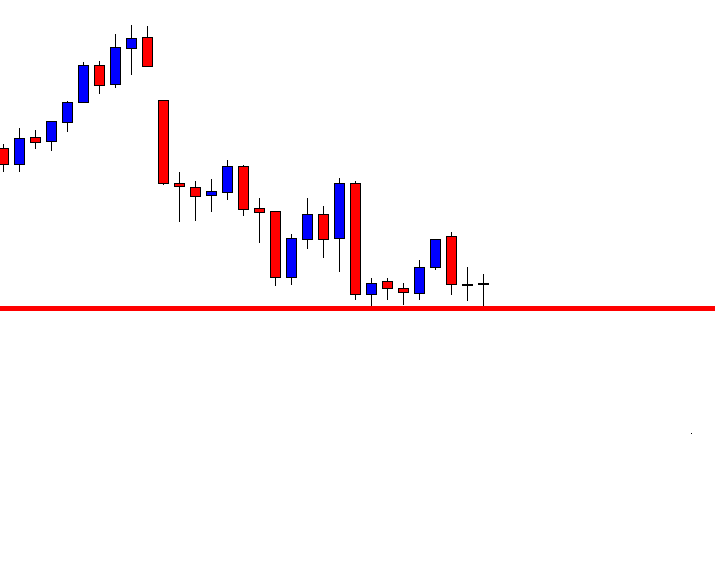
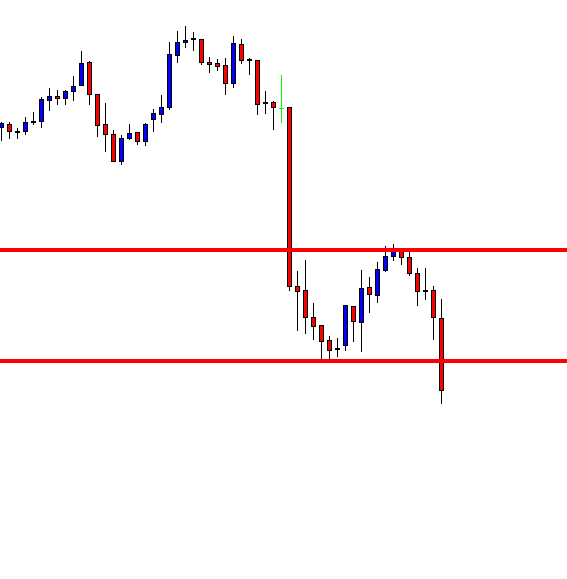
The price makes a breakout at the last swing low and heads towards the South further. Then, it produces two bullish candles in between but continues its bearish journey again. The price may have found its support since it produces four consecutive bullish candles. The price may continue its bearish journey, or it may make a bullish reversal. The bull looks good here. Let us draw Fibonacci levels and see whether it gives us a clue about the trend continuation or a reversal.

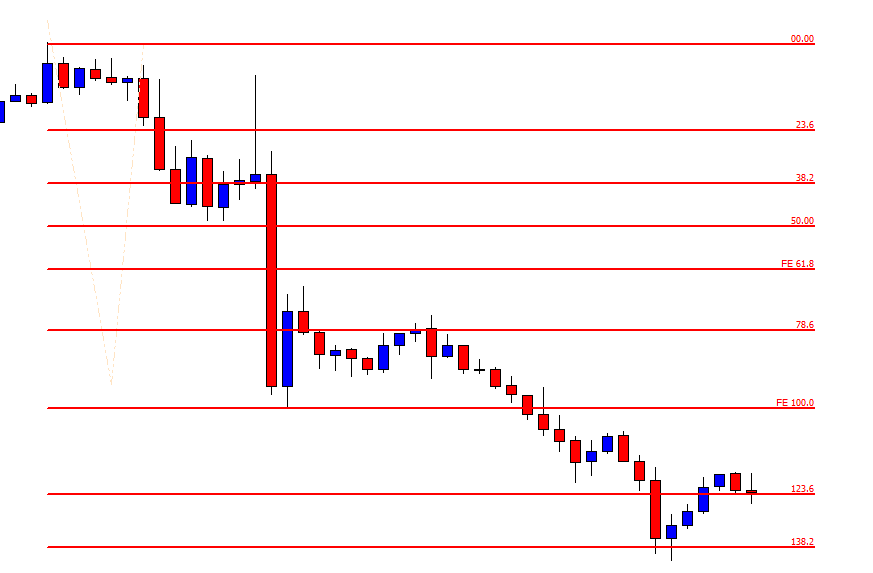
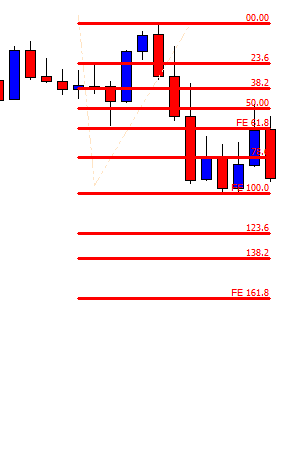
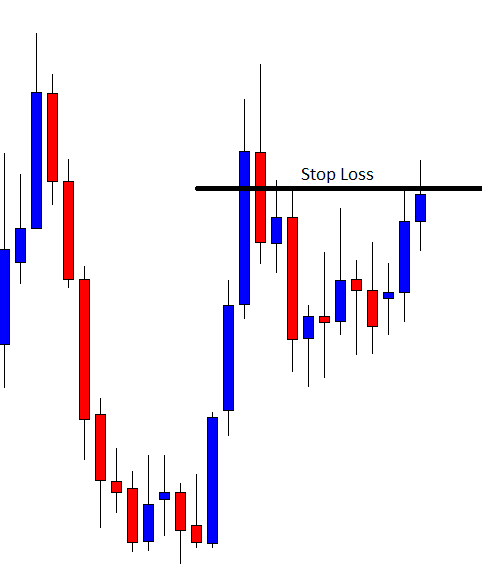
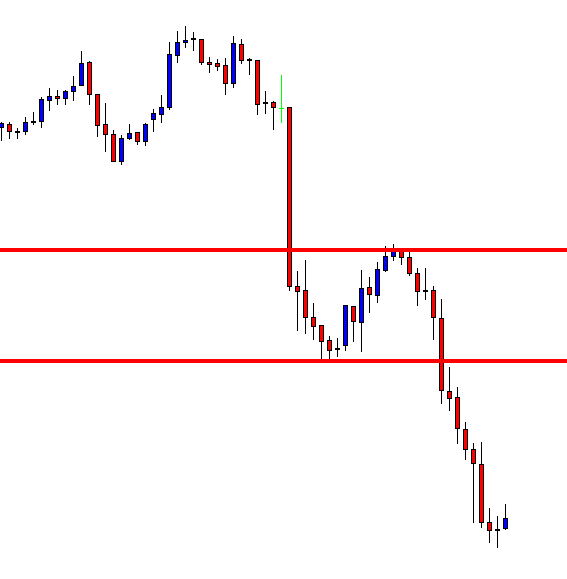
The chart produces a bullish inside bar right at 138.2 level. Please note that the price makes its bearish move from 78.6 level. The level of 78.6 has a strong relation with 138.2. If the price trends from 78.6, it often makes a reversal at 138.2. This is what happens here.

To sum up, if we learn the art of using Fibonacci levels and understand how a level is related to others, it becomes easy for us to take trading decisions such as entry, exit, and taking a partial profit. In the end, it makes us prolific traders.


Categories
Forex Daily Topic Forex Fibonacci

Fibonacci Trading: The Golden Ratio

Fibonacci trading is one of the most prolific trading methods, which is widely used by Forex traders. Retracement length, Fibo levels as well as reversal candle are three factors that Fibonacci traders need to pay attention to. In today’s article, we are going to demonstrate an example of a chart, which makes an excellent bearish move after having a retracement. The length of retracement, the most significant Fibo level, and the reversal signal all play their part in this example. Thus, fasten your seat belt and read through.

The chart shows that it makes a strong bearish move and makes a breakout at long-held support. The price heads towards the South, searching for its support. The sellers are to wait for the price to have a retracement.

The price starts having retracement. It produces a bullish inside bar followed by another bullish candle. The sellers are to wait for the price to find its resistance and produce a bearish reversal candle. However, the Fibonacci traders are to wait for the price to produce a bearish reversal candle at a very particular level, which is the 61.8 level.

The chart produces a bearish engulfing candle closing well below the last bullish candle. The Fibonacci traders must draw the Fibonacci retracement levels to find out which level produces this reversal candle. If this is the level of 61.8, the Fibo sellers are going to go short in the pair.

The highest high is the level of 0.00, and the lowest low is the level of 100.0. The price has a retracement and produces a bearish engulfing candle right at Fibo level 61.8. Usually, when the level of 61.8 works as support/resistance, it drives the price towards the level of 161.8. This means the price may head towards the South and hit the level of 161.8 next. Let us proceed to the next chart and see what the price does here.

The price hits 161.8 level. It makes an upward correction on its way. However, it reaches the level at last. The last candle shows that it breaches the level of 161.8. The price may head towards the South further.

The level of 61.8 is called the Golden ratio. It is a super significant level as far as Fibonacci Retracement is concerned. The buyers in a buying market and the sellers in a selling market wait for the price to produce a reversal candle/signal candle to go long/short in a pair. Yes, there some equations for the traders to know and obey to be able to trade with Fibonacci retracement. Once they learn them well, Fibonacci trading can make them a handful.

Categories
Forex Price-Action Strategies

Skip Some Entries to Maintain Winning Consistency

Forex price action breakout trading strategies mainly rely on the breakout. Breakout candle’s attributes mean a lot, whether we shall take entry or not. If a breakout takes place with a strong bullish/bearish candle followed by another strong bullish/bearish candle, it is considered a good entry. On the other hand, if a breakout takes place right from the support/resistance level, it is not considered a good entry. In today’s lesson, we are going to demonstrate an example of a breakout from the breakout level. Let us find out what happens in the end.

The price after being bearish finds its support. It has been making a bullish correction. The sellers should wait for the price to produce a bearish reversal candle and a breakout with a good-looking bearish candle.

The price heads towards the level of resistance. If the last candle makes a breakout closing well below the level of resistance, it would be a perfect breakout by a good-looking bearish candle. It rather closes adjacent to the level, which may not produce a strong bearish candle to make the breakout.

It produces more candles but does not make the breakout. The price is roaming around the breakout level, which is not a good thing for the sellers. Usually, if a candle closes below the breakout level right from the level, it consolidates. Traders are to wait more and get less reward.

The next candle closes below the breakout level. It is a breakout but not the breakout that the breakout traders would love to get. Let us proceed to the next chart to find out what happens next.

The next candle closes well below the breakout candle. It confirms the breakout. A question may be raised here whether the sellers take the entry or not. Since the breakout is rather a fragile breakout, it is best to skip such entry. The price often comes back to the breakout level and takes time to finds its next direction. Yes, sometimes it continues to go towards the breakout direction too. Let us proceed to the next chart and find out what happens here.

The price here heads towards the South with extreme bearish pressure. The last candle suggests that the trend is strong, and it may continue. According to our today’s lesson, we shall skip taking such entry. It means we have wasted an opportunity. Do you really believe so?

Do not think it is an opportunity missed. A losing trade hurts a lot. We do not only lose money, but we also lose our faith. Forex trading is a psychological game. To be consistent, we must have strong faith in our trading strategy. To have that,  we must maintain winning consistency.

Categories
Forex Price-Action Strategies

Trading on the Daily Chart: The Inside Bar May Disappoint You More Often

In today’s article, we are going to demonstrate an example of price action trading on the daily chart. In price action trading, a reversal candle or reversal pattern means a lot. Usually, the engulfing candle, track rail, morning start, or evening star are considered strong reversal candles or patterns in price action trading. On the other hand, the inside bar is not considered a strong bearish reversal candle. In the daily-H4 chart combination trading, an inside bar still may offer a good entry since traders take their final decision depending on the H4 chart. To trade on the daily chart, it may be a different case in most cases. Let us have a demonstration of this.

After being bullish for several daily candles, the chart produces an inside bar at a resistance zone. To trade on the daily chart, traders wait for the price to produce a corrective candle followed by another candle towards the trend’s direction. Over here, traders are to wait for a bullish corrective candle followed by a bearish reversal candle closing below the level of support to offer a short entry.

The chart produces a bullish inside bar. Things are going according to the sellers’ expectations. If the chart produces a bearish engulfing candle closing below the last candle’s lowest low, the sellers may trigger a short entry. Let us proceed to the next chart.

The last candle comes out as a bearish engulfing candle closing well below the level of support. The nearest swing low is far enough, which offers an excellent risk-reward. The sellers may trigger a short entry right after the last candle closes.

Things are not going according to the sellers’ expectations. Anyway, the sellers must be patient with the position. Let us proceed to the next chart and find out what the price does next.

The price consolidates for several candles. The last two candles look good for the sellers. However, the level of consolidation support is still held. Do not forget the point that the sellers have been holding the position for the last five trading days.

It makes the sellers wait longer and heads towards the North to hit the stop loss. Taking a loss or getting the stop loss hit is a usual incident in the Forex trading. However, if we dig into this case study, we find that apart from the trend-initiating candle, everything gets A+. In trading on the daily chart, an inside bar may get us a profit on many occasions. However, if we compare it with other strong reversal pattern or candle, the winning percentage may not impress us.


Categories
Forex Price-Action Strategies

An H1 Trading Strategy, A New Arrow in the Quiver

The H1 chart is one of the most traded charts in the Forex market. This is a very consistent chart considering other intraday charts. In today’s article, we are going to learn a strategy to trade on the H1 chart in the Forex market.

This is an H1 chart. The price after making a bearish move seems to have found its support. It produces two consecutive bullish candles. The buyers are to wait for the price to consolidate and create a bullish breakout to go long. On the other hand, the sellers are to wait for a bearish reversal candle and make a bearish breakout to go short on the pair. Let us find out what the price does next.

The chart produces a bearish engulfing candle, which is the strongest bearish reversal candle. The sellers have the upper hand here. A breakout at the level of support is the next thing to take a short entry here.

The price consolidates around the level of support. The level of support becomes double bottom support. A strong battle is going on between the buyers and the sellers. Traders must wait to find the next direction.

It makes an explicit bearish breakout. Admittedly, the sellers have outplayed the buyers. Traders shall get themselves ready to go short on the pair. The question is why they have to get themselves ready. Should not they trigger any entry right after the last candle closes? The answer is no. They must wait for the next candle to close below the breakout candle. This is the trickiest part of this strategy. Traders must wait for one more candle to make a new lower low (in a bearish market).

Here it comes. The next candle comes out as a bearish candle closing well below the breakout candle. An entry may be triggered right after the last candle closes. The stop loss level is easy to be found out. It is above the level where the trend initiates. We see that a red marked take profit level as well. However, the chart does not show that it is a significant level. How do we find this out then? We may set our take profit exactly with a 1:1 risk-reward ratio. It means the length of entry to stop loss equals to the length of entry to take profit in this strategy. Let us find out how the trade goes.

The trade goes well. We will demonstrate more examples of this strategy soon. Meanwhile, let us concentrate on the things to remember.

  1. The trend initiation candle is to be a strong reversal candle.
  2. The breakout is to be very explicit.
  3. The very next candle is to close below (in a bearish market) or close above (in a bullish market).
  4. Take Profit is to be set with no more than 1:1 risk-reward.
Categories
Forex Price-Action Strategies

The H4-H1 Chart Combination Keeps You Busy Even in a sluggish Market

Usually, the Forex market gets sluggish in December. It gets tough for traders to find out a good entry on major charts as far as price action is concerned. However, the H4-H1 chart combination still offers a few entries. In today’s lesson, we are going to demonstrate an example of an entry based on the H4-H1 chart, which was offered in mid-December 2019.

Let us proceed.

We’re looking at the H4 chart. The last candle makes a strong breakout at the last swing low. Traders are to wait for consolidation and H1 breakout to go short on the pair. Let us find out whether it starts consolidating from right there or comes further down.

It comes down further for one more candle. It means traders are to wait longer. However, the nearest support is far enough. Thus, the price has a lot of space to travel towards the South.

The price starts consolidating and produces two bullish candles consecutively. The pair is to make a big decision from here. Does it continue its journey towards the North, or does it find its resistance nearby? Let us find out from the next chart.

The price finds its resistance and produces a bearish engulfing candle. The sellers have been waiting for this. It is time for the traders to flip over to the H1 chart and wait for an H1 bearish breakout to take a short entry. Let us find out how the H1 chart looks.

The H1 chart shows that the price produces an engulfing bearish candle and heads towards the South. The price on this chart makes a breakout at the red marked support level. It may make the traders wait for, or it may make a breakout straightway. Let us what the price does here.

The price makes an explicit bearish breakout. The breakout candle looks very strong, barely having a lower shadow. A short entry may be triggered right after the candle closes by setting Stop Loss above the level where the H4 chart produces the bearish reversal candle. Let us now find out how it ends.

The price heads towards the South with good bearish momentum. It produces a bullish engulfing candle having a long upper shadow. It may be time for the sellers to close the whole entry since it is the month of December.

As mentioned, in December, traders do not get as many entries as they usually get. However, the H4-H1 chart combination may offer a few entries occasionally even when the market gets sluggish.