In today’s lesson, we are going to demonstrate the formation of a down-trending Trendline. A trendline can be formed with a double top or double bottom as well. However, double top’s resistance or double bottom’s support may not be horizontal. Let us find out how they may look in the chart.
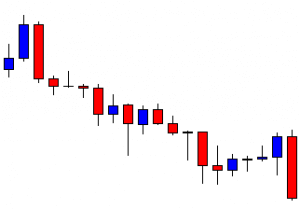
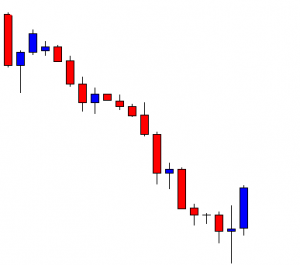
The chart shows that the price heads towards the South with moderate bearish pressure. The last candle comes out as a bearish engulfing candle closing well below the last swing low. The sellers may wait for the price to consolidate or make a bullish correction to go short.
The chart produces two bullish candles. The price has a rejection from the zone where it had a rejection earlier. The last rejection does not come from horizontal support, but it looks adjacent to that. Thus, it can be considered as a double top’s resistance zone.
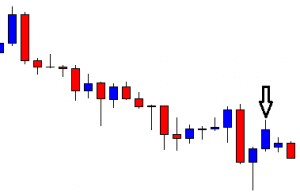
The price heads towards the South by making a breakout at the last swing low. It produces a bullish inside bar. If the chart produces a bearish reversal candle, the sellers may go short below the last swing low. Let us proceed to find out what happens next.
The price gets bearish by making a breakout at the last swing low. Look at the last three candles. The combination of these three candles is called Morning Star. It seems that the price may make a long bullish correction. Can you guess where the price may find its next resistance?
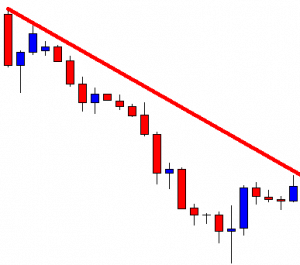
We can draw a down-trending trendline here by using those points of the double top. Look at the price action around the trendline’s resistance. The last candle comes out as a bullish candle with an upper shadow. A bearish reversal candle at the trendline’s resistance may drive the price towards the South again.
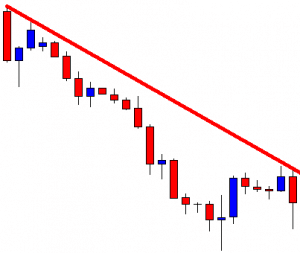
The trendline’s resistance produces a bearish engulfing candle. It has a long lower shadow, though. The sellers may go short below the last candle’s lowest low. Let us find out what the price does.
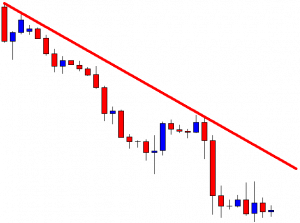
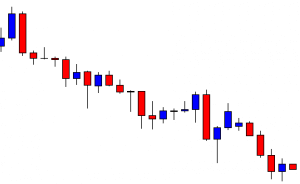
As expected, the price makes a strong bearish move and makes a new lower low. Thus, the sellers may wait again for the price to go towards the trendline’s resistance and get a bearish reversal candle to go short in the pair. In a word, a very valid trendline is in play in this chart. Do you remember how it has started? It has started from a point that does not seem to form a trendline. The slope has been tiny, making it difficult to spot out. However, the market often produces such a trendline with a tiny slope, which shall be taken into account by the trendline traders.