In today’s lesson, we are going to demonstrate an example of the H1 -15M combination trading strategy offering entry upon consolidation. We are going to integrate Fibonacci levels to see how far the price moves. This would give us an idea of how effective Fibonacci levels are to determine the stop loss and take profit level. Let us get started.

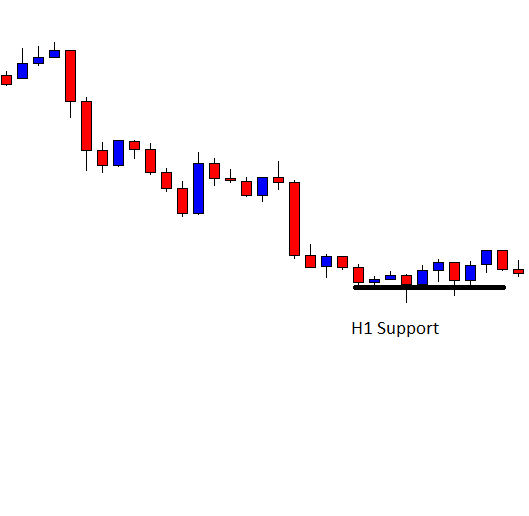
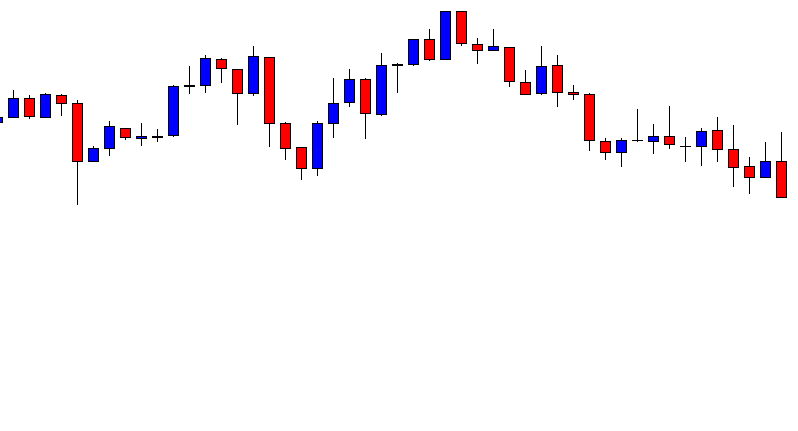
The H1 chart shows that the price makes a strong bearish move and finds its support. The black marked level is the level of H1 support here. The price moves towards the North with two candles and may have found its resistance. One of the candles comes out as a bearish engulfing candle. Traders are to wait for an H1 breakout followed by a 15M bearish reversal candle to go short in the pair. Let us see what happens here.
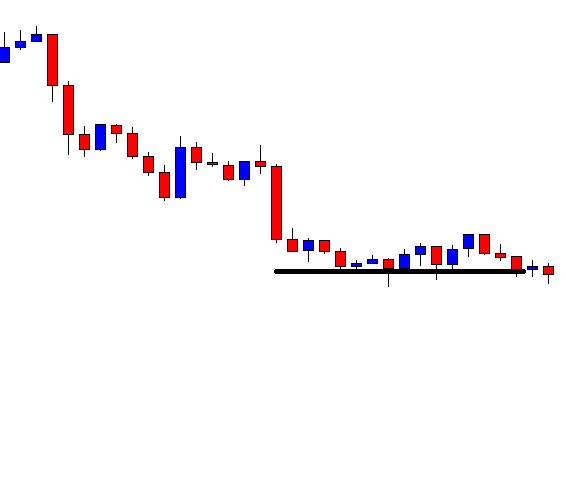
The chart produces one more bearish candle followed by a doji candle. It means the price consolidates in this chart. The next candle closes just below the level of support. Ideally, this is not a perfect breakout candle. However, the price consolidates and produces an H1 bearish reversal candle (the last candle). This is a signal that the price may get bearish and head towards the South. Let us flip over to the 15M chart.

The 15M chart shows that the last candle comes out as a bullish candle. Do not forget that H1 candle closes with a bearish body. Thus, a 15M bearish reversal candle (preferably engulfing candle) will push the price towards the South.
Look at the last 15M candle. It comes out as a bearish engulfing candle closing well below the last candle. This means the price may head towards the South with good bearish momentum. Let us proceed to the next chart with Fibonacci levels to find out how far the price heads to.
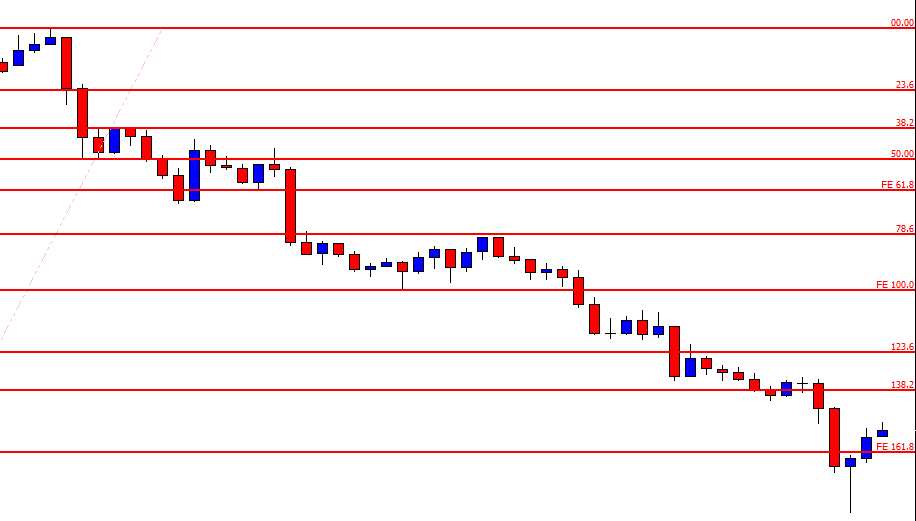
The price trends from the 78.6% level and reaches 161.8%. Usually, the 78.6% Fibo level drives the price towards the level of 138.2% with good momentum. It often reaches up to the level of 161.8% because of momentum. However, we may set our target at 138.2% if it trends from 78.6%. Another point you may have noticed is that we draw Fibonacci levels by using the lowest low, not the H1 support. These are two different things.
If the H1 chart makes a straight breakout, we may wait for a 15M reversal candle to take entry. If it consolidates and produces an H1 reversal candle, we may trigger entry if 15M chart produces a strong reversal candle closing well below the wave’s lowest low. Do some backtesting; you will see many charts where the price makes a move like this. Stay tuned. We will reveal more examples of this.