In today’s lesson, we are going to demonstrate an example of trendline trading and how the trade may be managed. We know that trading with a trendline is very rewarding since an established trendline often ends up offering several entries. However, things may not always go as smoothly as we like. Like other trading strategies, trendline trading may end up offering entries that may not hit the target or make traders have a loss. In today’s lesson, we are going to see an example of trendline trading, where things do not go according to traders’ expectations.
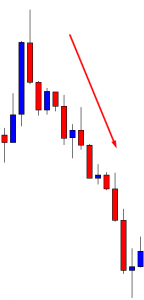
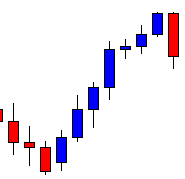
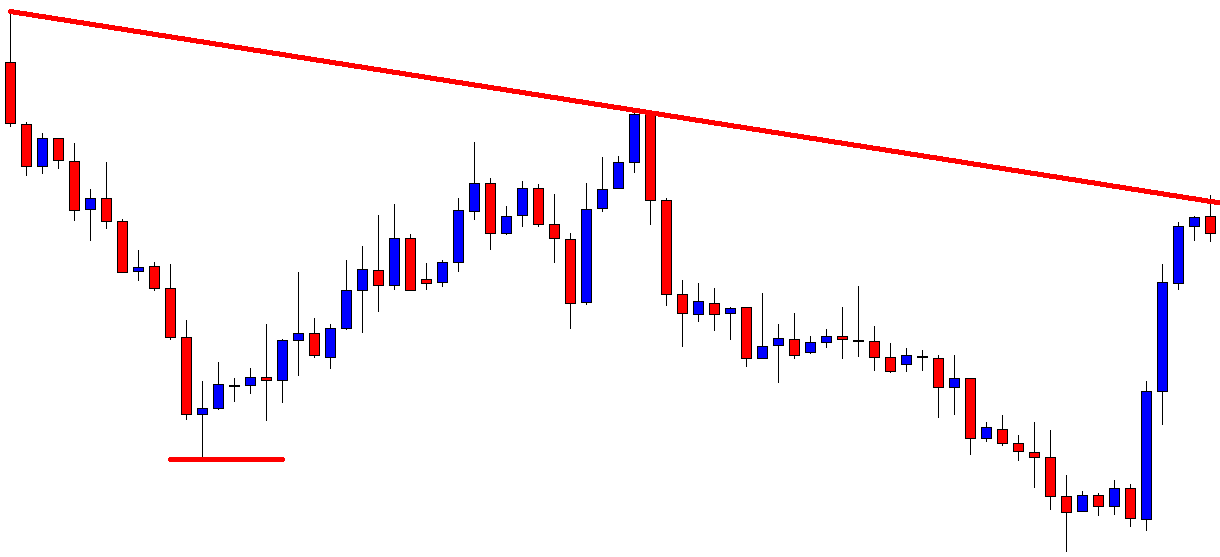
The chart shows that the price makes a strong bearish move. It may have found its support. It produces two bullish candles. The sellers may wait for the price to make a breakout at the lowest low to go short in the pair. Let us find out what happens next.
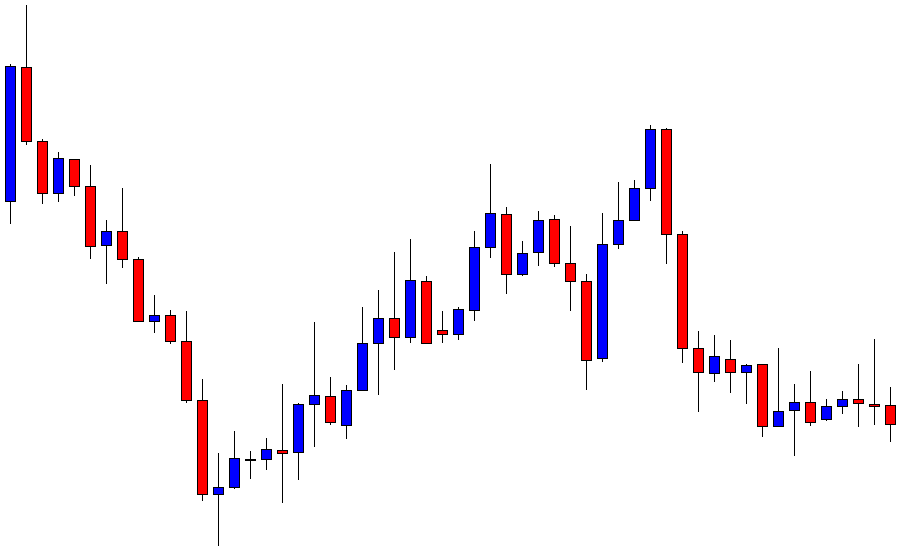
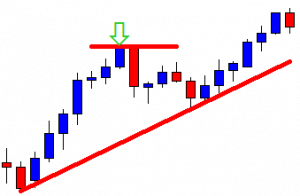
The price makes a long bullish move followed by a bearish correction. It produces a bearish engulfing candle and heads towards the South again. The chart is bearish biased, but the pair is trading around the level, where it had a bounce earlier.
The price makes a breakout at the level and trades below the level for several candles. It means the sellers have two higher highs from where the price makes two bearish breakouts. It means the sellers can draw a trendline here and wait for the price to go towards the trendline’s resistance to go short in the pair.
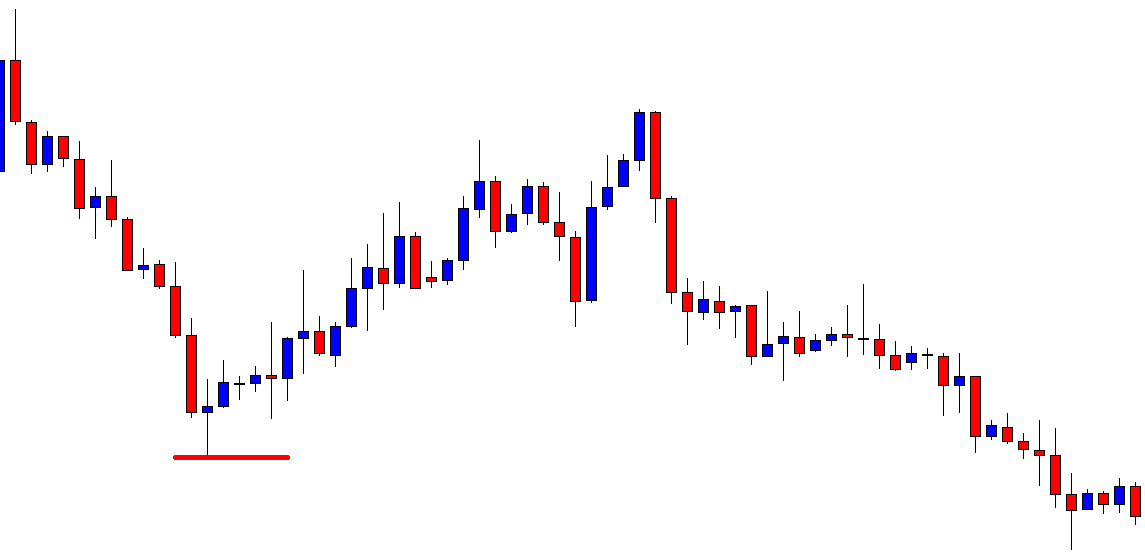
The price heads towards the South and produces a bearish engulfing candle. The sellers may trigger a short entry right after the last candle closes by setting take profit at the last swing low.
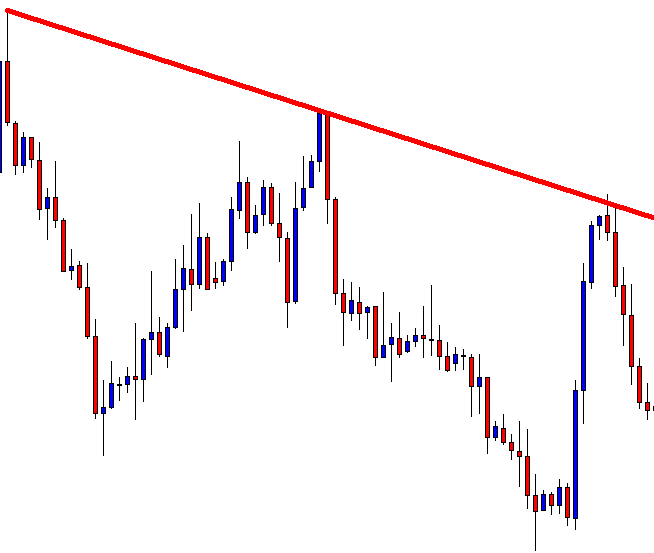
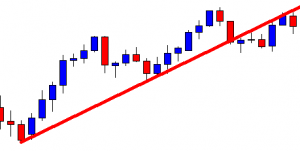
It looks fantastic for the sellers. The price heads towards the target in a hurry. It seems the sellers do not have to wait too long to reach the target. The way it has been going, the price may end up making a breakout at the last swing low too.
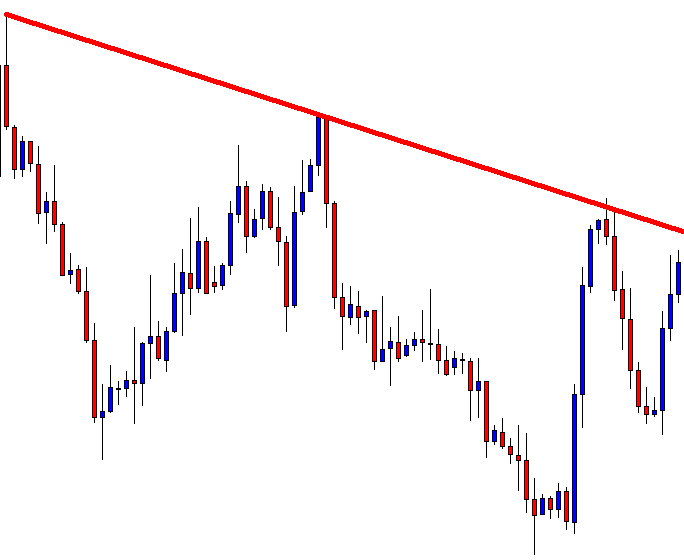
It does not. The price finds its support and produces a bullish engulfing candle. It heads towards the trendline’s resistance. The sellers must be disappointed with the entry. They may have to encounter a loss here.
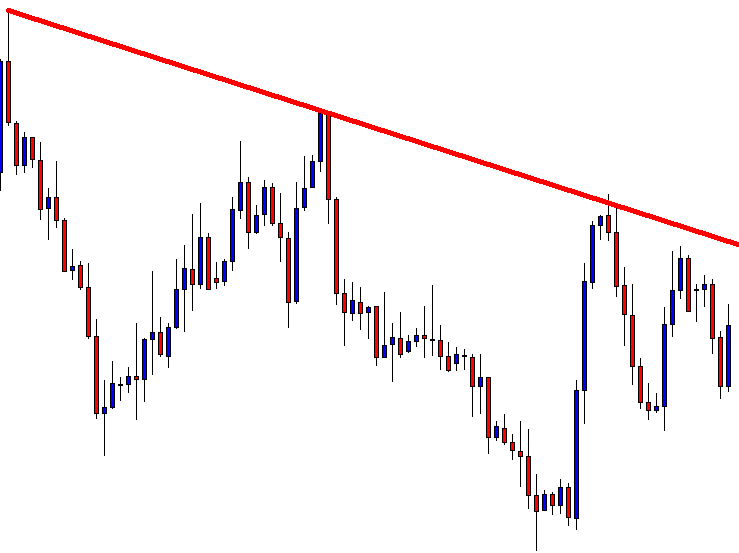
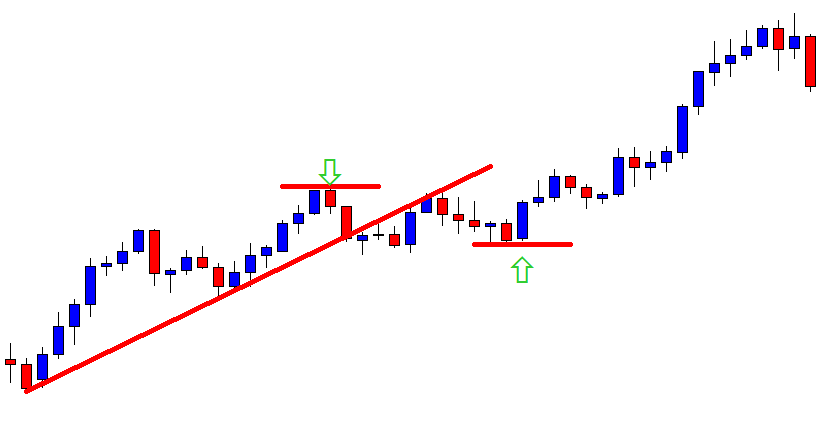
The price finds its resistance as well. It does not go towards the trendline’s resistance, but it makes a bearish move. Look at the last candle. It comes out as a bullish engulfing candle. The entry is running with some profit, and the trendline’s resistance is still intact. What do you think the sellers do with the entry? If we follow ‘set and forget,’ we may leave it like this and wait until the price hits either the stop loss or the take profit. It is an H4 chart. Many traders look after their trades and manage their trade by taking a decision as far as price action is concerned. In this case, they may do two things.
- Close the whole trade
- Close 50% trade and let rest of the 50% run
We come across three types of trade management here. It is up to you which one you choose. Choose one that suits your trading style and stick with it.