
In today’s lesson, we are going to demonstrate an occurrence that often happens when the price trends with a trendline. A trendline works as a support/resistance. However, there is a little dissimilarity between horizontal support/resistance and trendline support/resistance. To draw a horizontal support/resistance, one bounce or rejection is enough. However, a trendline can be drawn only when the price makes a new higher low/lower high. This is what traders must remember, and we find this out the reason behind it.

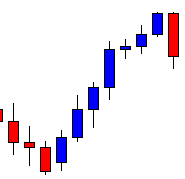
The price makes a strong bullish move, as it produces seven consecutive bullish candles. The last candle comes out as a bearish engulfing candle. Considering the trend’s length, the buyers may keep their eyes on the pair to go long upon having a bullish reversal candle at flipped support.

The price consolidates and bounces at the same level twice. The last candle comes out as a bullish reversal candle. The buyers on the minor chart may look to go long in the pair and push the price towards the North.
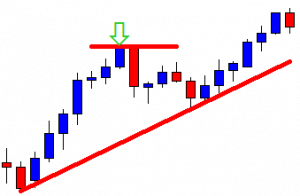
The price heads towards the North and makes a breakout at the last swing high. It means we can draw an up-trending trend line and wait for the price to come at trendline’s support and to get a bullish reversal candle to go long in the pair. Let us find out what happens next.
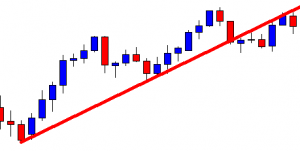
The price does not produce a bullish reversal candle. It makes a breakout at trendline’s support and trades below the level for several candles. If the price makes a breakout at the last swing low, the sellers may look to go short in the pair. Let us see what happens next.
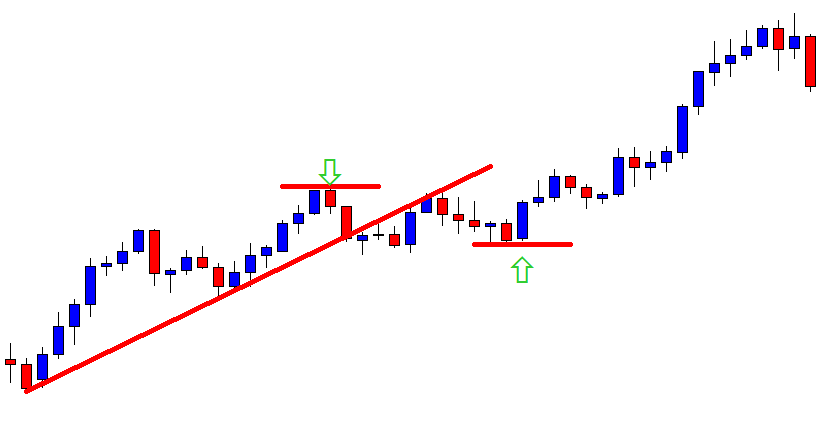
The price upon finding its horizontal support heads towards the North and makes a breakout at the last swing high. What does that mean? It means we can draw an up-trending trend line by using the last swing low from where the price makes a bullish breakout. Let us draw it and see how it looks.
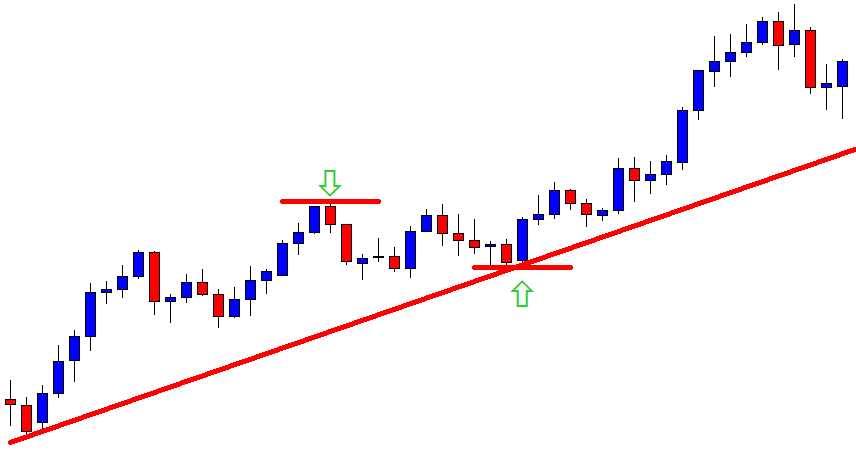
It is a new trendline. It offers price to makes more bearish correction and more space towards the North to travel. As a matter of fact, its support zone has changed, but the new trendline is valid for the same old chart. It’s an incident that happens in the Forex market so often. Thus, keep an eye on a chart closely and do not make an immediate trading decision. Be sure about the breakout. If the breakout is confirmed, change your trading direction. If the breakout is not confirmed, let the price decide its way. We just have to follow the price and trade with its direction.