In today’s lesson, we are going to demonstrate an example of trendline trading. The trendline trading is one of the most consistent trading strategies. Thus, a trader can make profits by properly dealing with how trends develop. In today’s example, we will demonstrate a chart with an up-trending trendline, where the price goes down trendline’s support. However, it produces a bullish reversal candle and ends up offering a long entry. Let us get started.
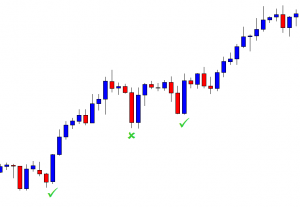
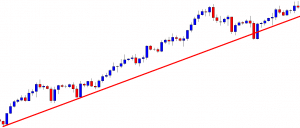
The chart shows that the price heads towards the North upon finding its support. It has several higher lows that can be used to draw trendlines. However, before drawing a trendline on a chart, we have to spot out the most significant higher lows to draw an upward trend line and, conversely, the most significant lower highs to draw a downtrend line. Over here, look at the two points with the ‘right’ marks. Let us proceed to the next chart to find out how it looks with a drawn trendline.
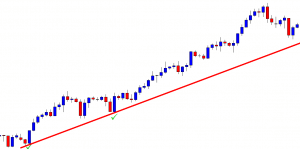
We have drawn the trendline by using two right marks. Ideally, traders are to wait for the price to come at the level of support (trendline’s support) and get a bullish reversal candle to go long in the pair. At the last swing low, the price approaches at the level of support. However, the chart does not produce a bullish reversal candle at the level of support. They may wait for the price to come right at the drawn trendline’s support.
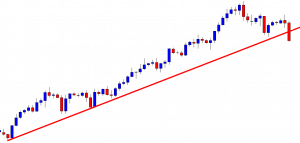
The price comes down. One of the bearish reversal candles closes below the level of support. The sellers may become interested here that the price may end up making a bearish breakout. If the next candle closes below the trendline, the sellers may consider having a breakout. Let us find out what happens.
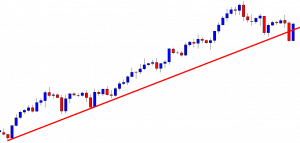
The next candle does not close below the trendline. It comes back in. It means that the price obeys the trendline’s support. The last candle comes out as a bullish Marubozu candle forming by testing the trendline support. The buyers may go long in the pair again and push the price towards the last swing high.
The price heads towards the North at a moderate pace. As far as the bullish reversal candle is concerned, it is supposed to create more buying pressure. Anyway, the price hits buyers’ first take profit target. It may continue its bullish journey if it makes a bullish breakout at the last swing high. If it does not make a new higher high but comes back at the trendline’s support, the price may get choppy. If it makes a new higher high, the trendline becomes active, and the buyers may wait to go long from the trendline’s support again.