In today’s lesson, we are going to demonstrate an example of a breakout on the H4 chart. The chart shows that the price heads towards the North with good momentum. It makes a bullish breakout upon consolidation. However, the breakout is not the kind that the breakout traders look for. Thus, this is going to be an example which we should skip taking entry. Let us now have a look at what happens.
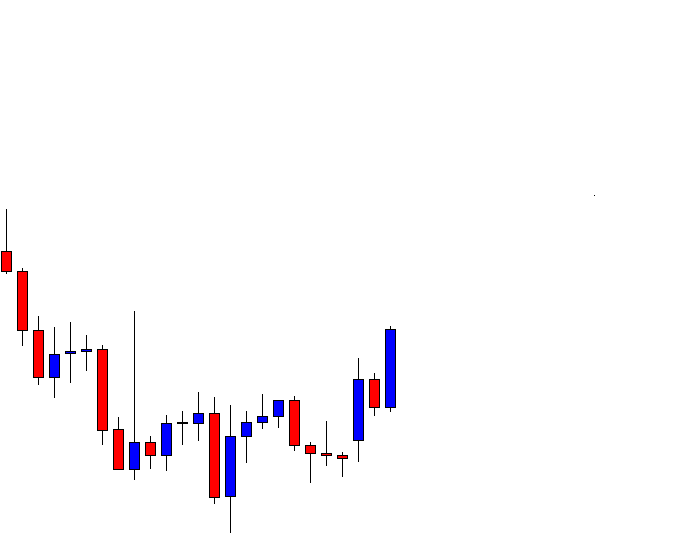
The chart shows that it produces a bullish candle followed by a bearish inside bar. The next candle comes out as a bullish engulfing candle. Do you notice something here? Yes, this is an entry for the buyers. However, this is not where we concentrate today. Let us proceed to the next chart to dig out the main story.

The price keeps going towards the North. The buyers are to wait for the price to consolidate and produce another bullish engulfing candle to offer them entry. The way it has been going, it seems that the buyers hold the key and dominate over the sellers.
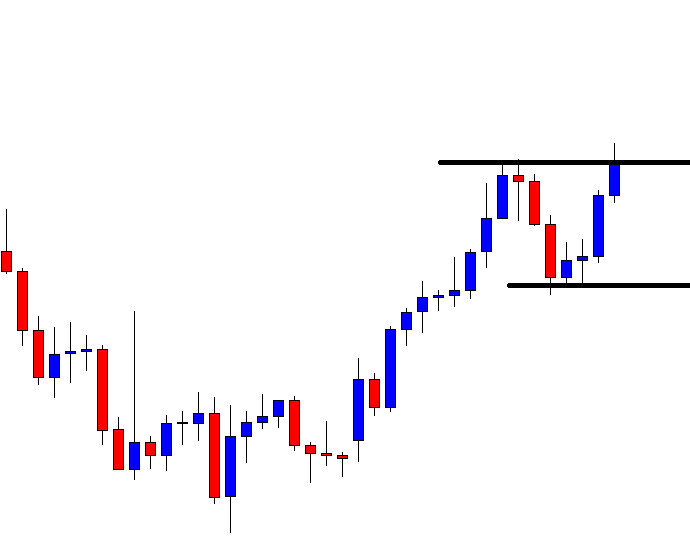
The price makes a bearish correction and finds its support. The first bullish reversal candle comes out as a bullish inside bar. This is not a strong bullish reversal candle. It produces three more bullish candles but the price does not make a breakout at the level of resistance. The last candle closes within the level of resistance, which is a point to be noticed. It means even the next candle makes a breakout, it would be a breakout right from the level of resistance.

The next candle closes well above the level of resistance. This is a breakout but not the kind of breakout that the breakout buyers wait for. The price is trending towards the upside; it consolidates and makes a bullish breakout. These three equations suggest that the buyers may take a long entry. They must not forget that the breakout candle does not make an explicit breakout. If a breakout takes place by one bullish engulfing candle that brings momentum. Over here, it needs four candles to make the breakout. Moreover, the breakout candle forms right at the level of resistance (now support). The buyers may restrain themselves from taking such entry. Let us find out what the price does next.
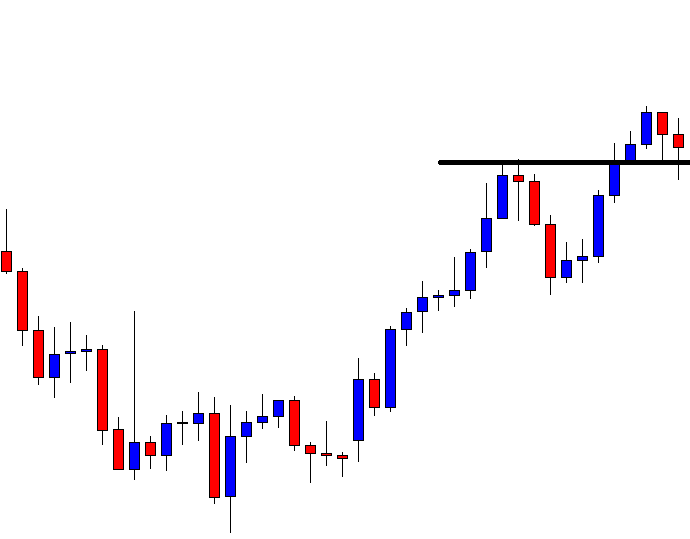
The price comes back to the breakout level. This is what usually happens when the price does not make a breakout with an A+ breakout candle. The price may still head towards the North, but 1 out of 3 times, it may come back in and hits the stop loss. Thus, to have winning consistency, we might as well skip taking entry in such price action.