Introduction
When you can see the momentum of the market slowing down, you can soon expect a reversal breakout in any underlying currency pair. Knowing this info will boost your confidence to pull the trigger, and to scale your positions without any hesitation. Conversely, to trade the trend continuation breakout, knowing the strength of the breakout is also crucial.
In this course lesson, we will learn how to measure the breakout’s strength and take appropriate action according to the information which the market represents.
Using The MACD Indicator To Measure The Momentum
MACD is one of the most common momentum indicators in the Forex market. There are many different ways to use the MACD indicator, and in our case, we suggest you look at the histograms of the indicator to gauge the market strength. As the price moves, if the histograms get bigger, it is indicating that the market momentum is increasing. In this case, we can expect a breakout in the direction of the trend. Conversely, if the histogram gets smaller, it means the momentum is getting weaker, and we can soon expect a reversal in the currency pair.
Buy Example
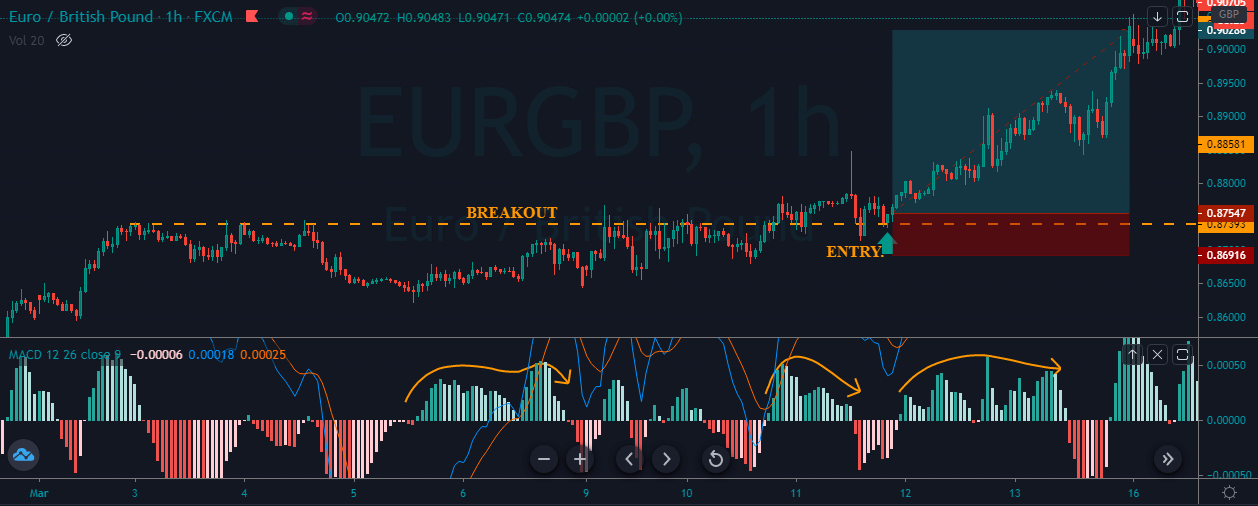
The image below represents a buy trade in the EUR/GBP Forex pair.
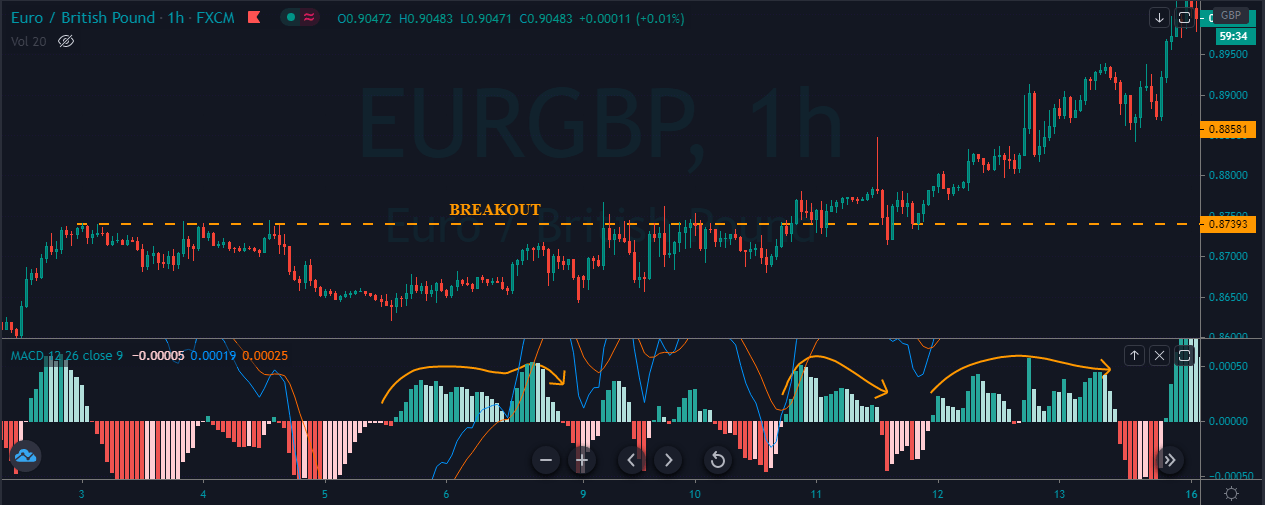
Please observe the first arrow in the MACD histogram. The upsurge lines indicate the strong trend in this Forex pair. When the price action goes above the breakout line with the rising histogram bars, it is a sign of a strong breakout. After the breakout, we took a buy-entry, and the pair printed a brand new higher high.
Sell Example
The image below indicates a sell trade in the CHF/JPY Forex pair.
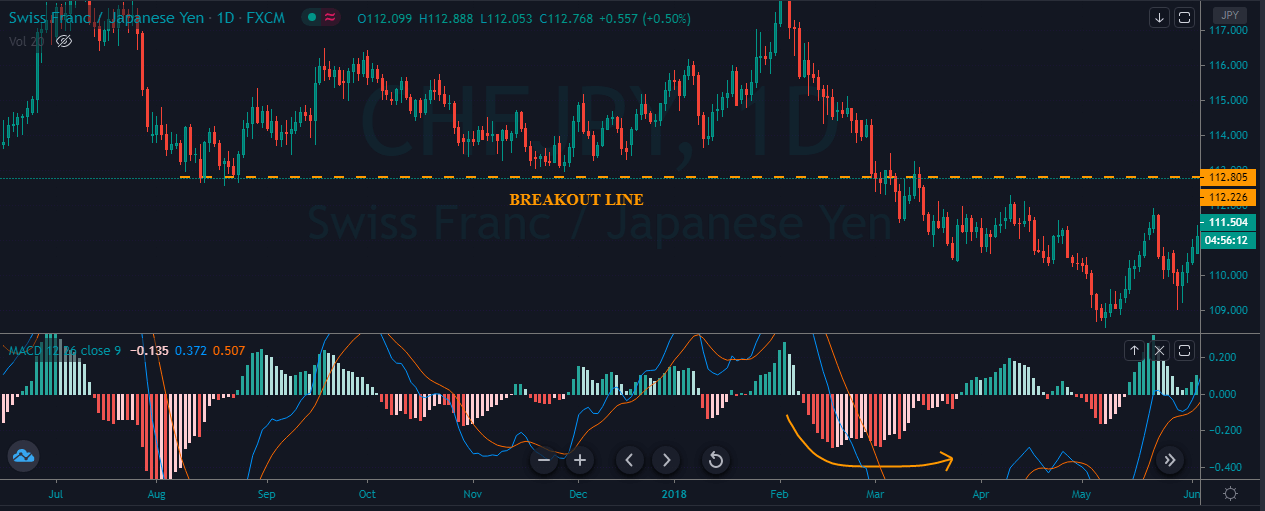
The image below represents the entry, exit, and stop-loss placements. The price action breaks below the significant level with the rising histogram lines. This shows the sellers are real, and they are ready to make a brand new lower low. After our entry, prices went down, making a brand new lower low. Therefore, when the breakout indicates strong strength, we must go for smaller stops and hunt significant returns.

Using The RSI Indicator To Measure Market’s Strenght
RSI stands for Relative Strength Index, and it is a popular indicator which oscillates between the 0 to 100 levels. When the indicator reaches the 70 levels, it means the market is overbought, and a reversal is expected. When it reaches the 30 levels, it means the market is oversold, and an upside reversal is expected.
In this article, we are not going to use the RSI indicator, like how it is typically used. Instead, we will use the RSI divergence to measure the strength of the trend. A divergence is when the price moves in one direction, and the indicator moves in another. Divergence shows that the indicator is not satisfied with the price action, so in this case, a reversal should be expected.
Buy Entry
- Find out the divergence in a downtrend.
- Wait for the price action to break above the significant resistance level.
- Wait for the hold above the breakout level to confirm the breakout.
- Hit Buy.
- Place the stop-loss below the breakout.
- Go for brand new higher high.
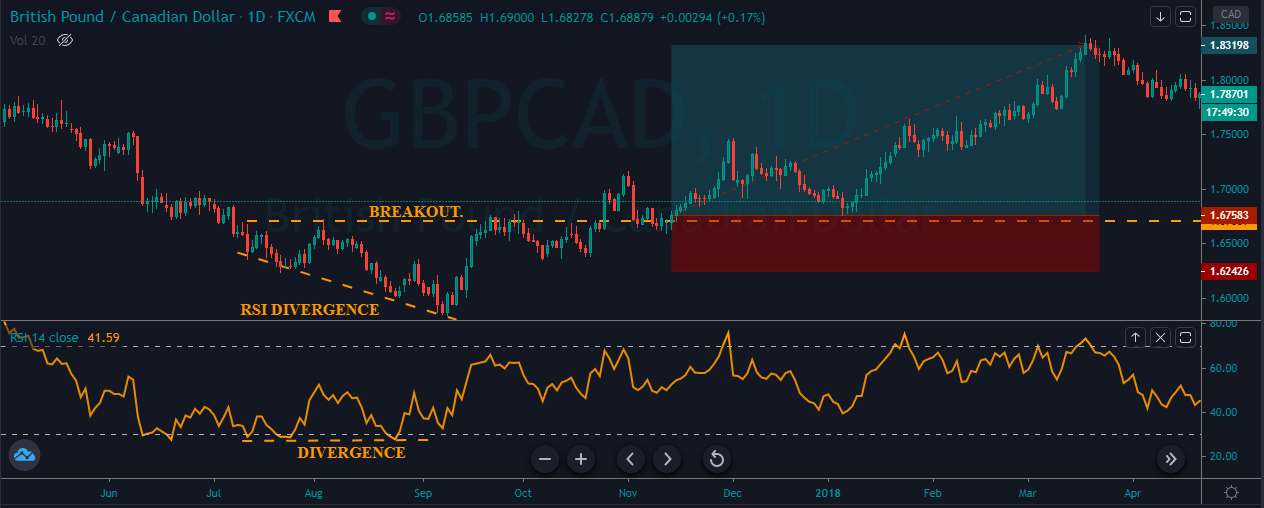
The image below indicates the buying trade in the GBP/CAD Forex pair.
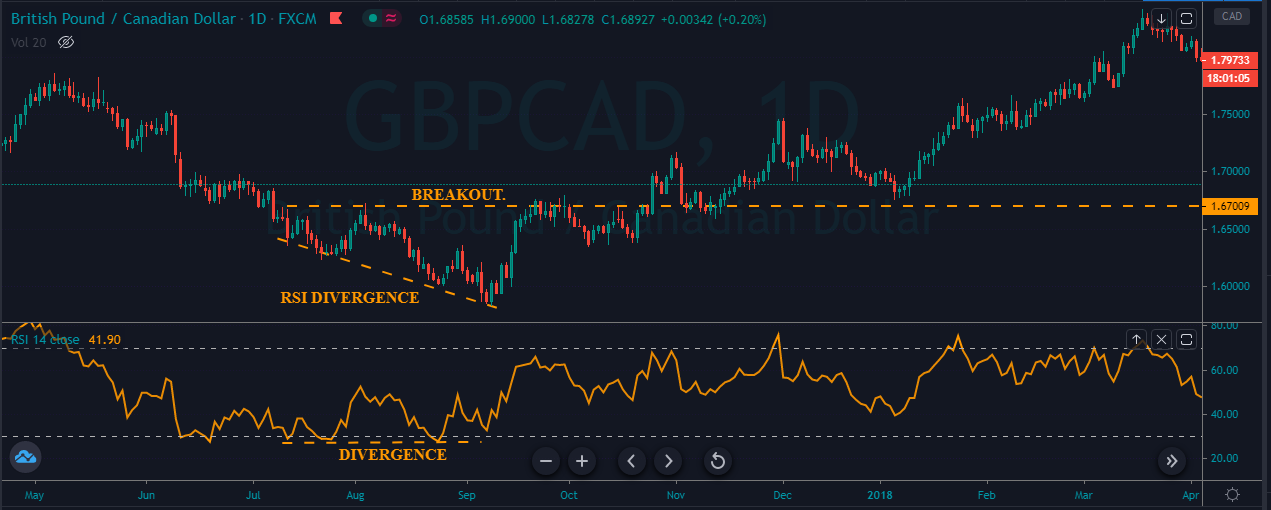
The image below represents our entry, stop loss, and take profit in this Forex pair. As you can see, the trend was down, but on the other hand, the RSI indicator failed to make the higher high. This indicates that the buyers are strong, and after any breakout, we can confidently go long.
Sell Entry
- Find out the divergence in an uptrend.
- Wait for the price action to break below the significant support level.
- Wait for the hold below the breakout level to confirm the breakout.
- Hit sell.
- Place the stop loss above the breakout.
- Go for a brand new lower low.
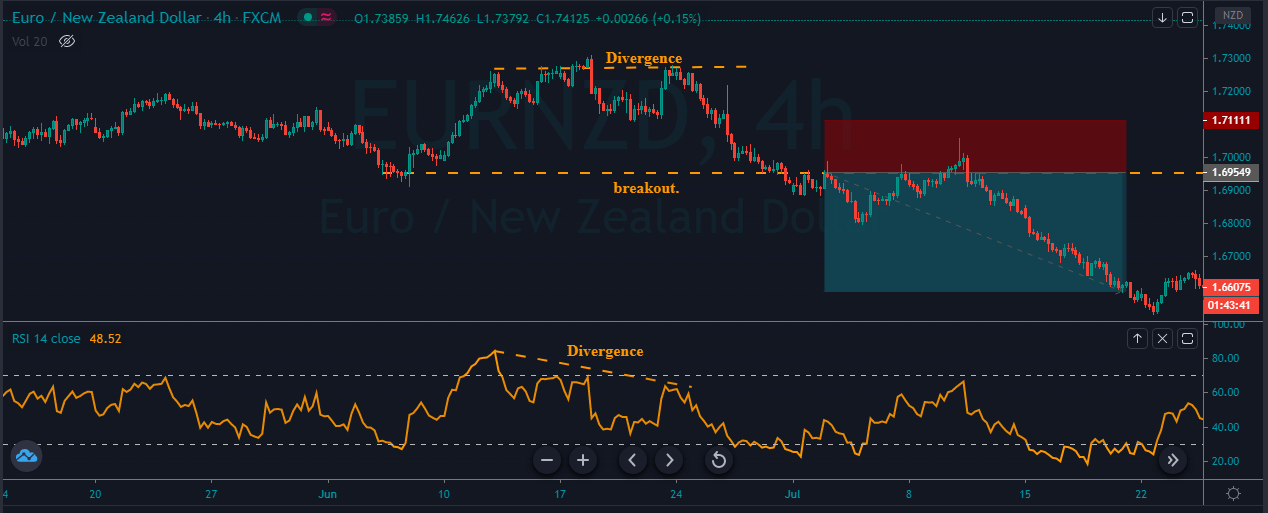
The image below represents the selling trade in this Forex pair.
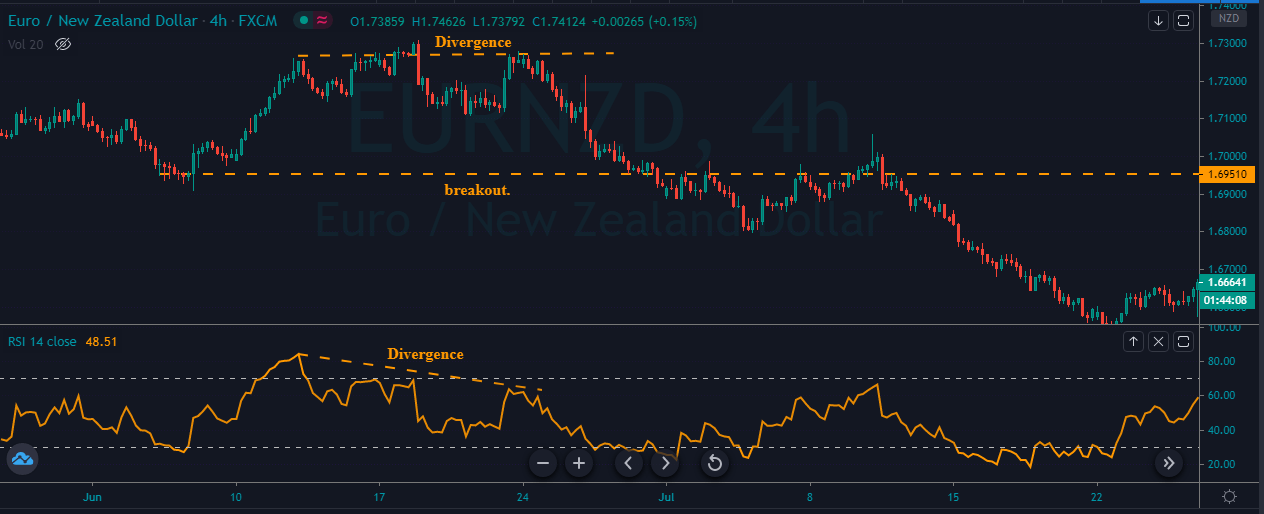
As you can see, when the price action and indicator gave the divergence, it means the indicator didn’t like the upward spiral anymore. Also, the buyers are exhausted, and we can expect a strong downward reversal. Soon after the breakout, we took short entry and exited our position when printing the brand new lower low.