Categories
Forex Basics

Importance of Timing in Trading

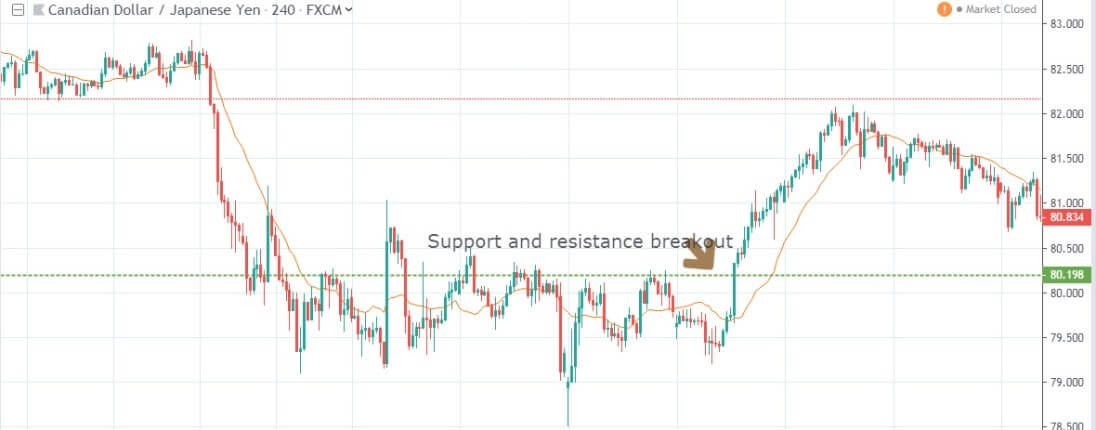
Timing is an essential factor in trading. Price action traders take entry on signal candle’s/bar’s attributes and support/resistance breakout. Many traders ignore the timing factor. However, it is an important factor when the signal candle is produced. In this article, we are going to demonstrate an example of the importance of timing in trading.

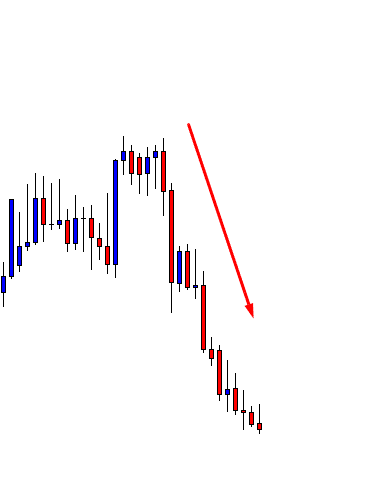
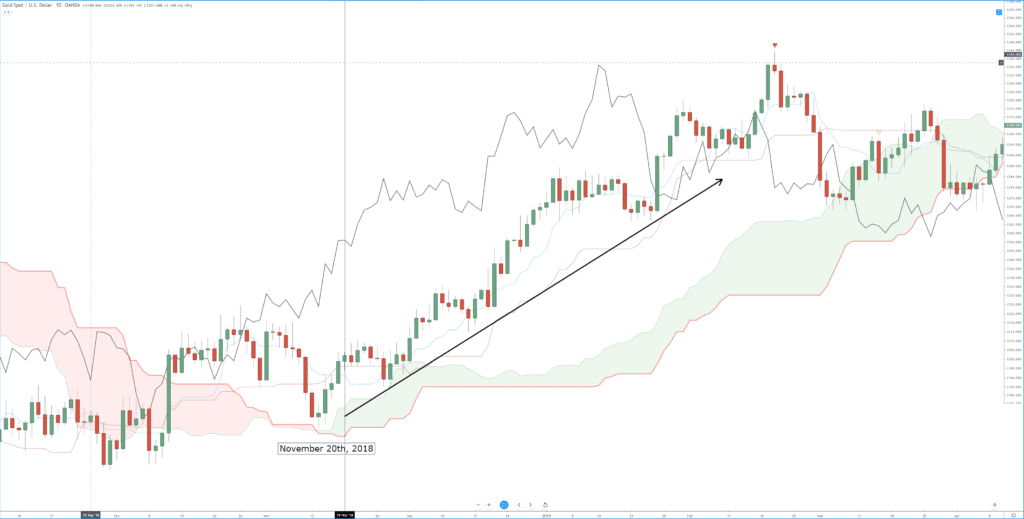
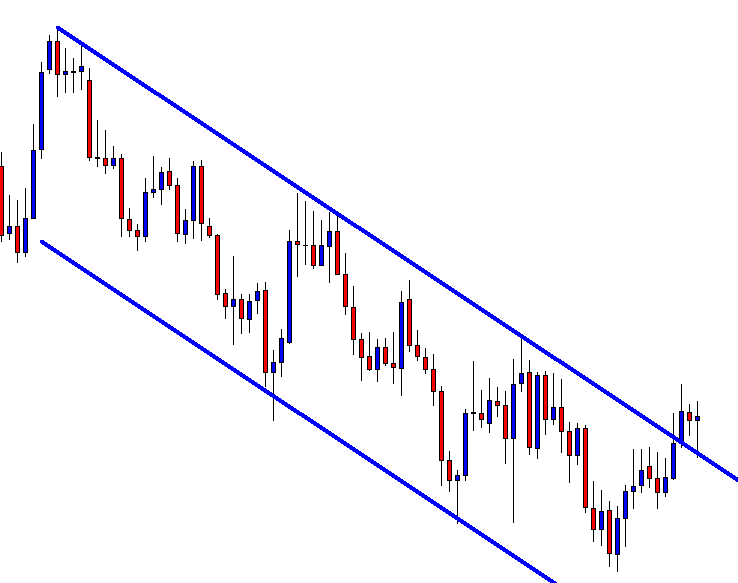
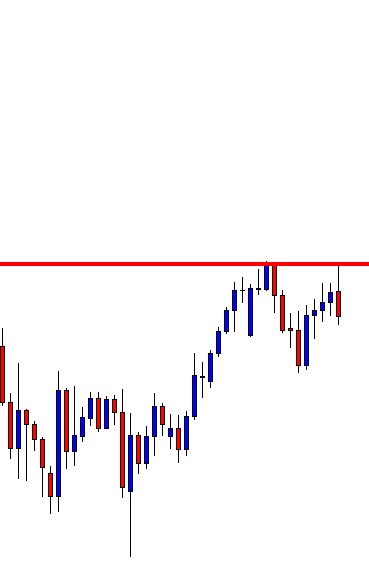
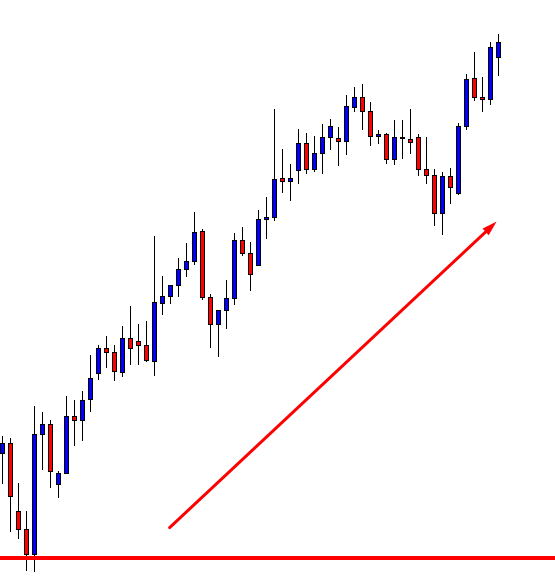
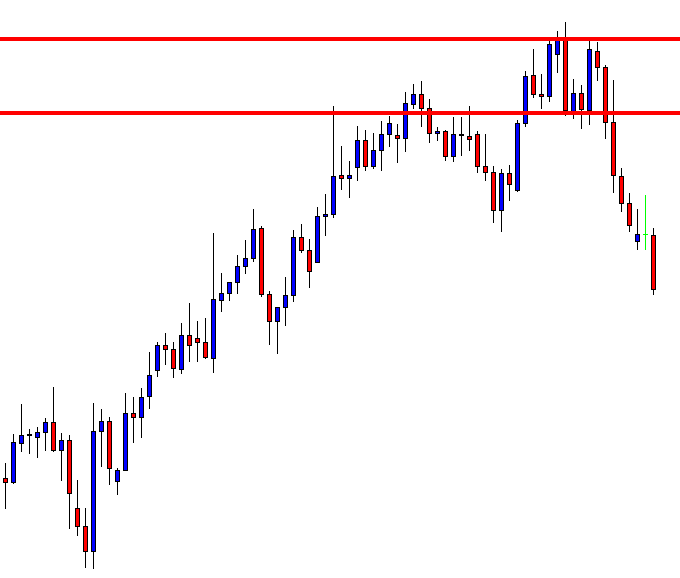
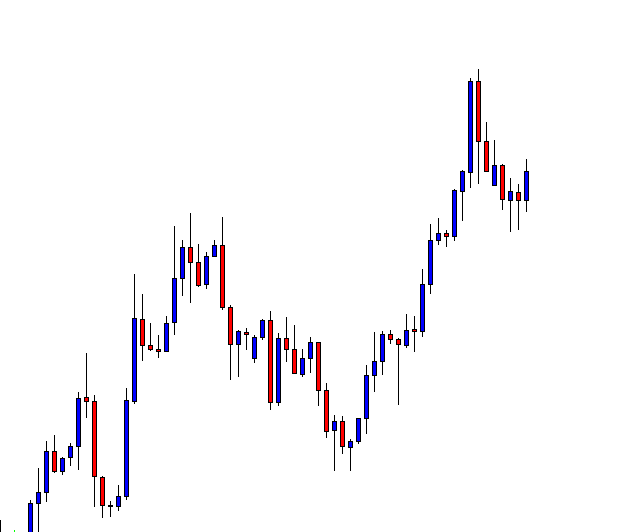
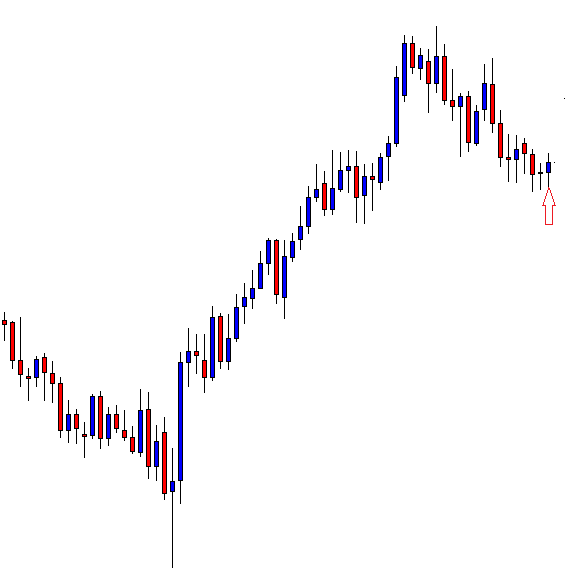
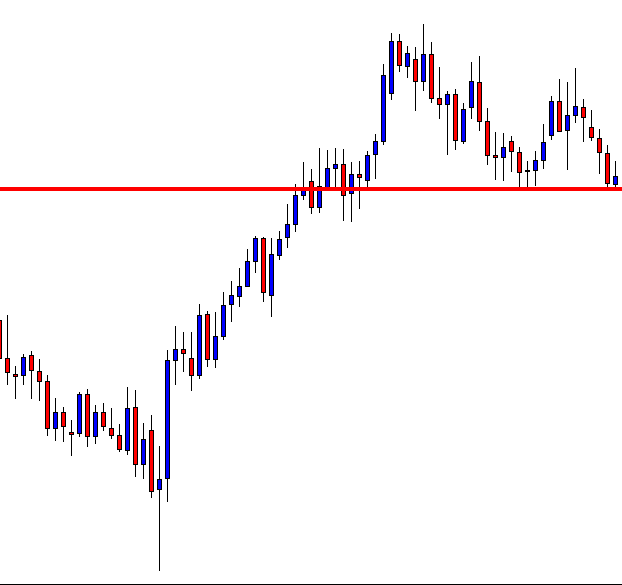
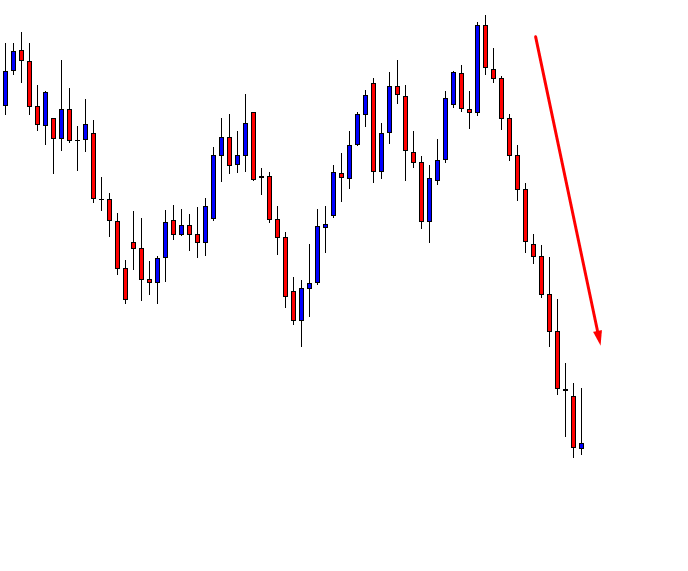
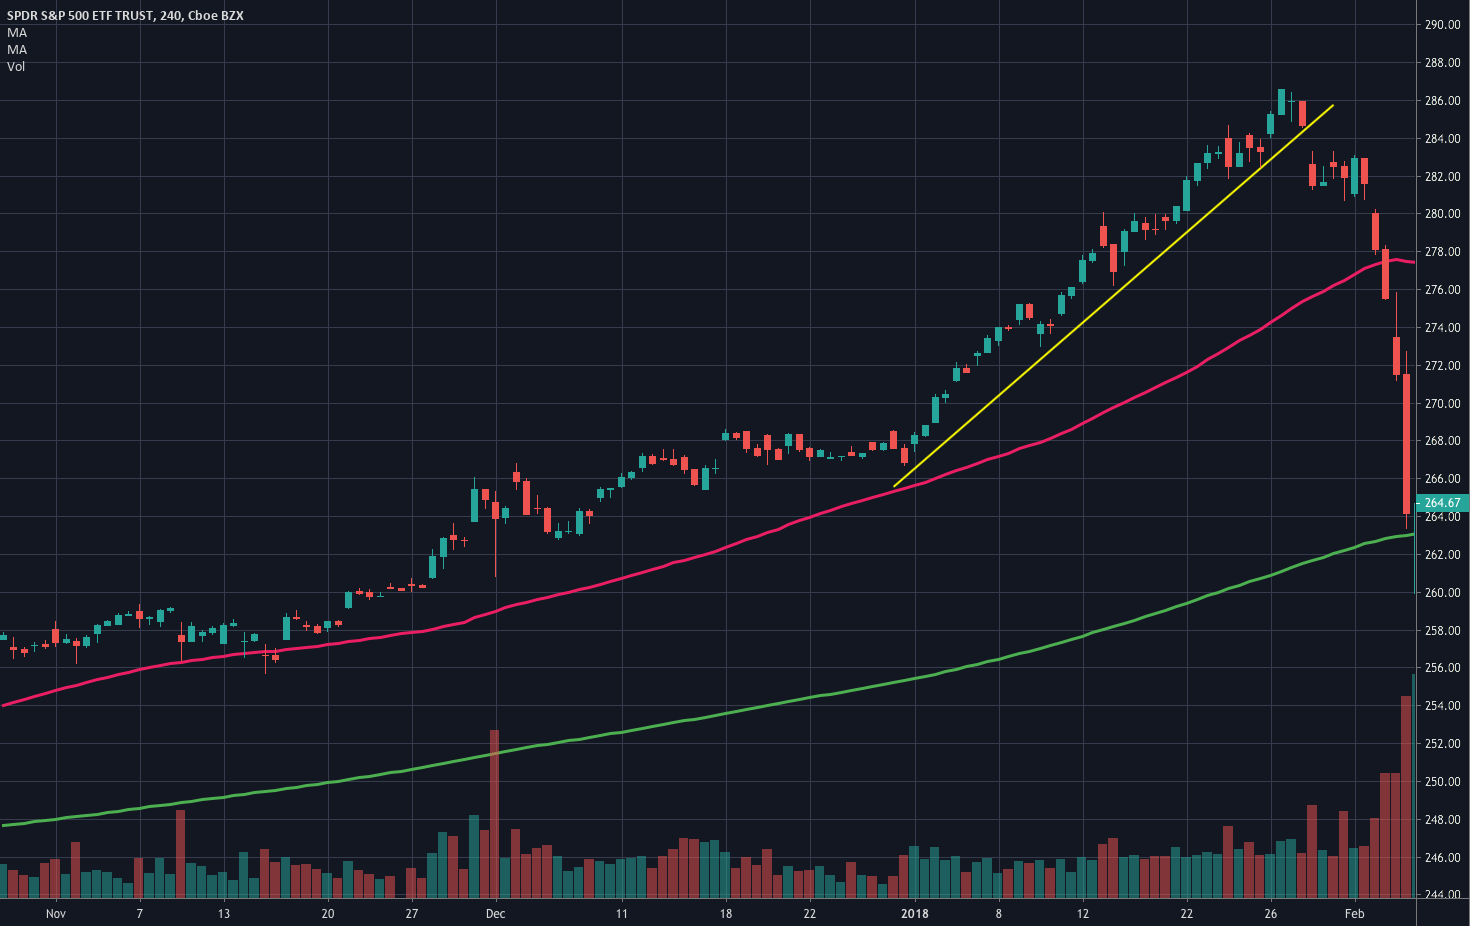
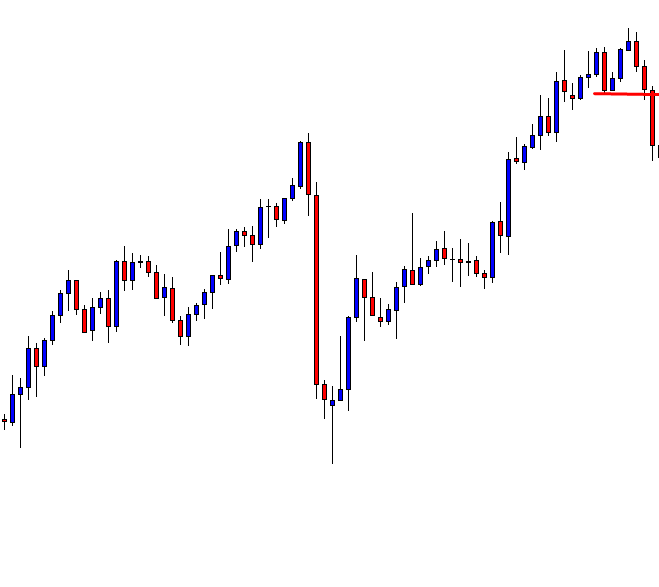
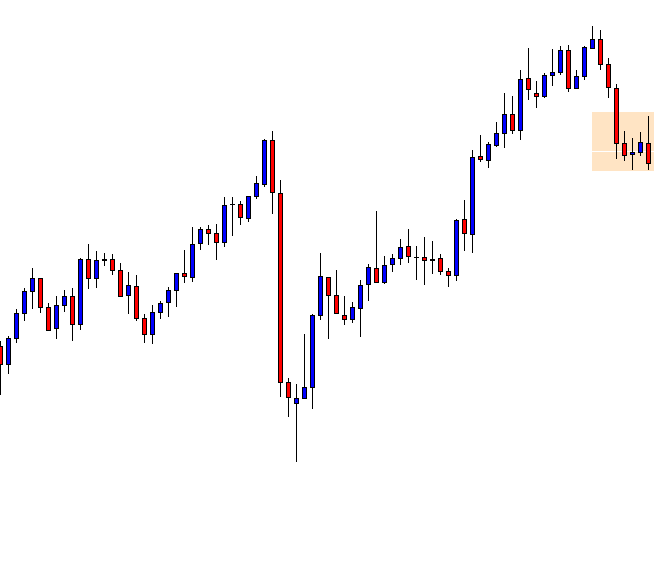
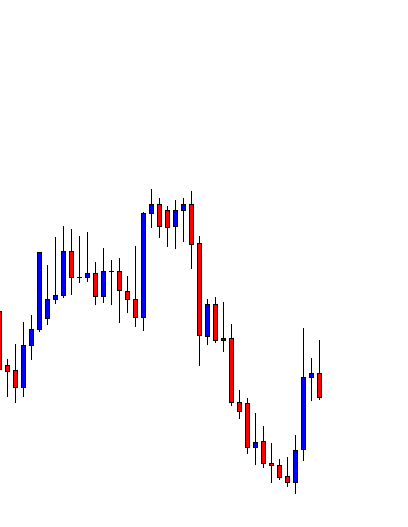
This is a daily chart. The price keeps going towards the South. Traders shall only look for selling opportunities in this chart on upward price correction/consolidation. Let us go to the next chart and find out what happens next.

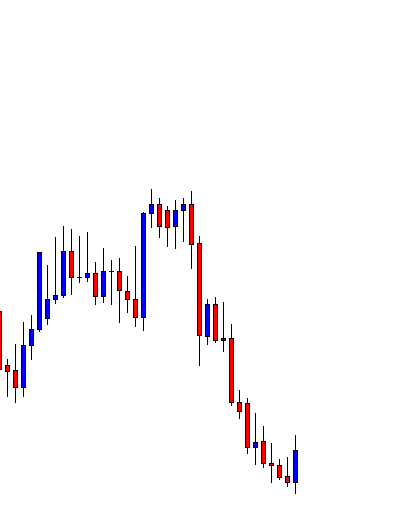
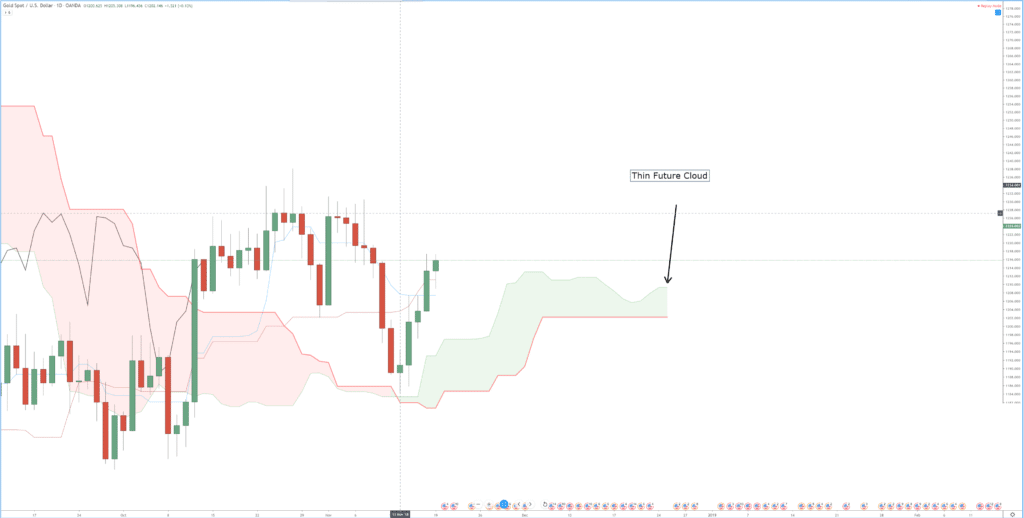
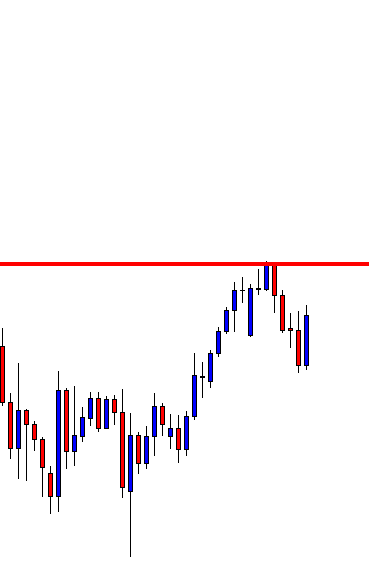
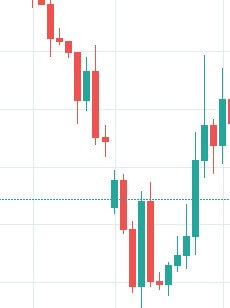
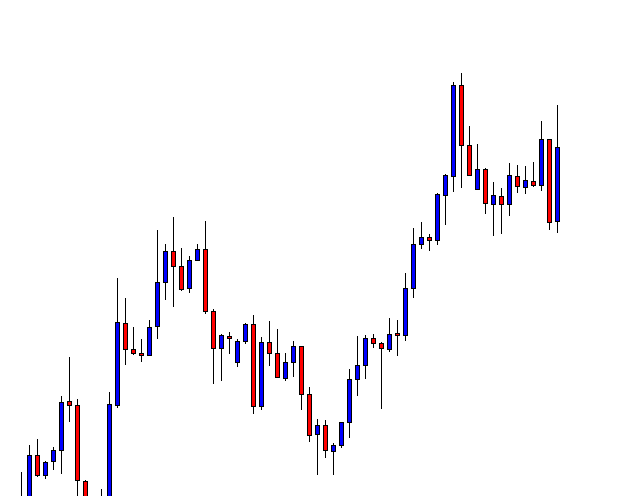
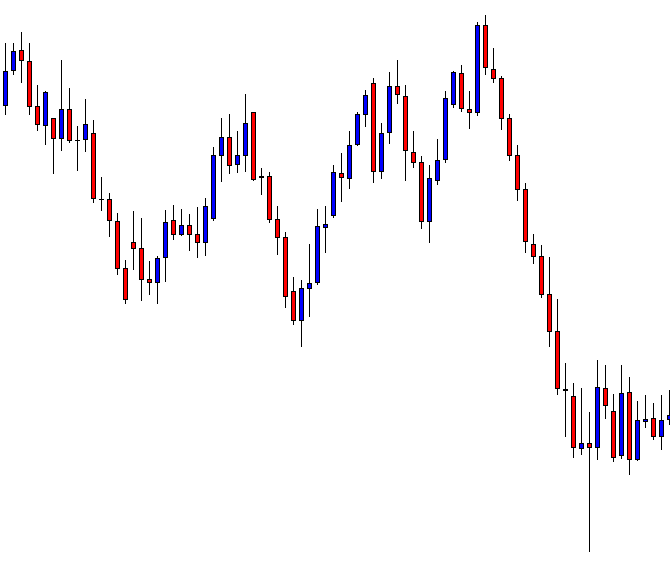
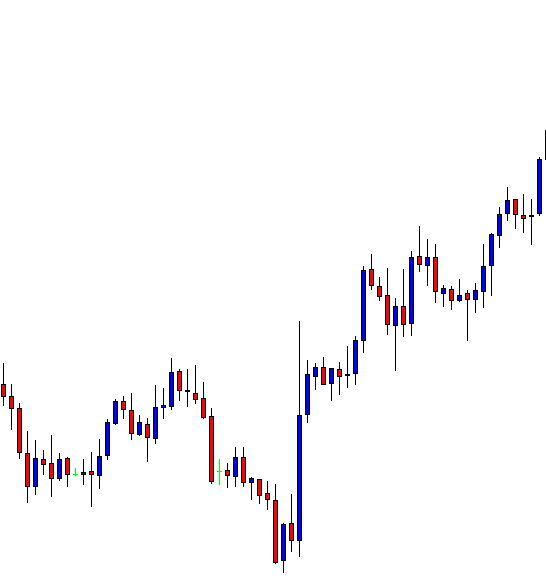
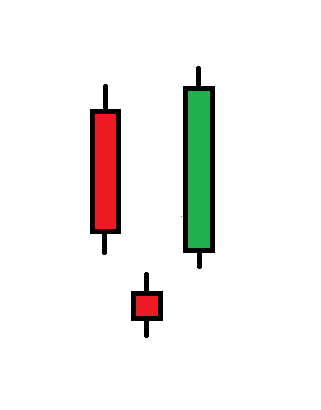
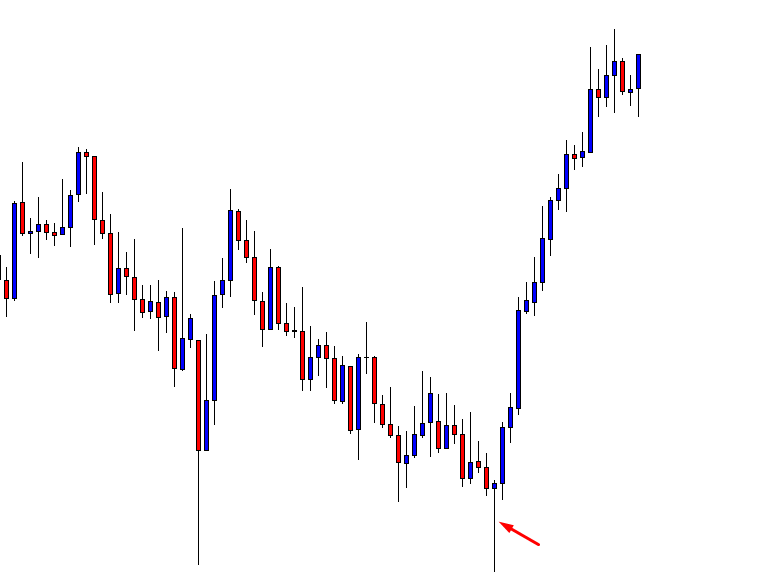
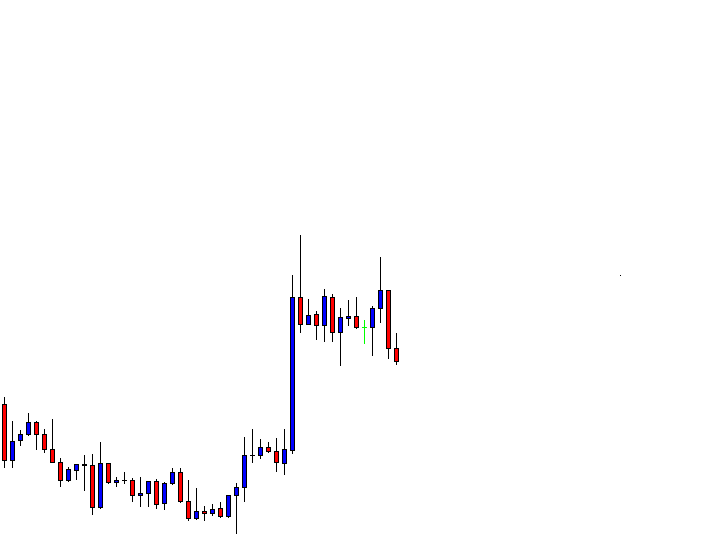
The chart produces an engulfing bullish candle. It is a sign that the price may go towards the North. Intraday buyers such as 5M, 15M, H1 traders may look for long opportunities in this chart. The daily chart traders must wait for the correction/consolidation to get over upon a daily bearish reversal candle.

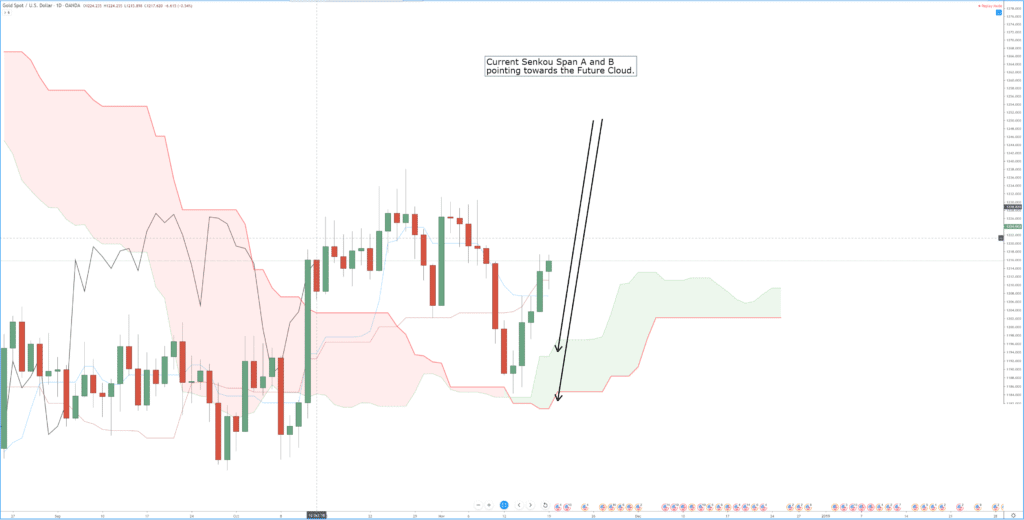
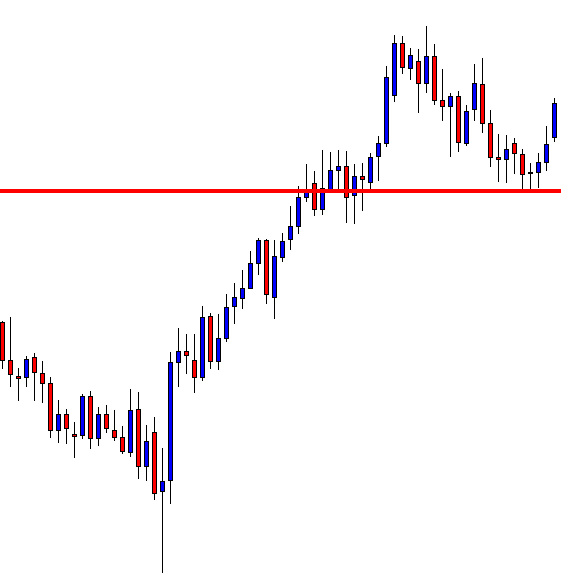
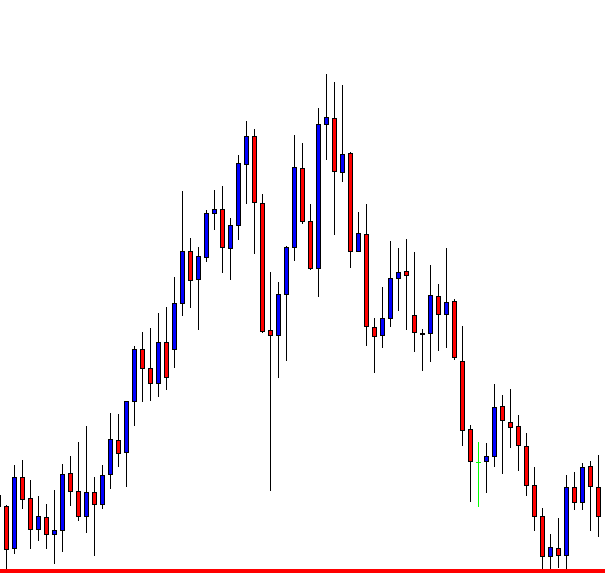
The price heads towards the North with good bullish momentum. The intraday buyers have made full use of the engulfing candle here. However, upper shadow and an Inside Bar suggest that a bearish reversal may come soon.

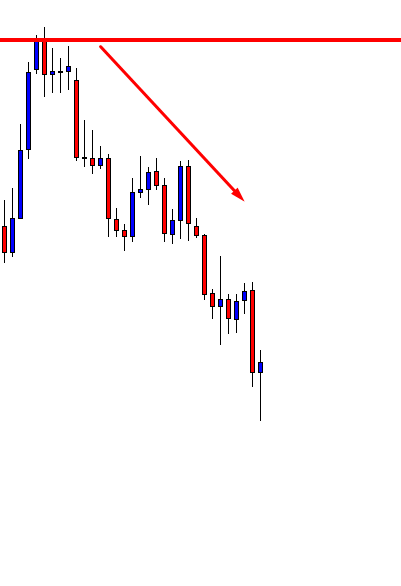
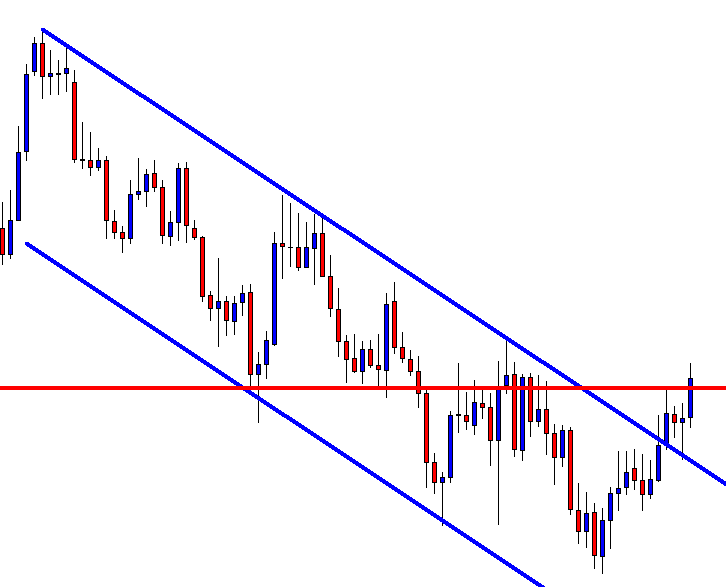
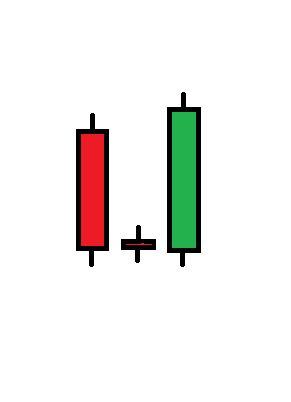
Here it is. A bearish engulfing candle suggests that it is time to look for short opportunities. It is a daily chart, so we shall flip over to the H4 chart to look for short opportunities.

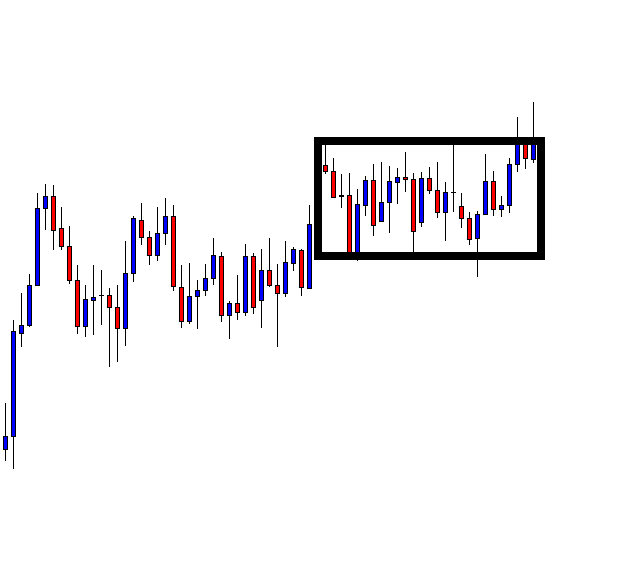
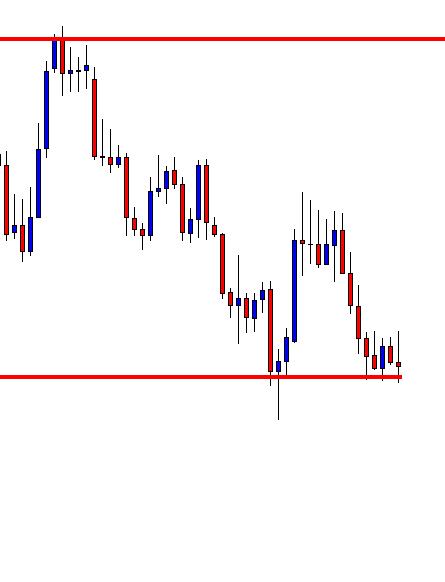
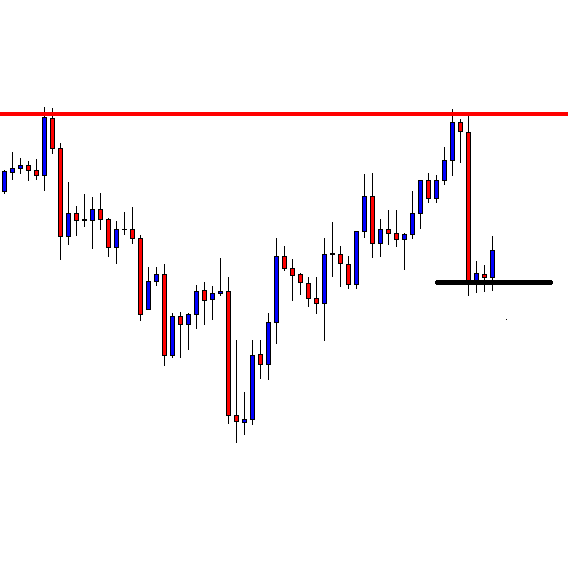
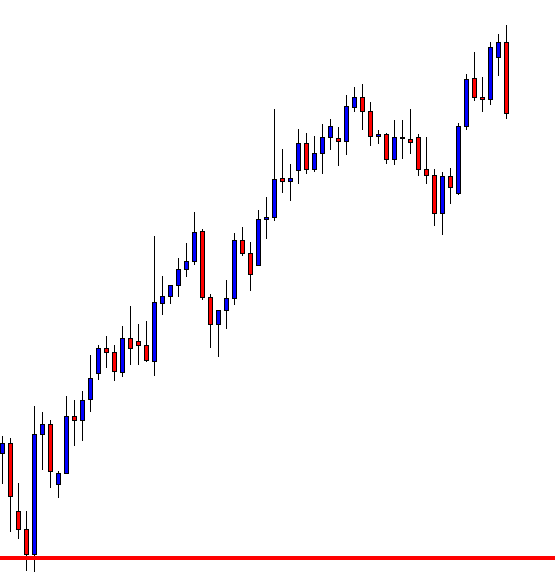
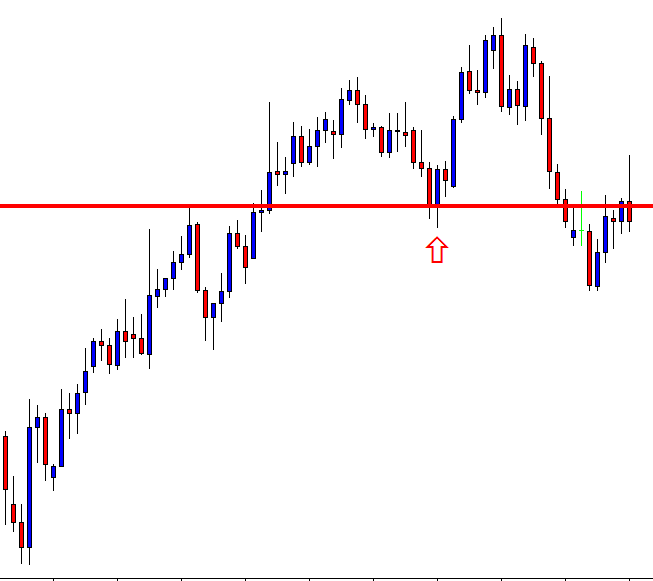
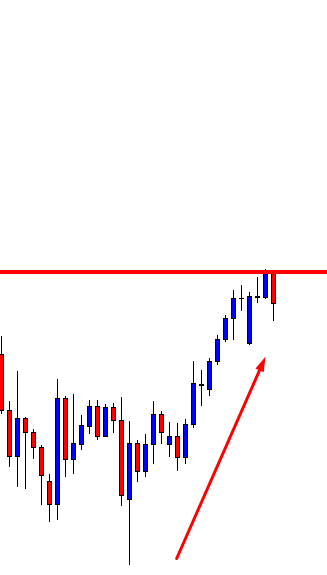
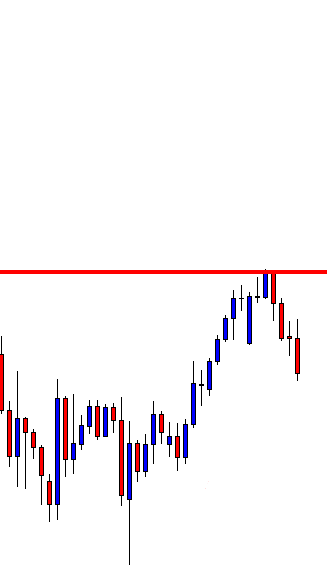
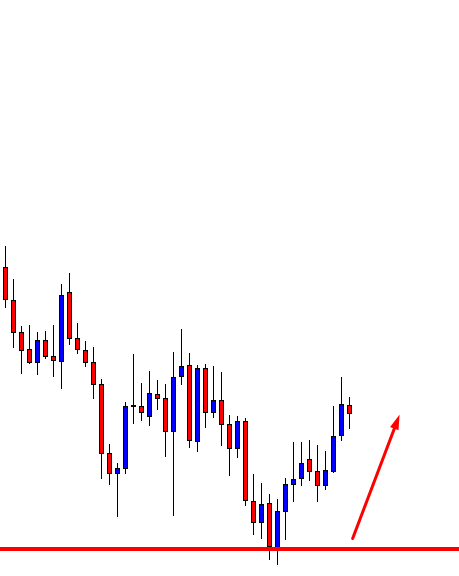
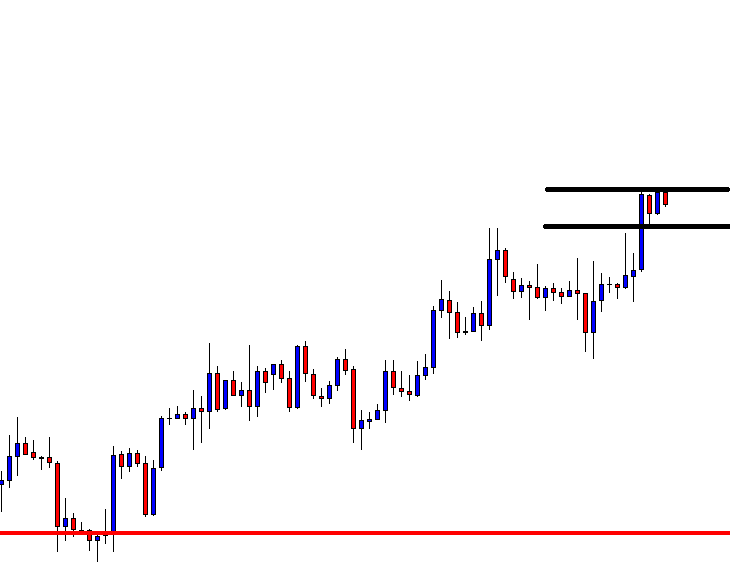
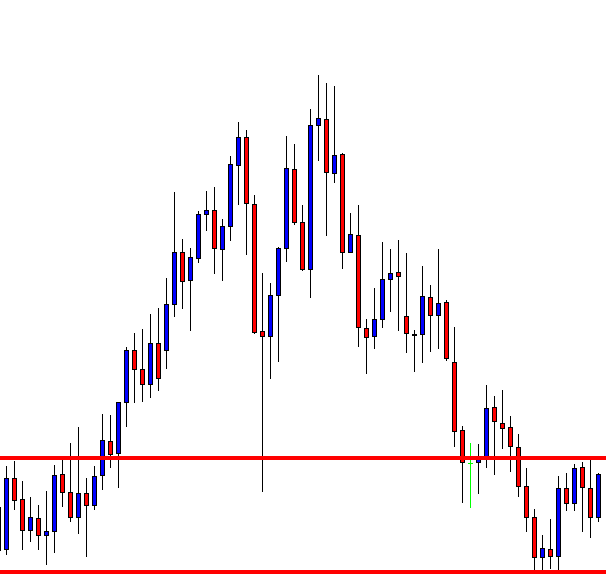
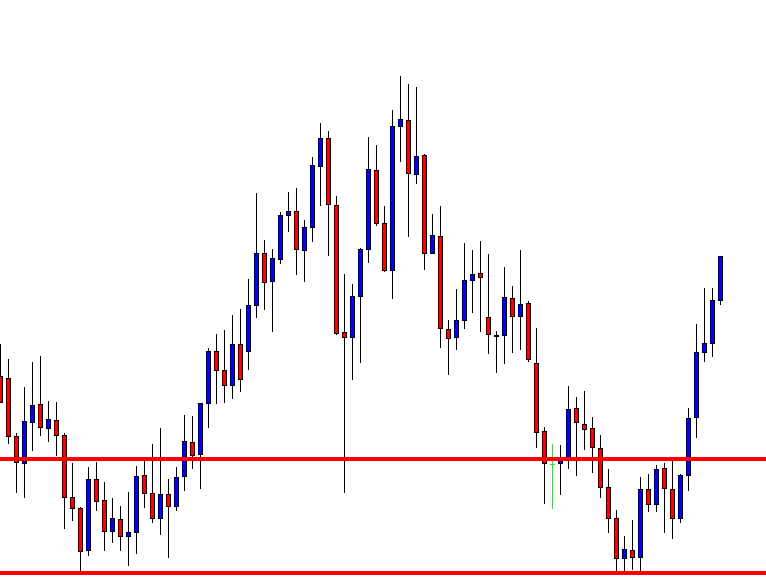
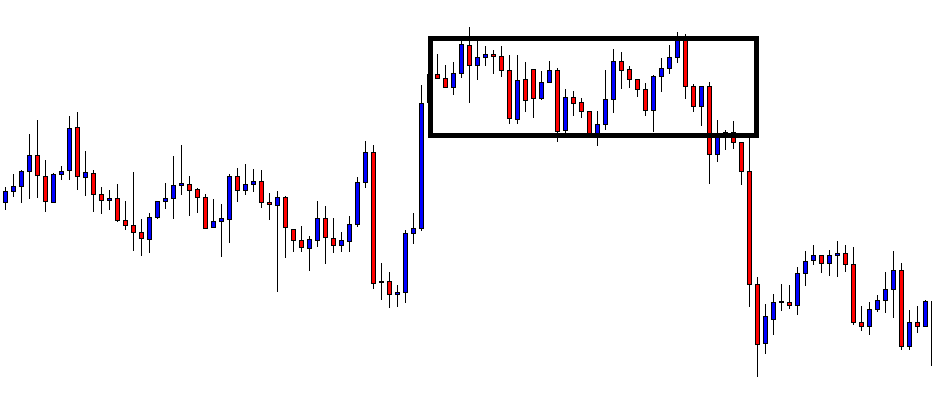
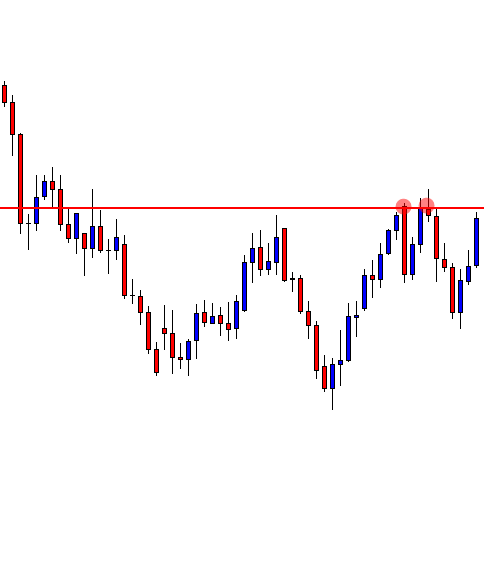
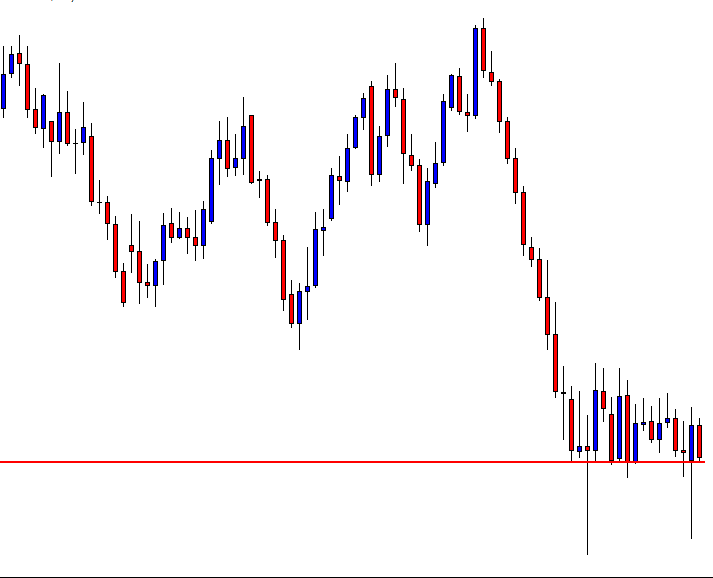
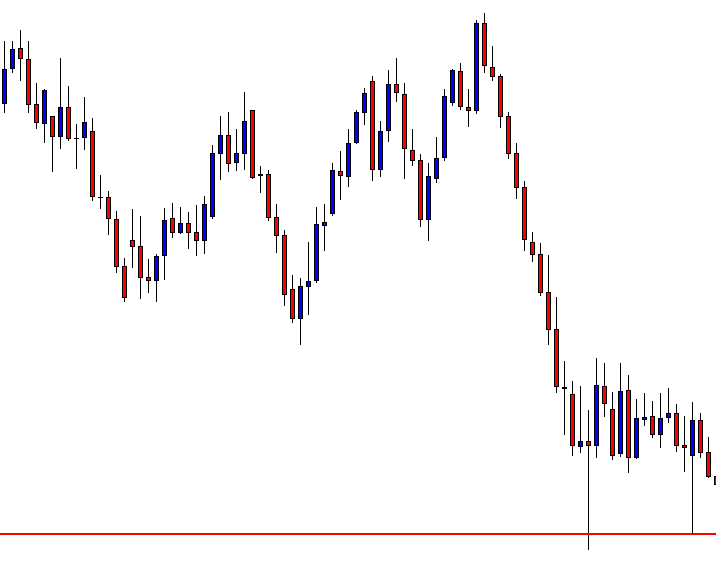
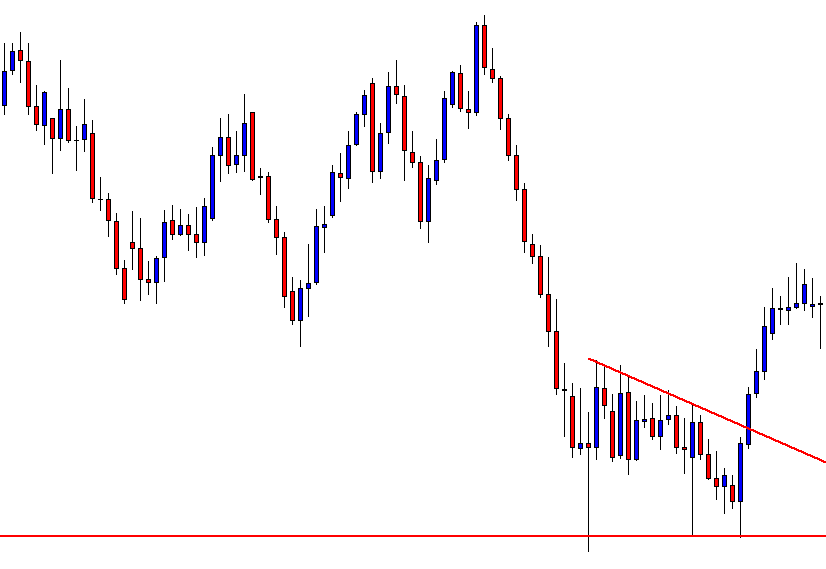
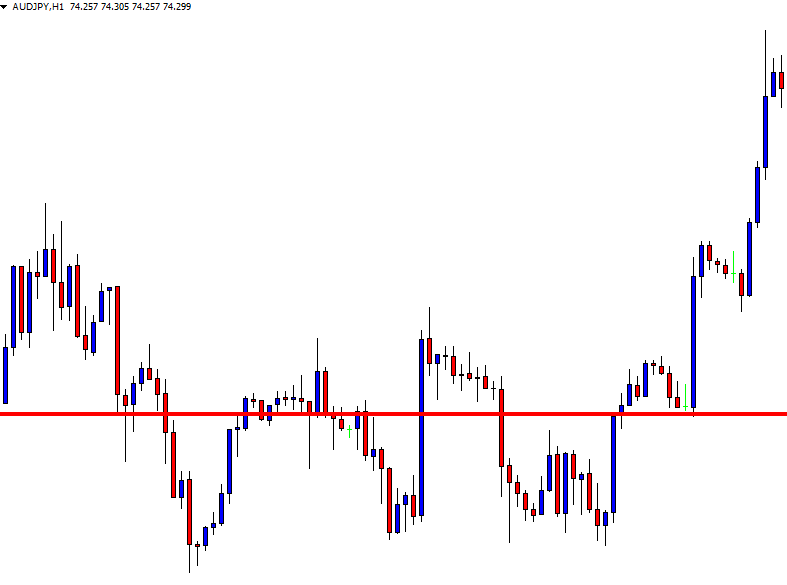
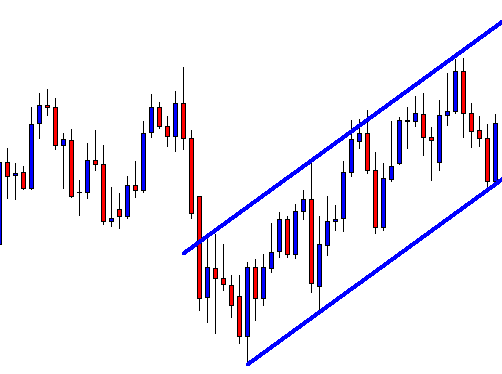
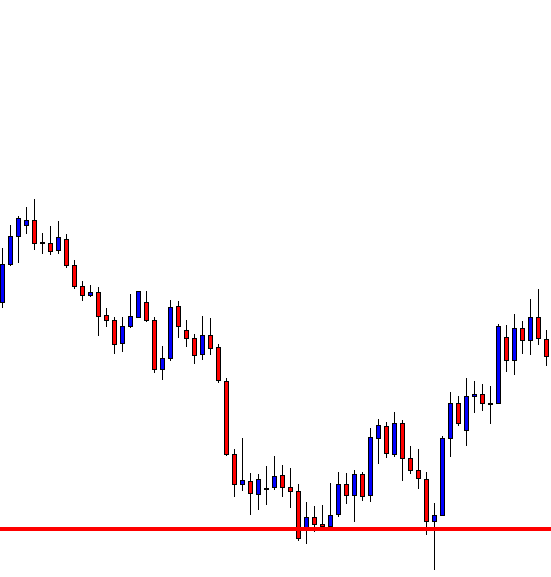
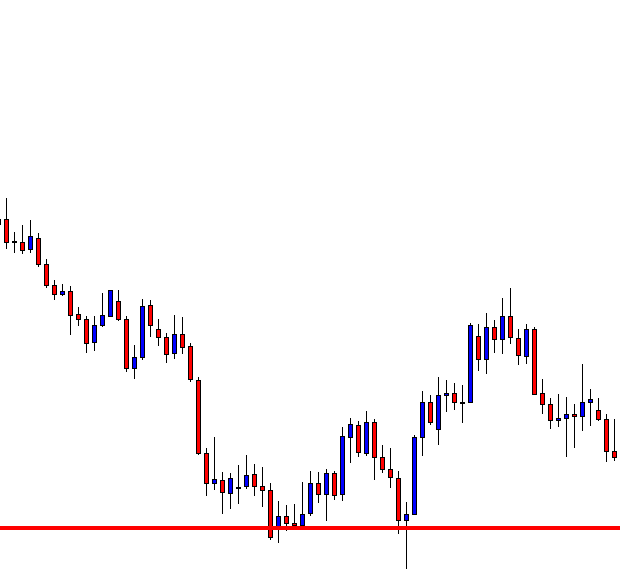
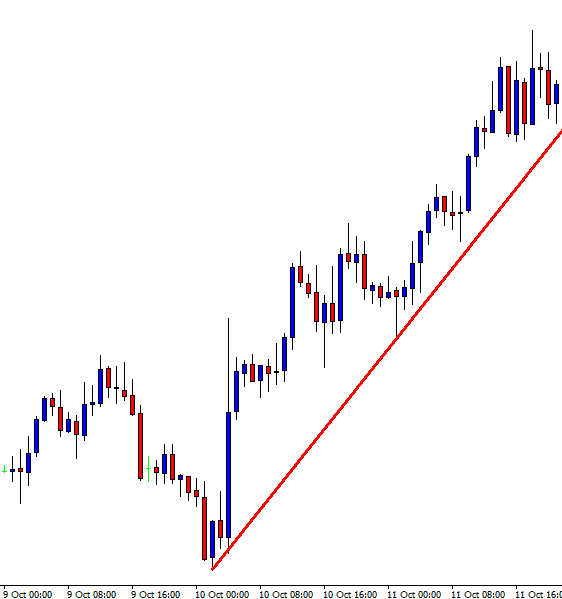
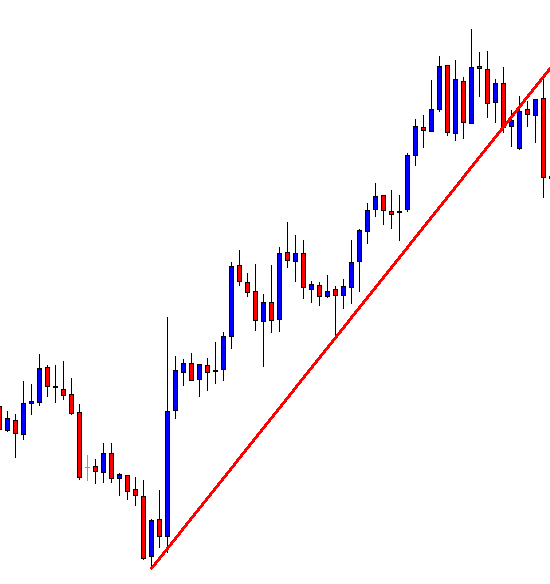
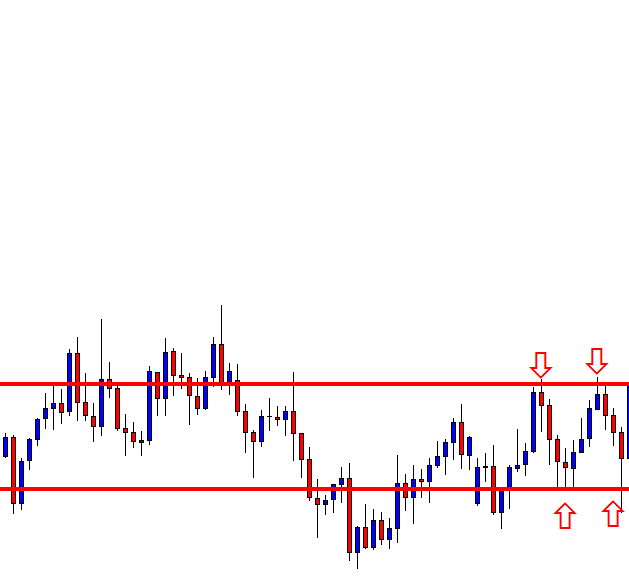
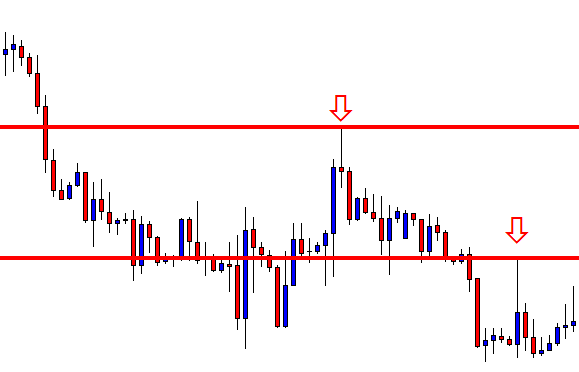
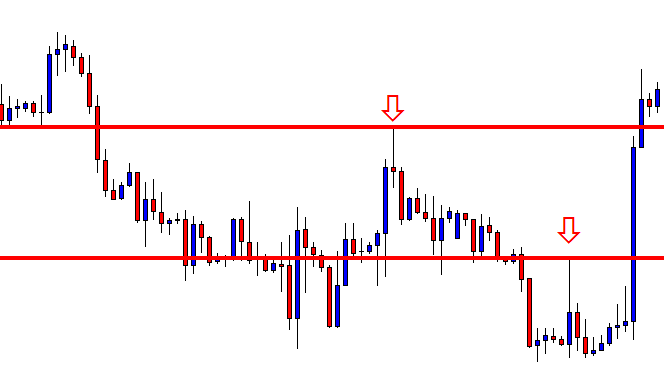
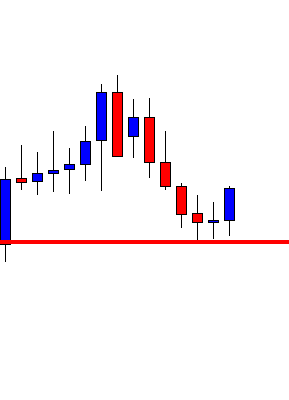
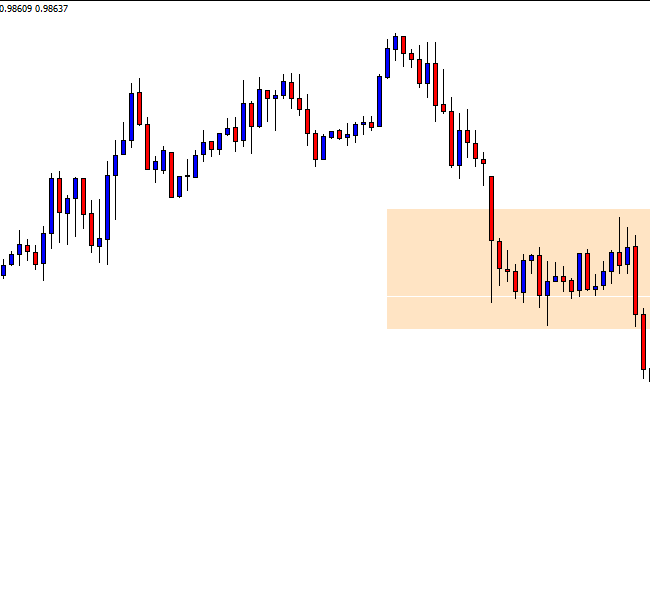
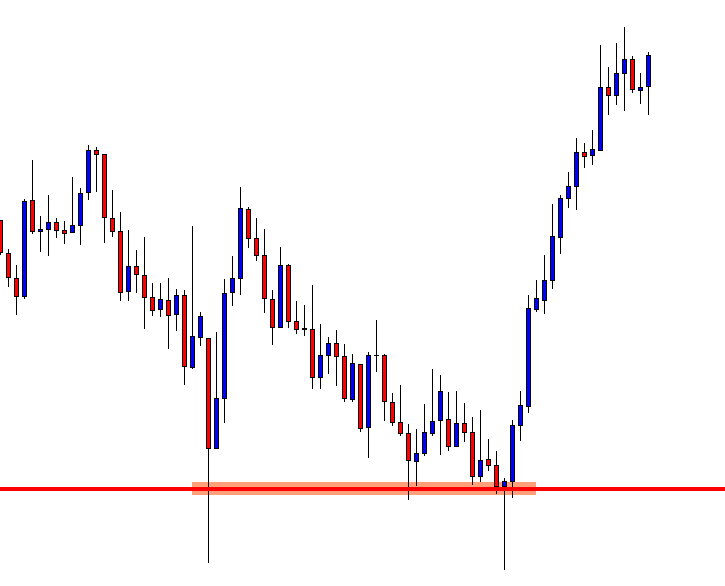
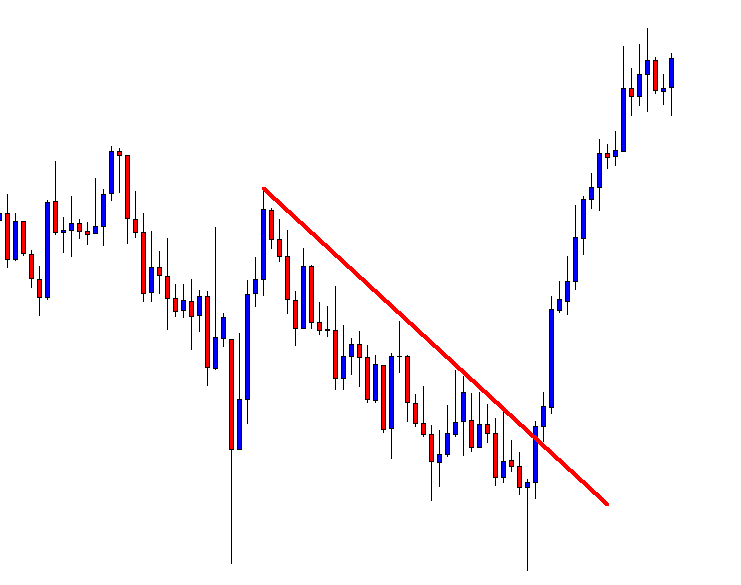
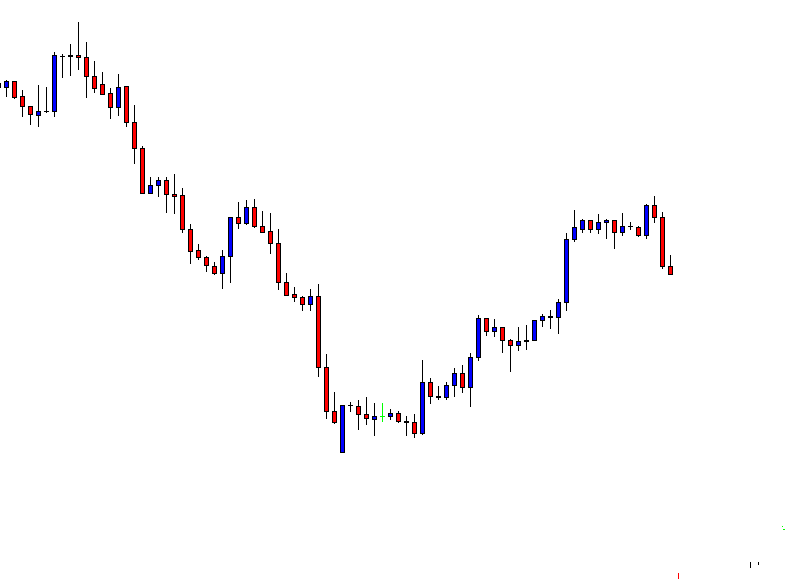
The H4 chart shows that the price consolidates and makes a bearish move. However, support is still intact. The sellers must wait for a breakout at the support to go short on this chart. Let us draw the support line on the chart.

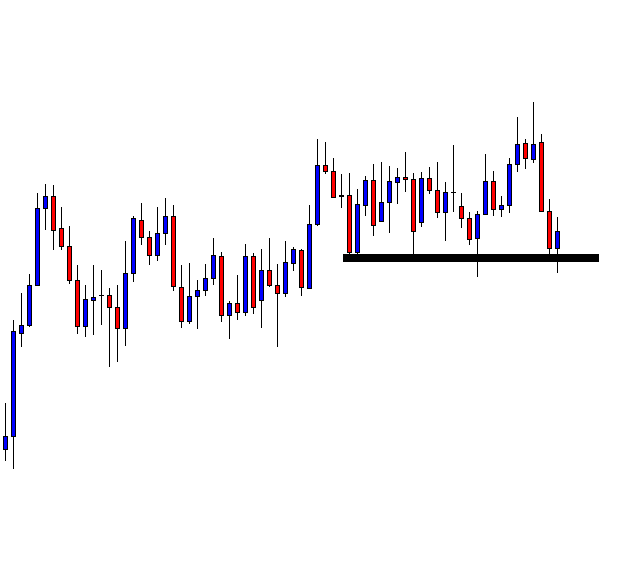
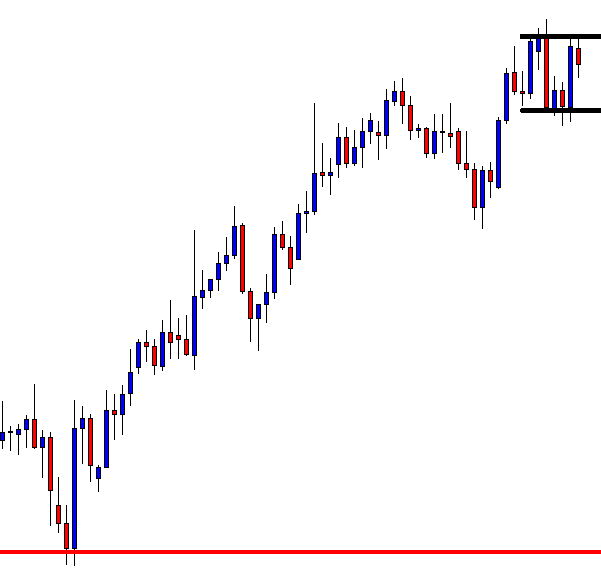
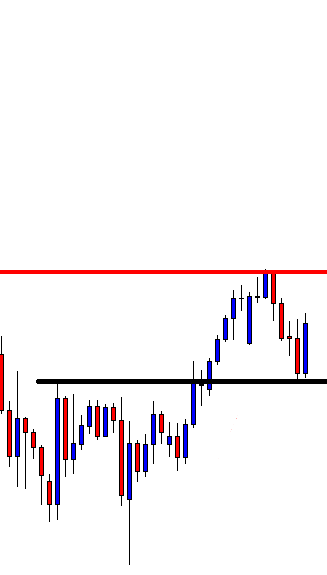
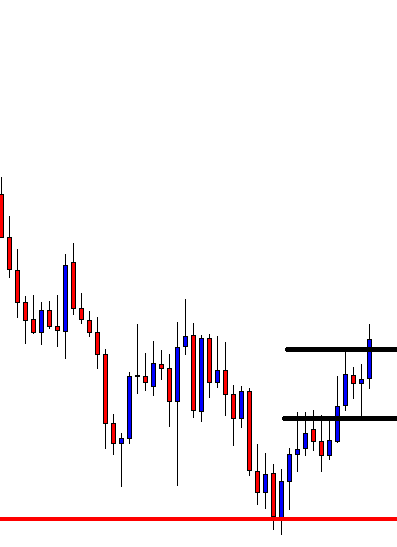
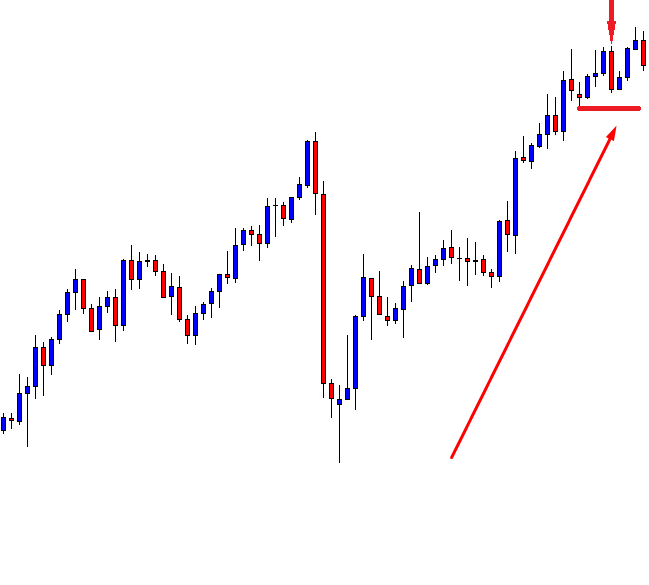
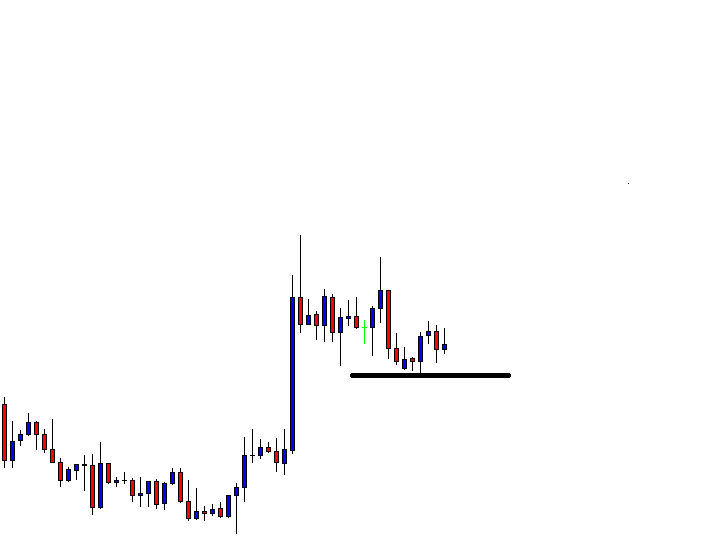
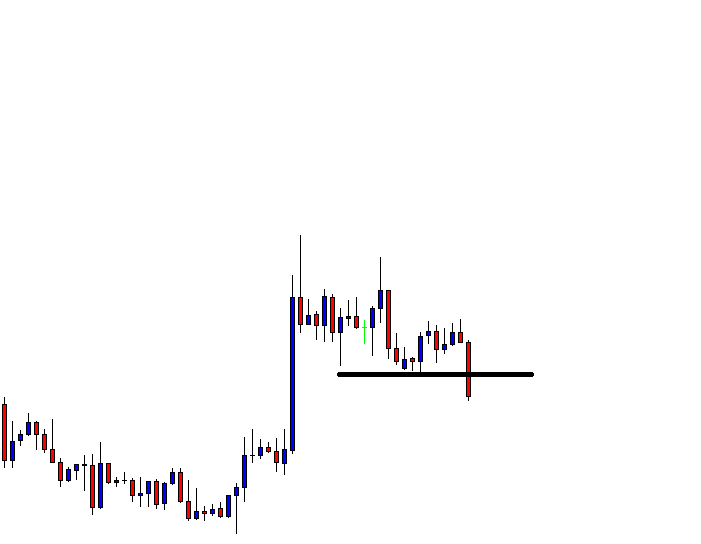
With an upward adjustment, the support lies at the black marked level. One of the H4 bearish candles is to breach the level for the sellers to get engaged in selling. Let us proceed to the next chart.

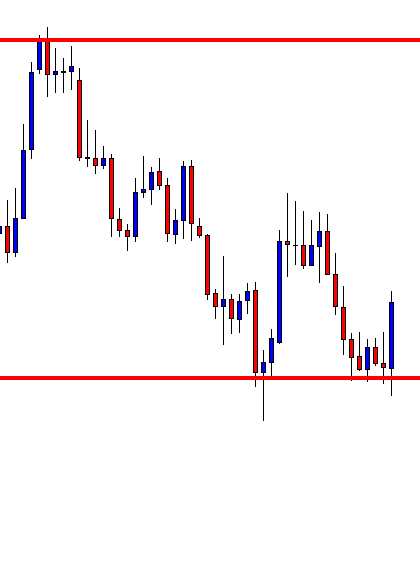
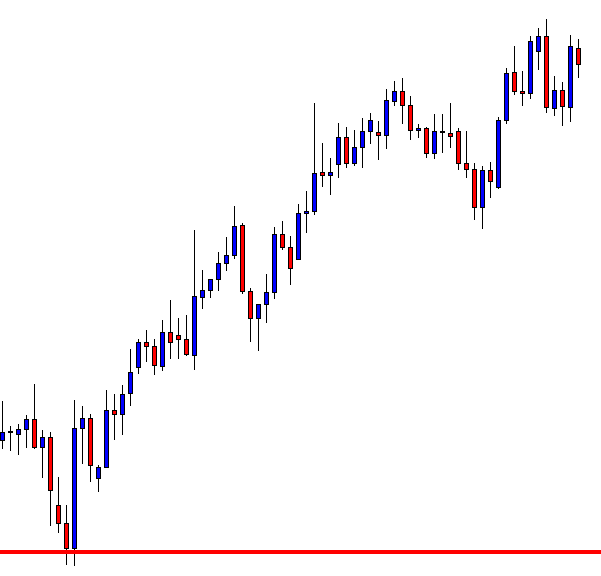
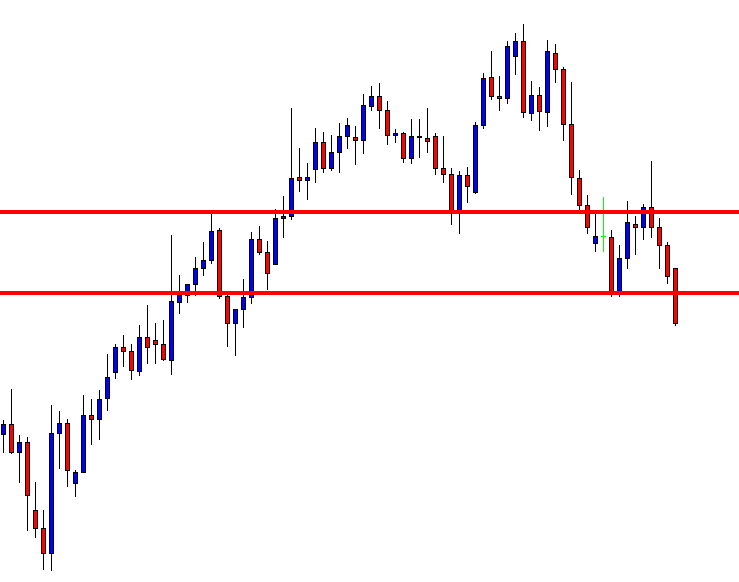
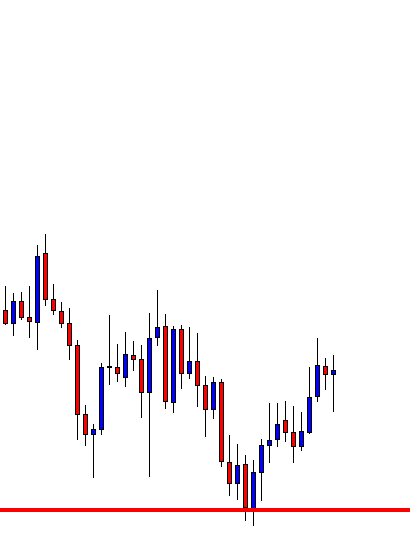
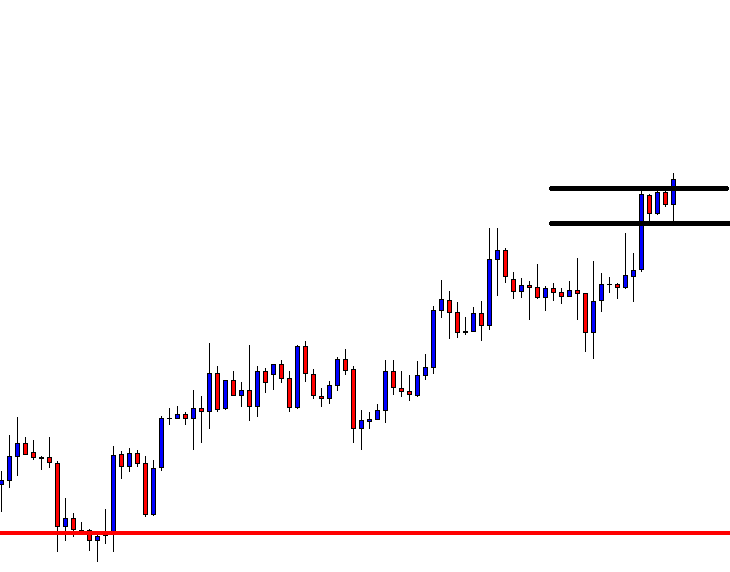
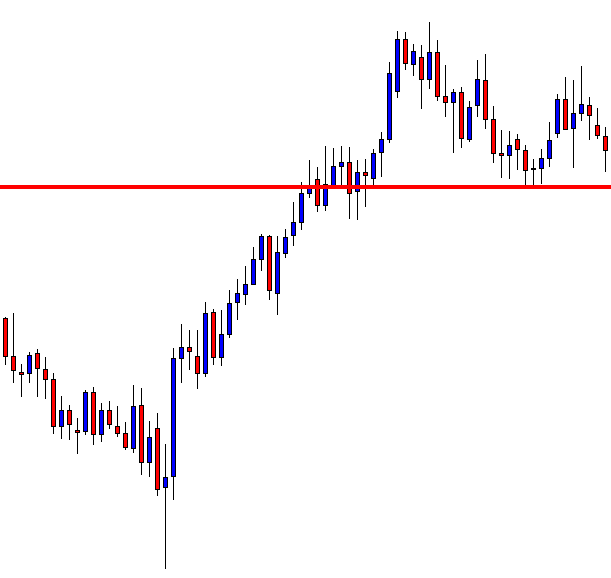
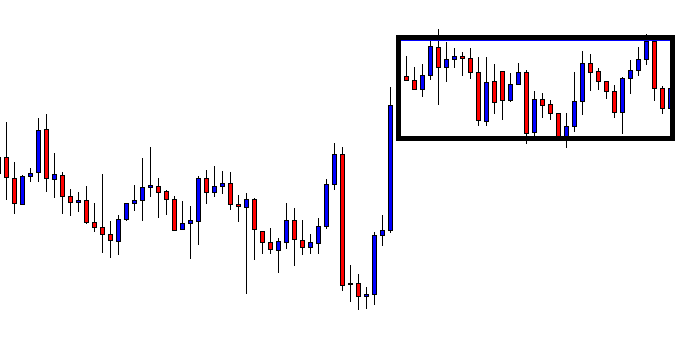
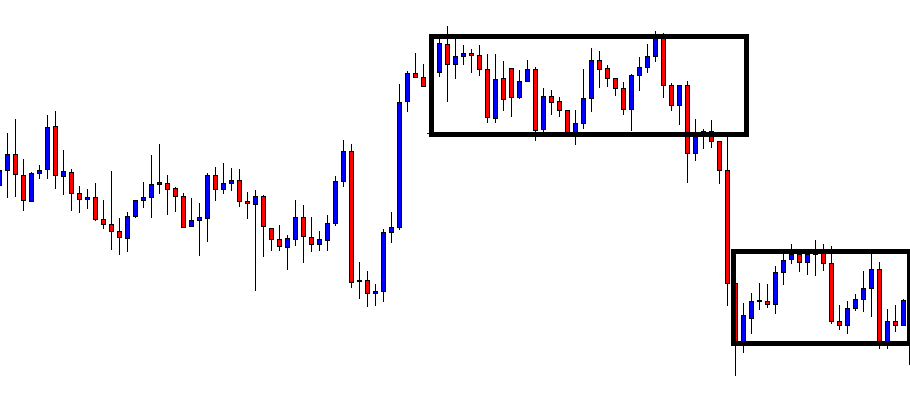
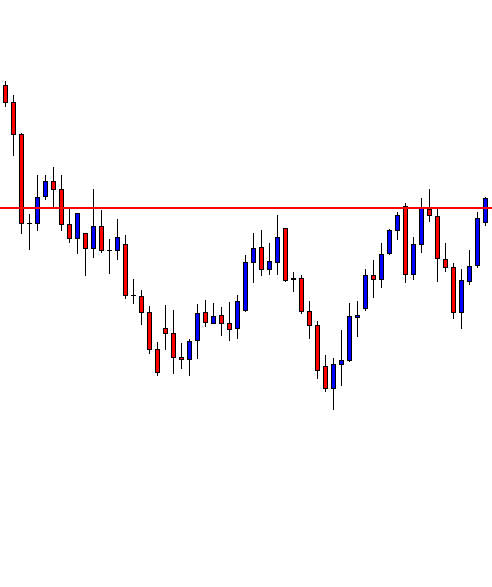
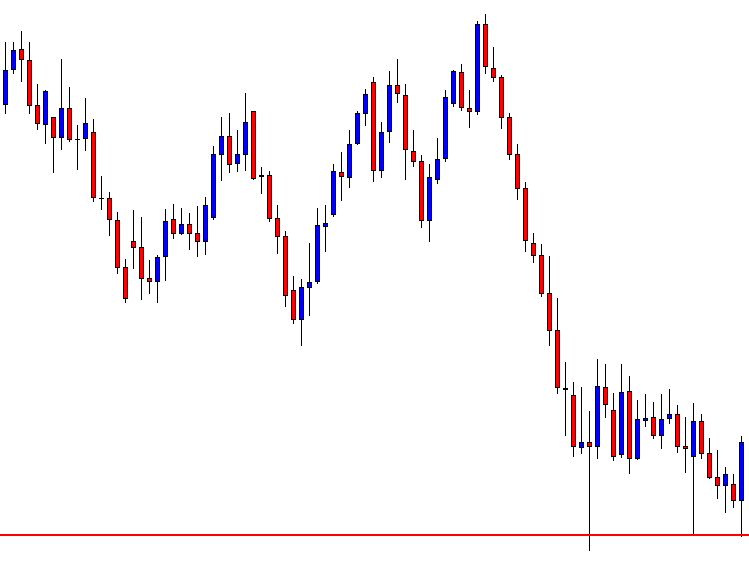
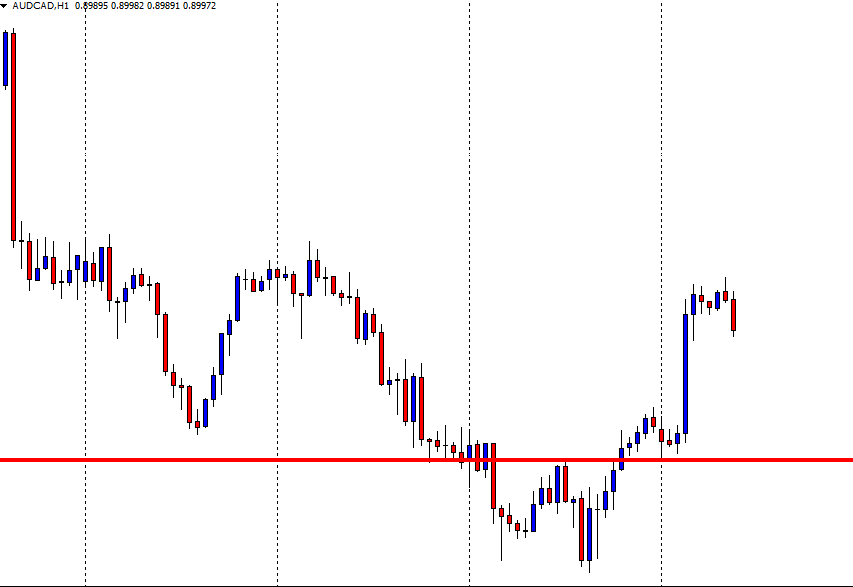
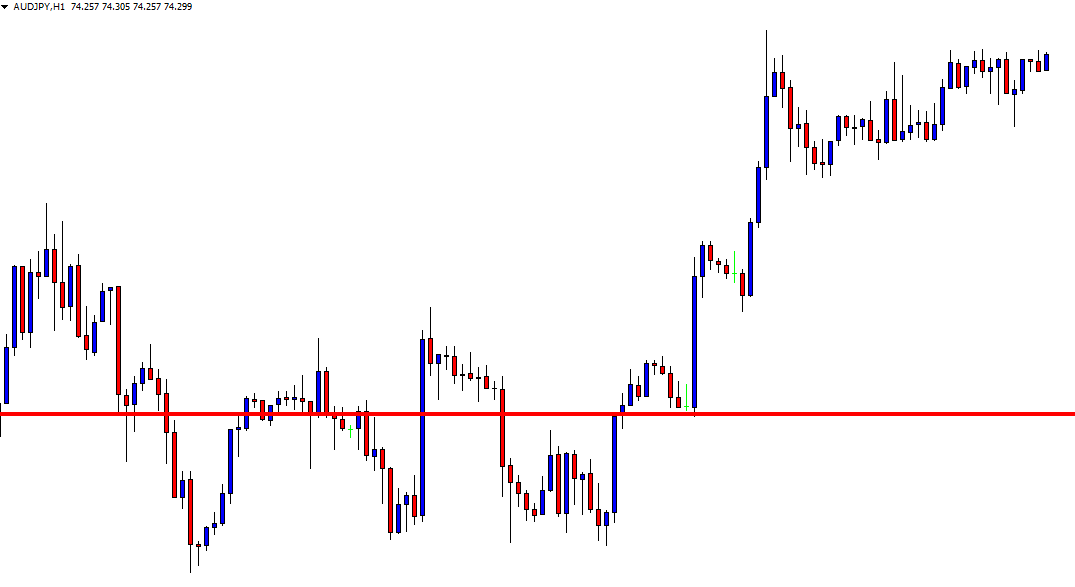
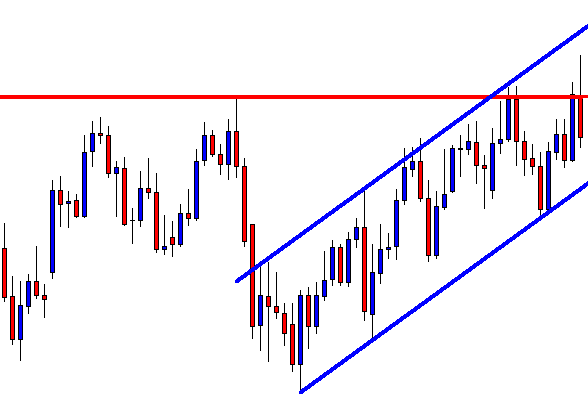
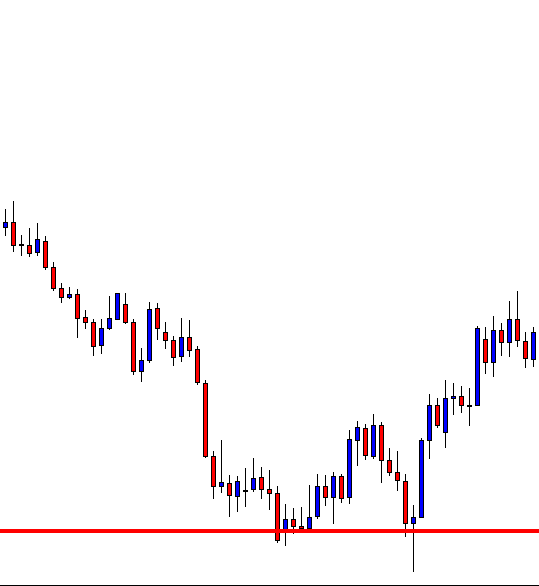
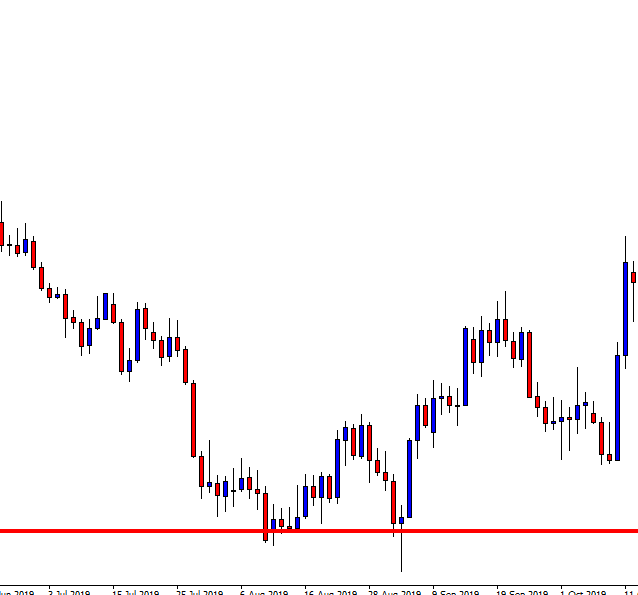
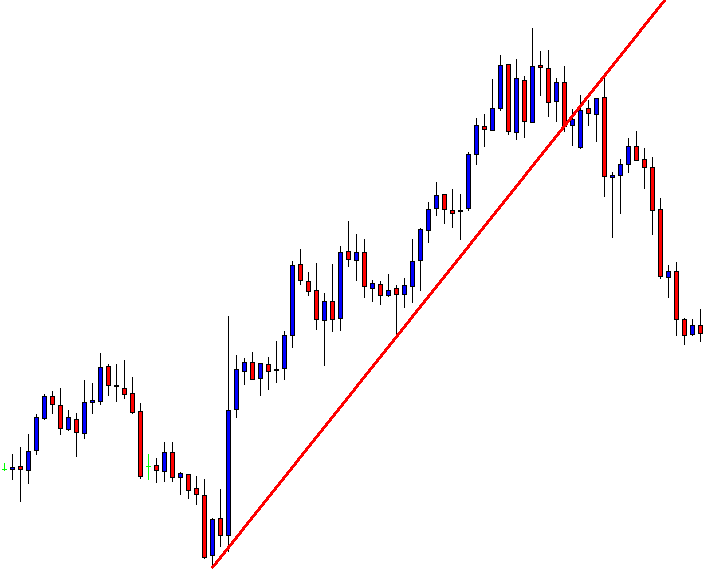
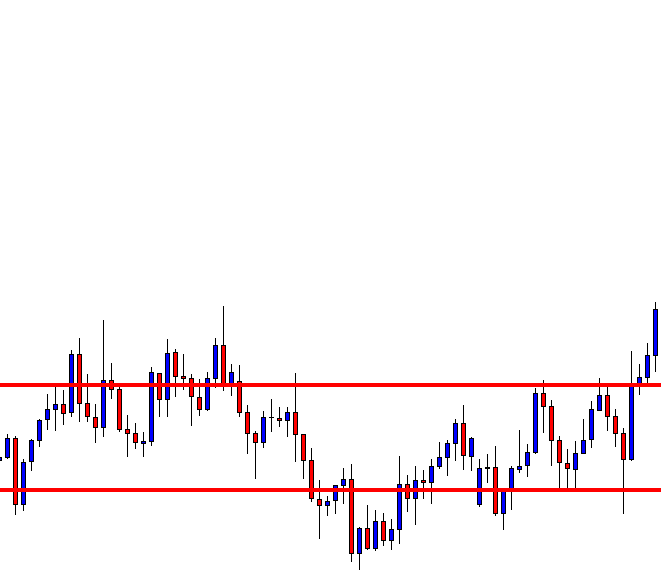
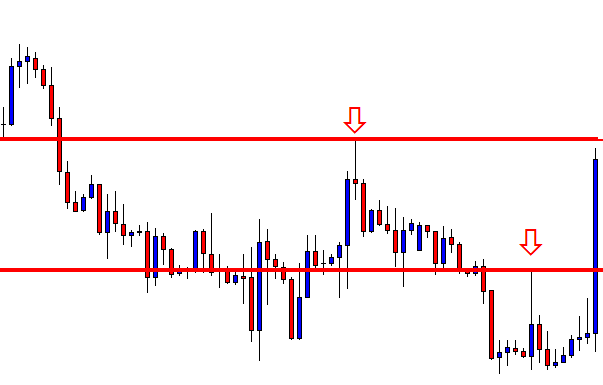
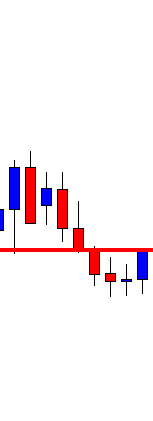
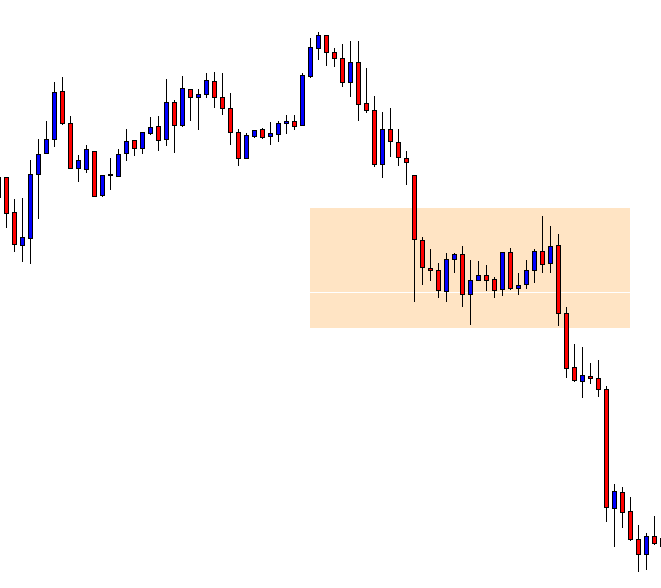
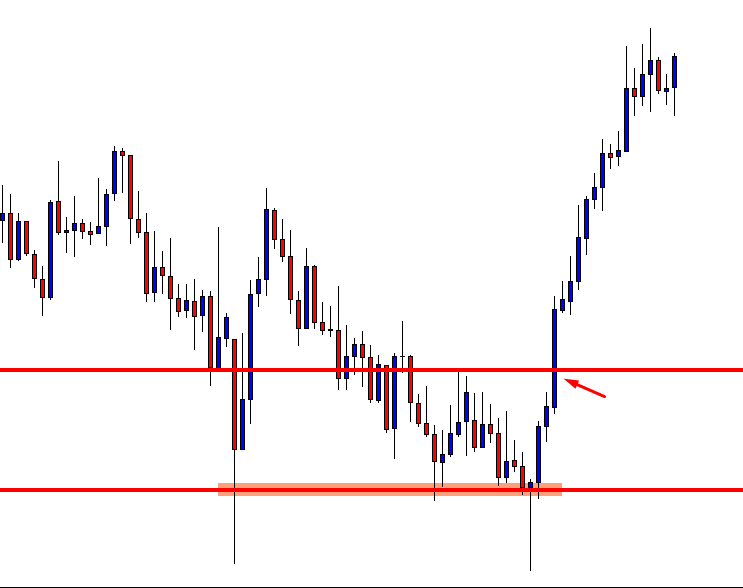
Concentrate on the chart. The chart has produced six candles since we have flipped over to the H4 chart. Six H4 candles mean a trading day is passed. Does it have any message to give us? We dig into the message later. Let us proceed to the next chart.

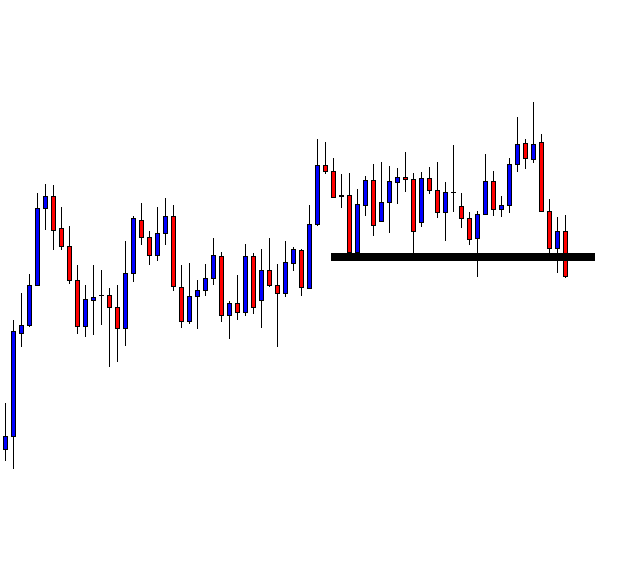
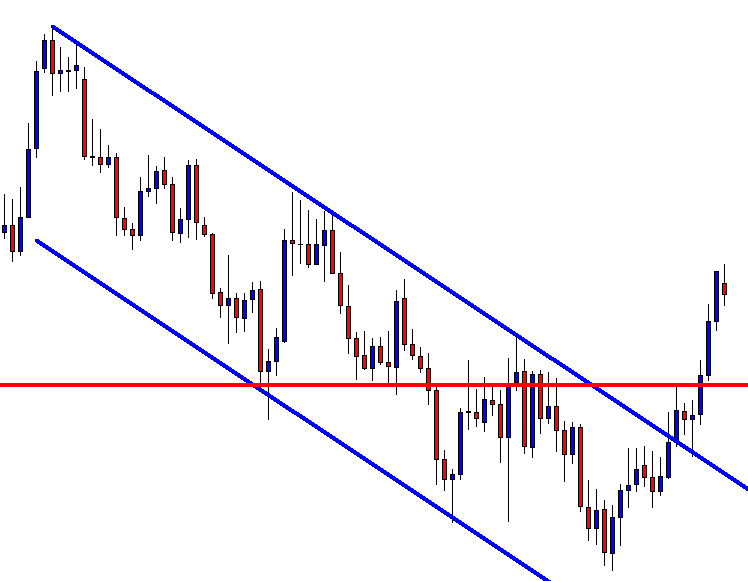
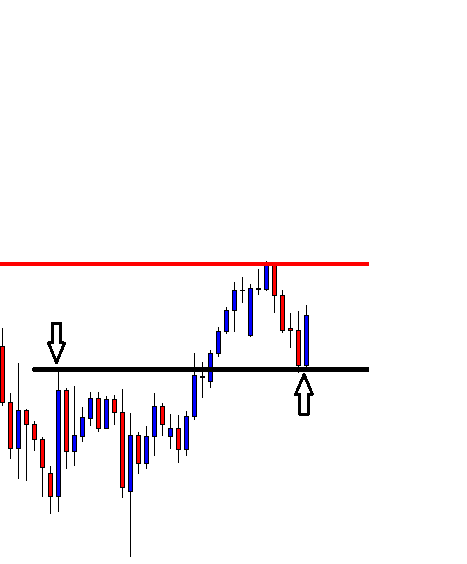
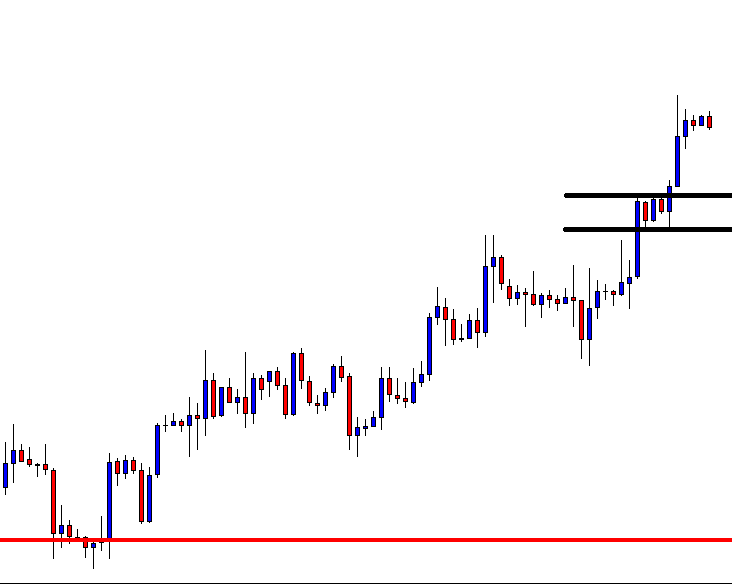
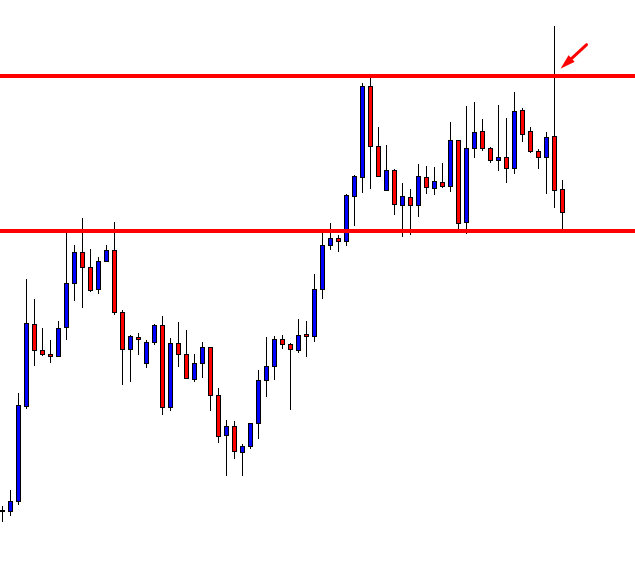
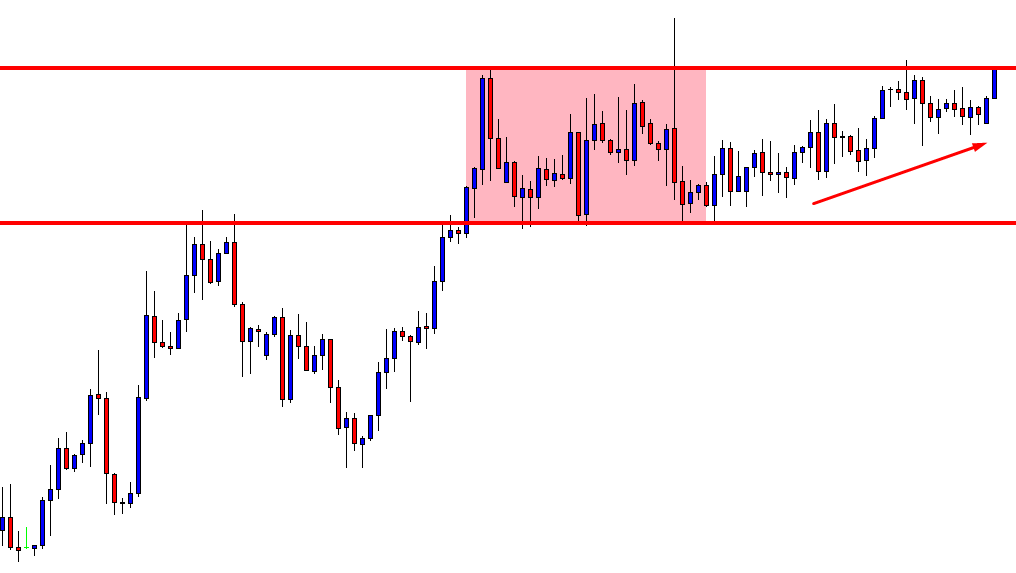
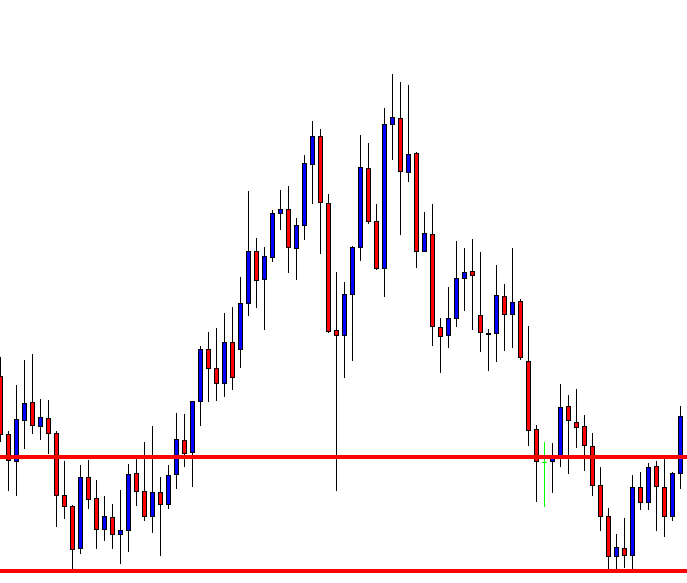
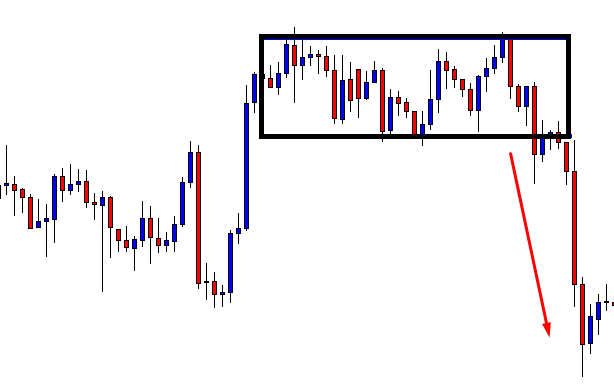
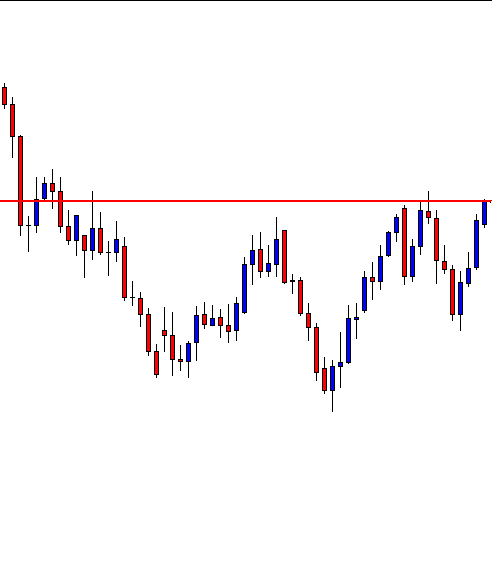
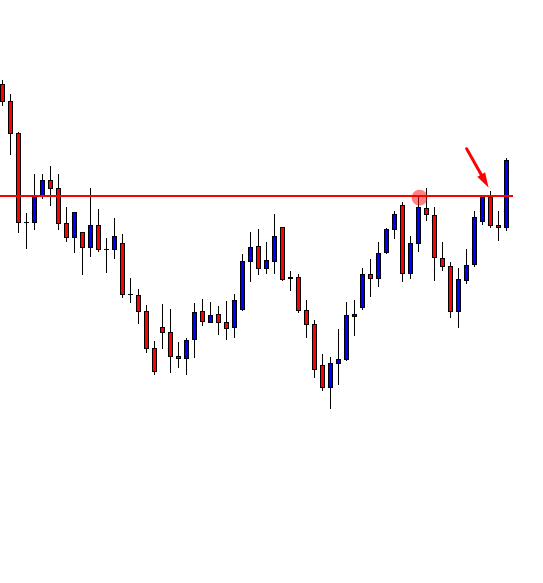
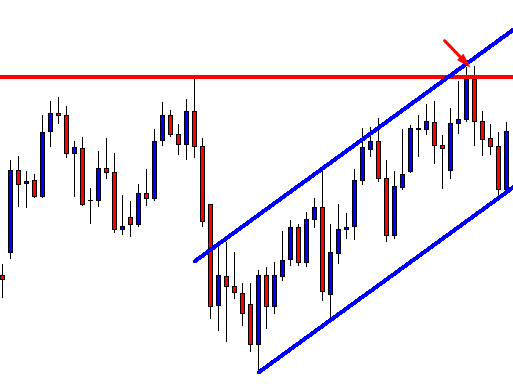
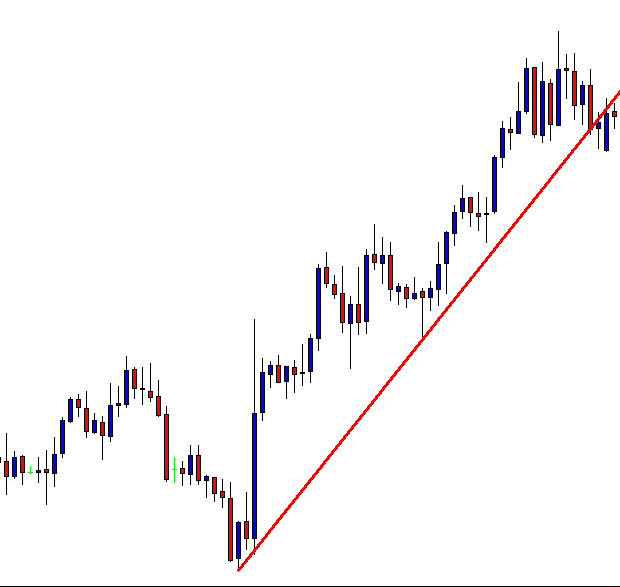
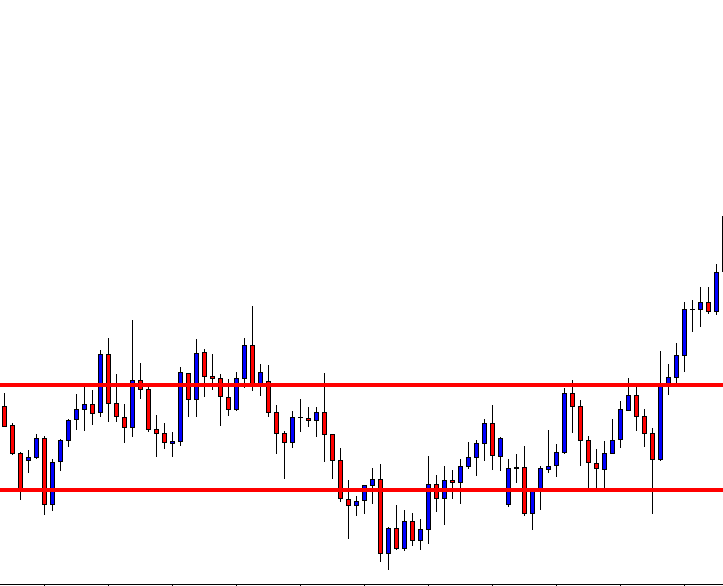
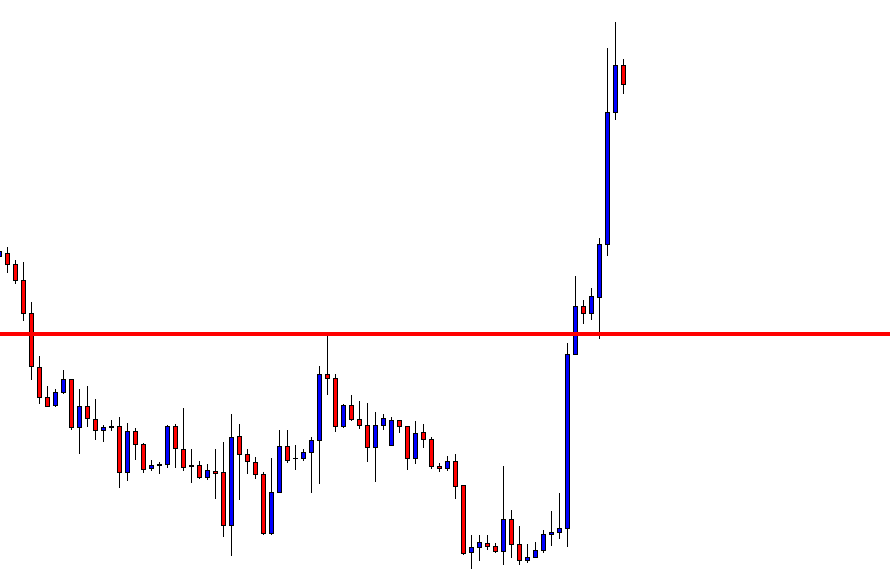
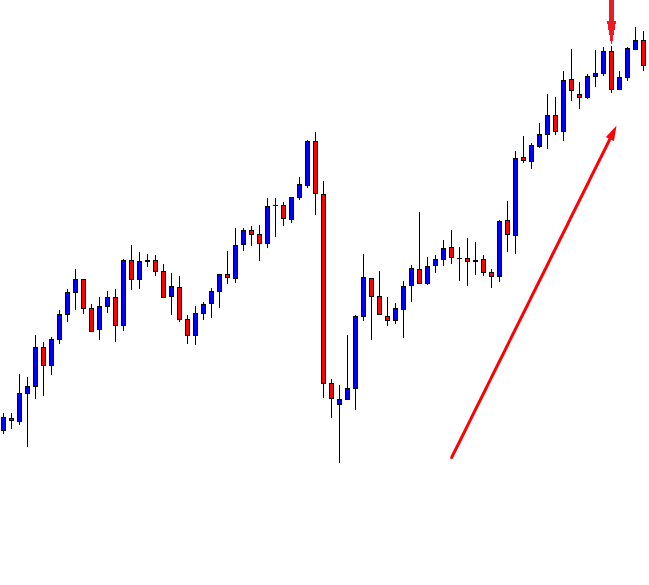
Wow! We have a breakout. Some traders may want to trigger an entry right after the candle closes. Let us find out what happens next.

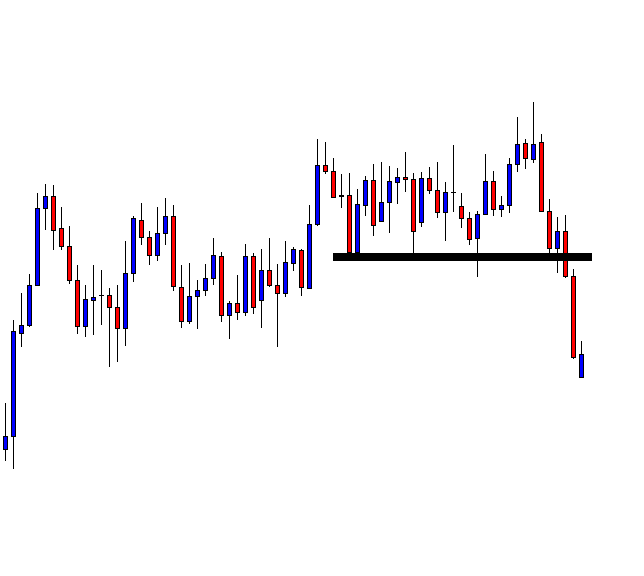
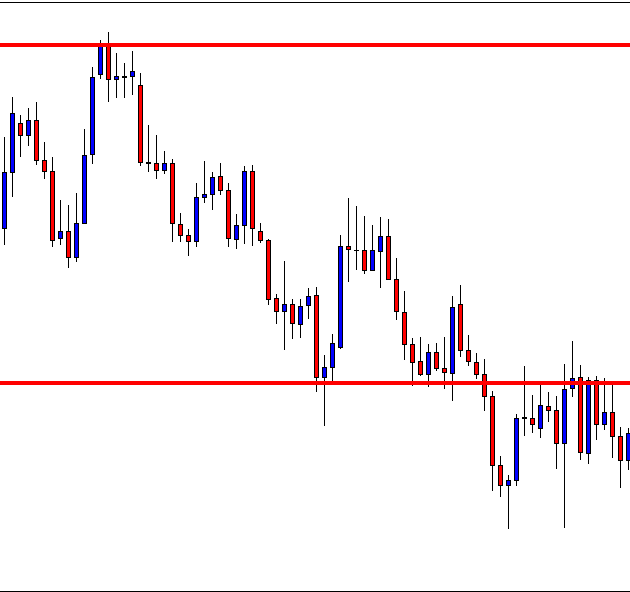
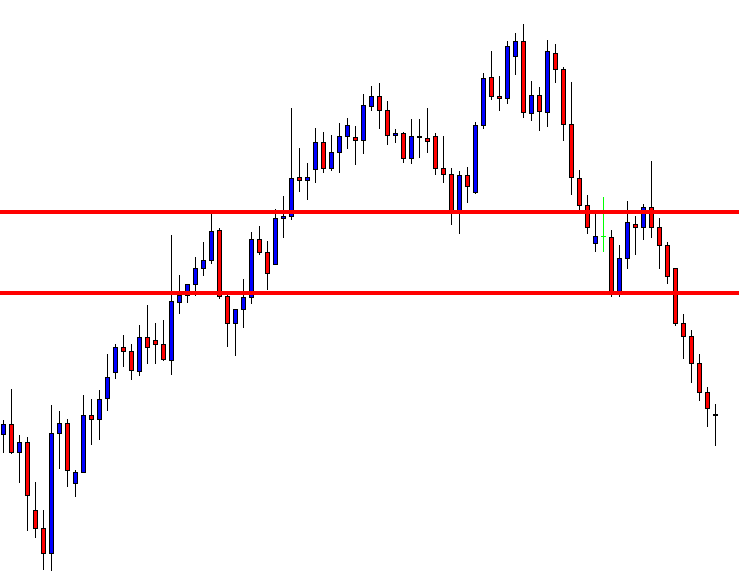
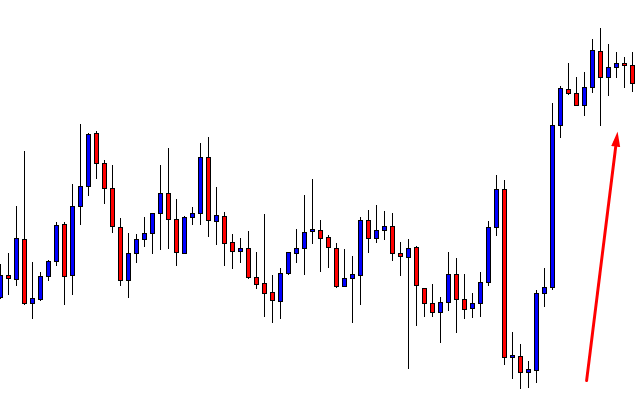
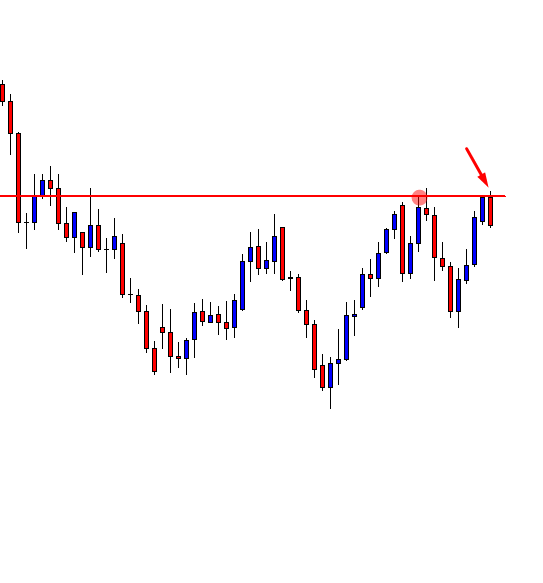
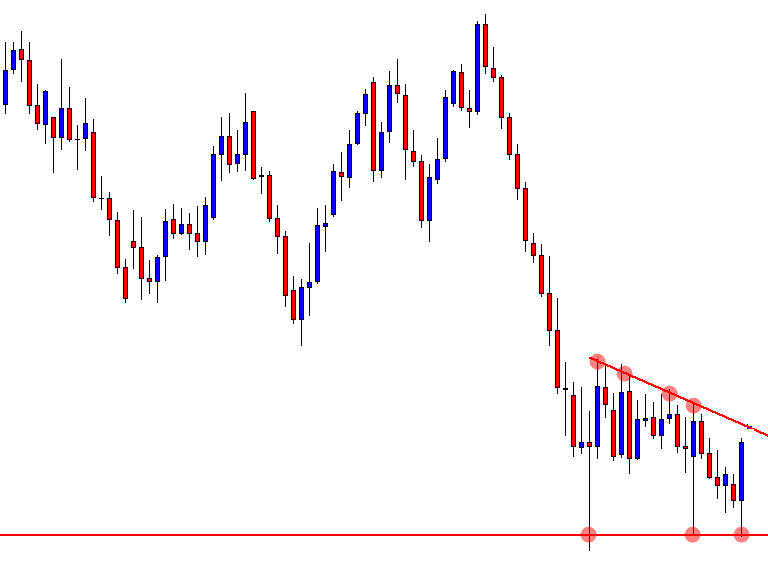
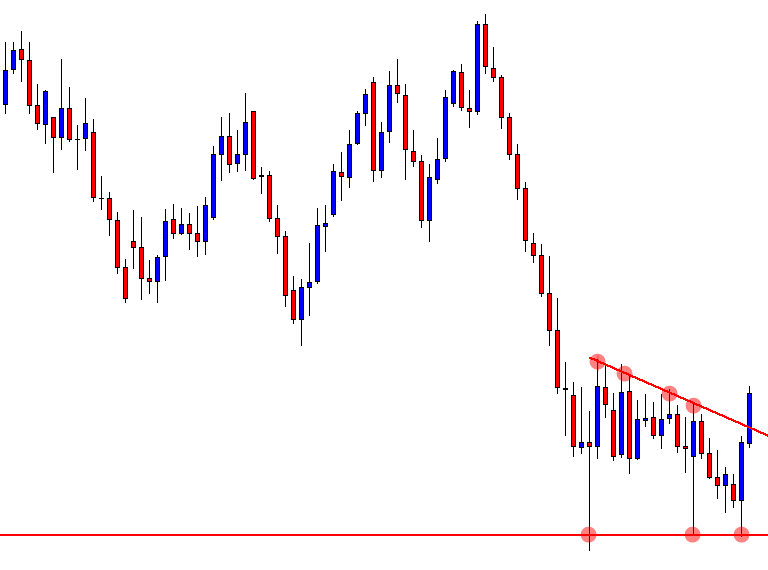
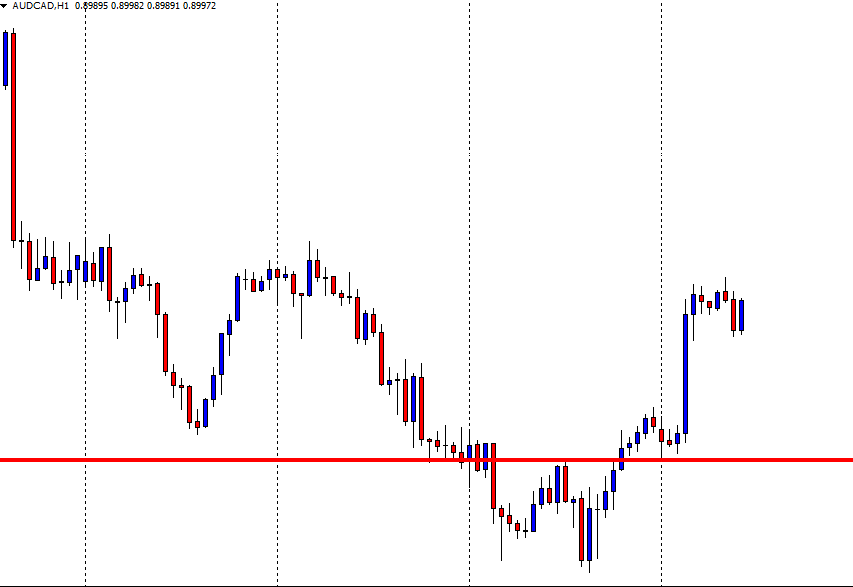
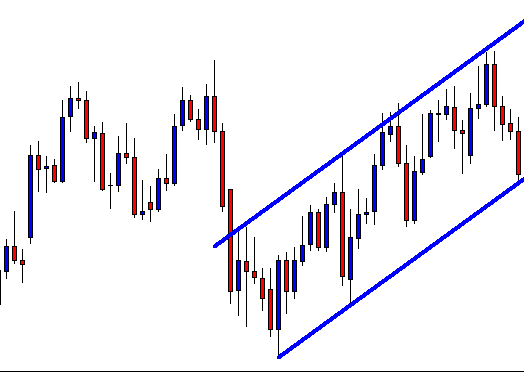
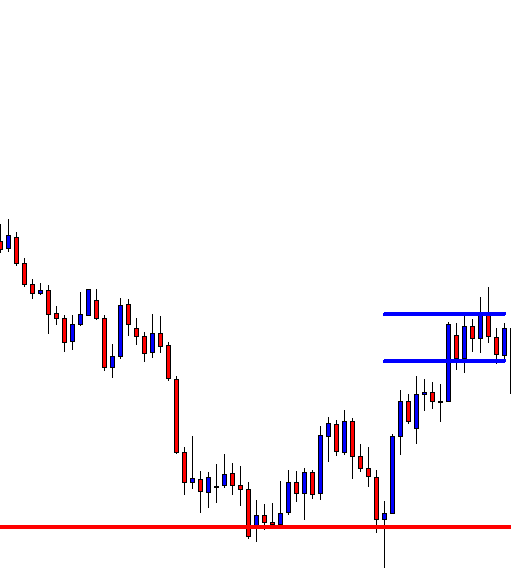
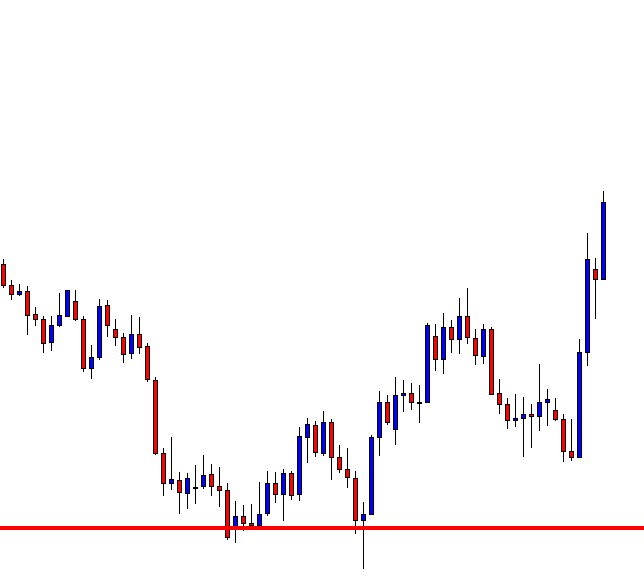
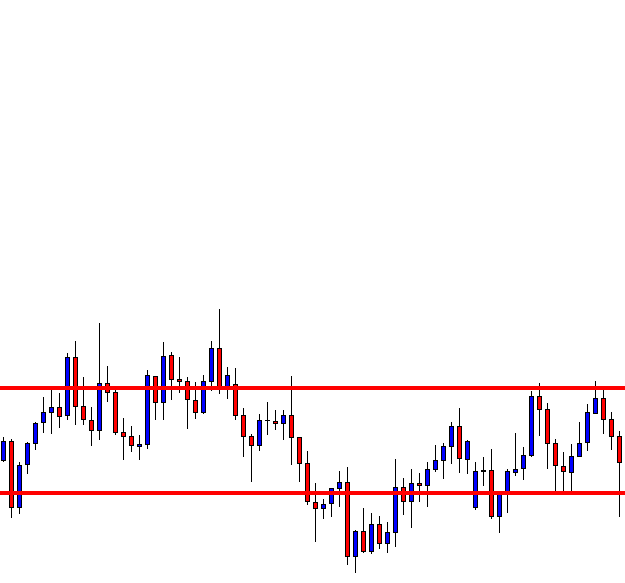
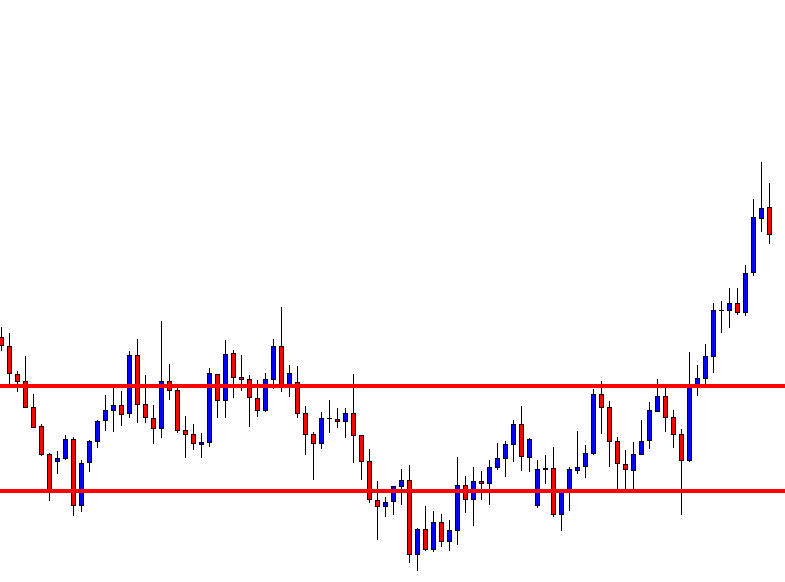
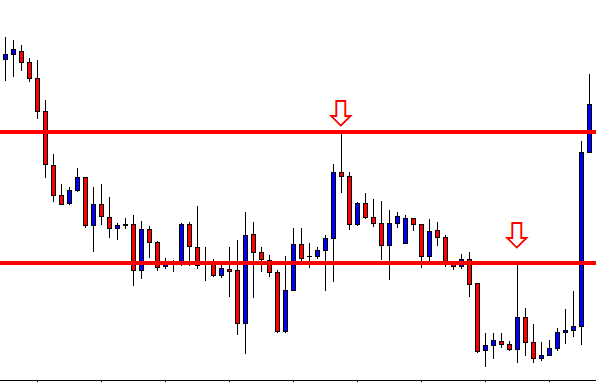
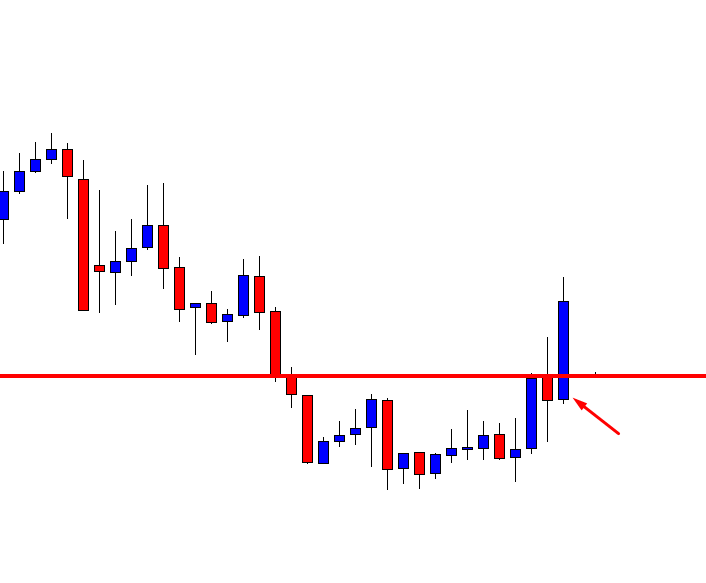
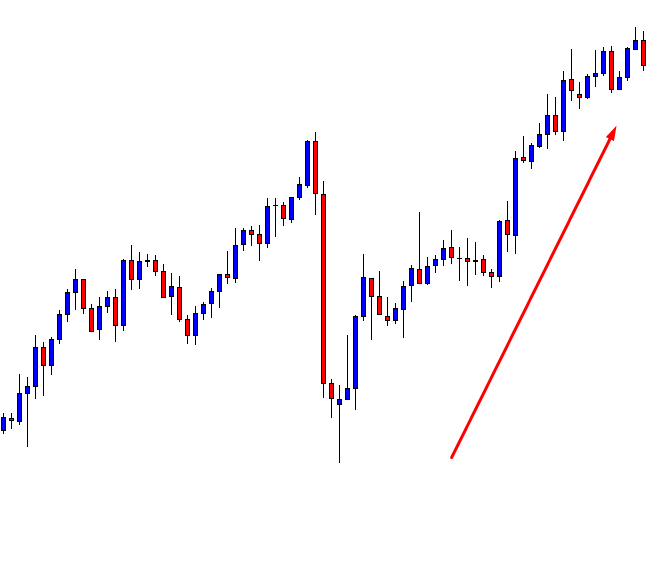
The price starts heading towards the North. The price hits the Stop Loss. It even breaches the highest high of the wave. This is a different ball game now. If it were a technically right entry, we would not have talked about it. The thing is this one was a wrong entry, as the signal candle forms at the wrong time.

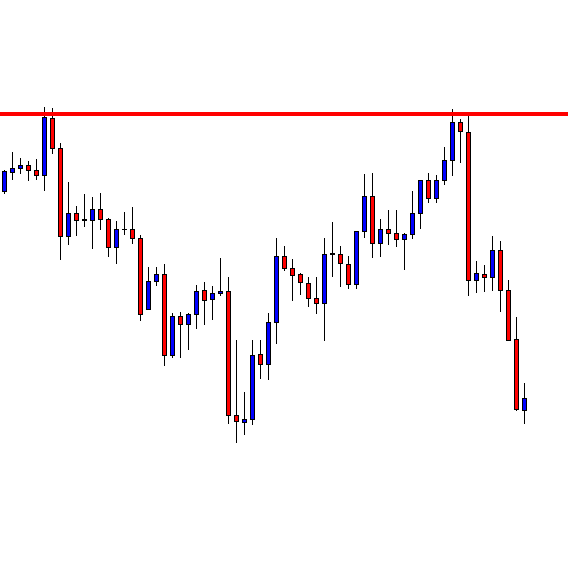
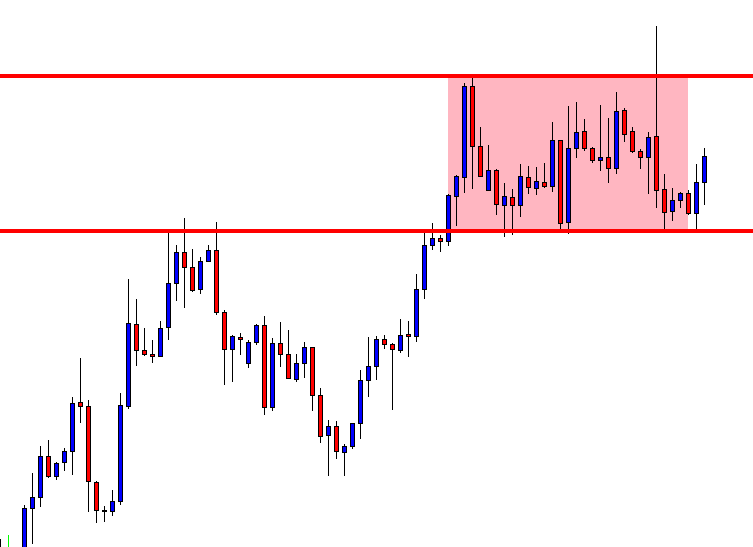
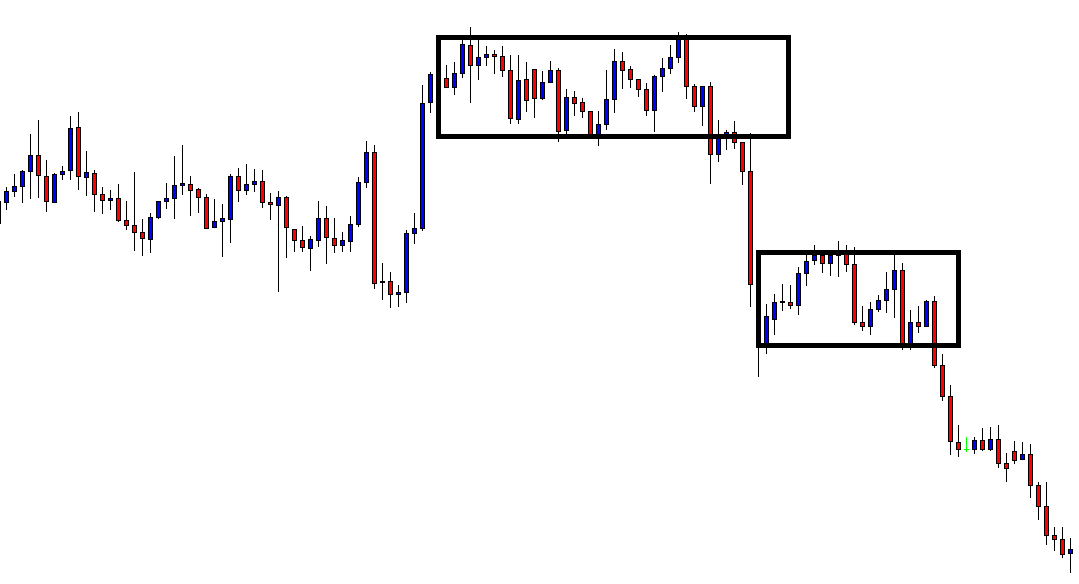
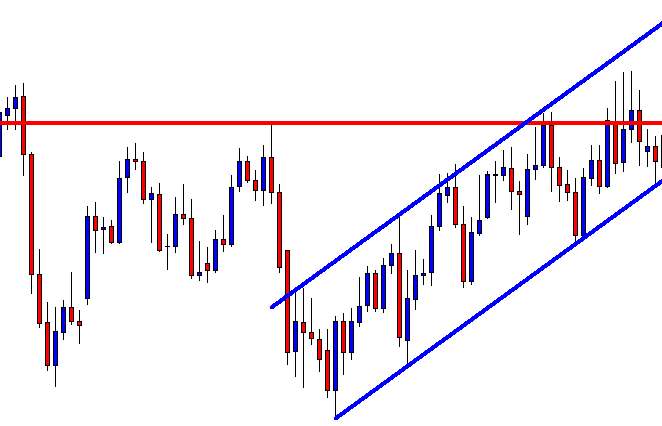
The signal candle does not form within the next trading day. It takes nine H4 candles to make the breakout. If the signal came within the first six candles, it would have been a valid trade. Since it comes at the ninth candle, it means the support has become daily support. Thus, an H4 breakout is not enough to drive the price towards the South. It goes towards the upside instead. The lesson we have learned here is, “A breakout is not a breakout if it does not take place at the right time.”

Categories
Forex Basic Strategies

Understanding The Volatility Breakout Strategy

Introduction

Breakout trading is one of the most common and popular strategies among traders across the world. In this article, we have added a powerful concept to this strategy, which is volatility. In a volatility breakout, we determine the movement of prices just before the breakout and also their reaction at important support and resistance levels. After analyzing the market, we will decide which breakout is safe to trade and which is not.

Volatility cycles

We have built the volatility breakout strategy in a very simple way. The principle of this strategy is that, when the market moves from one level to another (support to resistance or resistance to support) with strong momentum, the momentum is said to continue further. The other characteristic of the price is that it moves from periods of sideways movement (consolidation) and vertical movement (trend).

Price breaking out of a consolidation prompts us to believe that price will continue in that direction, which might last for one day, one week, or one month. The market after trending downwards gets choppy and reduces directional movement. Traders can use technical indicators like Bollinger Bands, which helps them to determine the strength of the breakout. Breakouts that happen with low volatility are ‘real’ breakouts; on the contrary, breakouts with high volatility can result in a false breakout. We shall look at each case in detail in the next sections of the article.


High volatility breakout

When we are talking about volatility, we mean the choppiness of the price, i.e., the back and forth movement of price. There are traders who like this kind of volatility, as they feel price moves very fast from one point to another. But this isn’t necessarily true in case of a breakout. If you don’t have the required strength in a breakout, you could be trouble.

In the above chart, we see that the price has been in a range for a long time. This means a breakout could happen anytime. Much later, the price tried to break above resistance and stayed there for quite a long time. The price is just chopping around without moving in any particular direction eminently. All these are indications that the breakout, if it happens, will not sustain. Hence, one needs to be extra cautious before going ‘long’ after the breakout.

There are many traders who are willing to take the risk and want to try their luck in such conditions. In that case, after you buy the forex pair, always keep a tight stop loss. The reason why we are suggesting a tight stop loss is that there are high chances for the trade will not work in your favor, and you should avoid making a big loss in that trade. The setup would look like something below.

If the trade works, it can give a decent profit with risk to reward of more than 1.5, which is really good. Again this strategy is only for aggressive traders.

Low volatility breakout    

When a breakout happens with a lot more strength, it is said to be a low volatility breakout. The price here does not face much of hurdle and crosses the barrier with ease.

As you can see in the above chart, the price does not halt at resistance, and the breaks out smoothly, which is exactly how a breakout should be. After that, you can see that the breakout happens successfully, and the price continues to move higher. When such type of volatility comes into notice, we will see a higher number of traders being a part of this rally because they are relatively risk-free trades. This strategy is recommended by us to all types of traders, irrespective of their risk appetite. The next question is where to take profit and put a protective stop.

Stop-loss can be placed below the higher low, which will be formed near the resistance, and profit should be booked at a price which will result in a risk to reward ratio of 1:2. Some money management rules should also be applied while booking profits. The setup would look something like this.

Measuring volatility

Since this strategy is mostly based on volatility, it is important to know how to measure volatility.

  • Bollinger bands are excellent volatility and trend indicators, but like all indicators, they are not perfect.
  • Average true range (ATR) measures the true range of the specified number of price bars, typically 14. ATR is a volatility measuring indicator and does not necessarily indicate a trend. We see a rise in ATR as the price moves from consolidation to a strong trend and a fall in ATR as market transitions from strong trend to choppiness.
  • ADX is also a prominent indicator that measures the strength of a trend based on highs and lows of the trend over a specified number of candles, again typically 14. When ADX rises, it indicates that the volatility has returned to the market, and you might want to use a strategy that fits that market condition.

Bottom line

The market does not always be in trending and consolidation phases, and we also have to learn to deal with different types of volatility. This is where most of the strategies can be used at their best, and using volatility indicators can help you trade more effectively. A breakout, when accompanied by the right amount of volatility, can be highly rewarding. Hence this is an important factor in any breakout trading system. Cheers!

Categories
Forex Basic Strategies

Even a Choppy Price Action Offers Entries

The market moves in three ways upward, downward, and sideways. In today’s lesson, we are going to demonstrate an example of a Rectangle breakout and an entry from a choppy price action. Let us have a look at the chart below.

The price action is choppy in this chart. Typically, traders avoid this kind of price movement. However, if we want to take trading as a full-time business, we are to widen our eyes. An entry can be found even in this market. Concentrate on the rectangle drawn here. After all these bounces, rejections the price finds its support and resistance within the rectangle.

The chart produces a bearish engulfing candle right at the resistance of the rectangle. This is a sign that something may happen. Let us assume a bearish move may occur. The first candle of the bearish trend looks good. A downside breakout with good momentum is the second thing that the sellers may wait to get.

The next candle comes out as a bearish candle followed by an Inside Bar. Things are getting better for the sellers. A bearish engulfing candle closing below the support would be the signal to go short for the sellers.

Here it is. The breakout candle is a bearish Marubozu candle. We may trigger a short entry right after the candle closes. Let us find out where we will set our Stop Loss.

Many traders may suggest setting the Stop Loss above the resistance of the rectangle and setting the Take Profit with the same distance. This is a good idea. However, we may set our stop-loss just above the resistance of the last consolidation. The reason is the price consolidates before making the breakout at the support. If the price made a breakout without the consolidation, we would have set our Stop Loss differently. By setting Stop Loss above the last consolidation’s resistance, we are to keep an eye with our Take Profit level.

We may set our Take Profit all the way down at the last swing low. The price may have kept going towards the major support. Look at the chart above. What do you think? The price is still very bearish but it produces a bullish reversal. That is too with a gap. The price action traders do not like price gaps. Considering the fact that we have set our Stop Loss as close as it can get, thus it may be the time to close our trade and come out with the profit.

The Bottom Line

Even a choppy market ends up producing an excellent trading signal. Our first choice shall be trending markets to look for entries. However, if we can spot out some entries from the choppy market, it would surely make us be more profitable.

Categories
Ichimoku

Ichimoku – The Two Clouds Discovery

The Two Clouds Discovery

In Manesh Patel’s book, Trading with Ichimoku Cloud – The Essential Guide to Ichimoku Kinko Hyo Technical Analysis, he made a fantastic discovery. When I first read his work, I almost missed it. Whether he knows it or not, Mr. Patel made a discovery and an observation that his peers have not written about in their work. I call this the ‘Two Clouds Discovery.’ It’s one of those moments where you know you’ve probably been aware of this phenomena, but no one put words to it. It’s one of those things where you go, ‘huh, why didn’t I think of that?’ or ‘I can’t believe no one else noticed this.’

Two Clouds

The Two Clouds discovery puts a label on the component we already know: the Kumo (Cloud). The names we are giving to these two components are the Current Cloud and the Future Cloud. The Current Cloud is where price action is currently trading. The Future Cloud is the further point of Senkou Span A and Senkou Span B – so Future Senkou Span A and Future Senkou Span B. It’s important to think of it this way:

The Current Cloud is the average of the Tenkan-Sen and Kijun-Sen from 26 periods ago.

The Future Cloud is the current average of the Tenkan-Sen and Kijun-Sen.

And here is the main point and of the Two Clouds Discovery: When a significant trend change occurs, the Future Cloud is thin with both the current Senkou Span and Senkou Span B pointing in the direction of the Future Cloud.

The image below is Gold’s daily chart. Using the market replay feature in TradingView, I have used November 20th, 2018, as the starting point for this article. It’s important to remember what we are looking for: Current Senkou Span A and Current Senkou Span B pointing in the direction of Future Senkou Span B and Future Senkou Span A.

First, we look to see if the Future Cloud is thin. The thickness or thinness of the Cloud is going to be very subjective, but I believe most people can determine whether something is thick or thin based on the instrument they trade and the timeframe they are trading in. For Gold, this is a thin cloud.

Thin Future Cloud

Next, we want to see if the Current Senkou Span A and Current Senkou Span B are pointing in the direction of the Future Cloud – they are.

Current Senkou Span A and Current Senkou Span B

Now, let’s see what happens when we populate the screen with the price action that occurred after November 20th, 2018. What we should see if a significant trend change is occurring when both the Current Senkou Span A and Current Senkou Span B are pointing in the direction of a thin Future Cloud.

Bull Move

Go through any Daily or Weekly chart and find a thin Cloud and then utilize the market replay – odds are you will see what I have discovered: a high positive expectancy rate of markets trending strongly when price is trading near where the current Senkou Span A and current Senkou Span B are pointing towards the direction of a thin Future Cloud.


Sources: Péloille, Karen. (2017). Trading with Ichimoku: a practical guide to low-risk Ichimoku strategies. Petersfield, Hampshire: Harriman House Ltd.

Patel, M. (2010). Trading with Ichimoku clouds: the essential guide to Ichimoku Kinko Hyo technical analysis. Hoboken, NJ: John Wiley & Sons.

Linton, D. (2010). Cloud charts: trading success with the Ichimoku Technique. London: Updata.

Elliot, N. (2012). Ichimoku charts: an introduction to Ichimoku Kinko Clouds. Petersfield, Hampshire: Harriman House Ltd.


Categories
Forex Price-Action Strategies

Trading is the Hardest Way to Make the Easiest Money

Financial traders need to be very alert and patient to deal with the market. These two components are vital for a trader to be successful in trading. In today’s lesson, we are going to demonstrate an example of alertness and patience. Let us get started.

The price heads towards the South. Ideally, a trader shall look for short opportunities in a chart like this. The last candle comes out as a bullish reversal candle. It is time for consolidation and waiting to get a downside breakout to take a short entry.

The price seems to go too far. It consolidates and produces a bearish engulfing candle. We may flip over to the H4 chart to find an entry since this is a daily chart. The support level looks strong since it created a long bullish move. The price may play around the level for a while.

As expected, the price stalls at the level of support. Things are different now. A downside breakout would make the pair bearish. A bullish reversal candle would make the traders look for long opportunities. This is where traders must be alert and never be rigid with their initial thought.

A bullish reversal candle forms right at the level of support. Traders may want to flip over to the H4 chart to look for long opportunities. We are not flipping over to the H4 chart this time since I know what happens afterward. Our trading lesson today is going to emphasizes something else.

The price heads towards the South instead. The H4 chart does not offer any entry after that daily bullish engulfing candle. Now, the price action is choppy. It seems that it is a chart to avoid for a while.

Not really, be alert. The price obeys a down-trending channel. Thus, any rejection at the upper band may create short opportunities. The price heads towards the resistance. Let us wait for a bearish reversal candle at the upper band (resistance of the channel).

The price makes a breakout at the upper band instead. It consolidates and produces a Spinning Top. Again, we are to change our trading direction. This time we are to go long.

The last candle breaches the horizontal resistance after consolidation. A long entry may be triggered right after the candle closes. Let us proceed to find out what happens next.

Two consecutive bullish candles form right after the breakout candle. Formation of a bearish reversal candle signals that it may be time to come out with a profit. At last, we make some green pips by going long.

The Bottom Line

This is an example of why we must not be rigid with our direction and how important it is to be alert with price patterns. Trading is never easy. As they say, “Trading is the hardest way to make the easiest money”. If we work hard in learning, only then we will be able to make money easily.

Categories
Forex Basic Strategies

A Twist in the Tale

The Forex market can be very unpredictable. It is a game of probability. With more experience and knowledge, a trader increases the chance to be right in making a trading decision. Having immaculate risk management is another aspect that keeps a trader safe with his investment. In today’s lesson, we are going to talk about the unpredictability of the market.

Let us start with a daily chart of a Forex pair.

The price makes a bullish move and finds its resistance. After four daily candles, the daily chart produces a bullish engulfing daily candle. This is a powerful bullish reversal candle, which forms right at a flipped support. Have a look at the chart below.

The chart above shows that the bullish engulfing candle forms at the flipped support. This means buyers on this chart are to go long on a chart pattern called ‘ABC’ or ‘123’. This is a lucrative and consistent chart pattern, which price action traders love to trade. Let us find out what happens next.

The price stalls and has a rejection at the same level. The buyers would love to get a breakout here to go long and grab some green pips. However, the chart produces a bearish engulfing candle instead. What do you think a trader should do here?

He shall start looking for short opportunities. This is the daily chart. Thus, he shall flip over to the H4 chart to find out a short opportunity.

This is how the H4 chart looks. A very strong bearish candle followed by a little Inside Bar. The trader (the seller) is to wait for consolidation and a bearish reversal candle to go short.

The price consolidates more. It produces a good-looking bullish candle. Let us find out how the next candle comes out. Do not forget that the sellers are waiting to get a bearish reversal candle breaching the lowest low.

This is it. A bearish engulfing candle closes below the level of support. The sellers have been waiting to get a signal candle like this. A short entry may be triggered right after the last candle closes. Let us find out what happens next.

As expected, the price heads towards the South with good bearish momentum. We see the first H4 bullish reversal candle forming at the daily support as well. This may be time to take out the profit.

The Bottom Line

Do you notice how things change within a candle? Before that bearish engulfing daily candle, the pair looks extremely good for the buyers. An upside breakout would make them go long on the pair and push the price towards the North. However, that does not happen, but the price comes down instead. This is what I call “Twist in the tale.” Forex traders often get these twists.

Categories
Forex Price-Action Strategies

A Breakout and the Confirmation

Support and Resistance, also known as Supply and Demand, have long been used in the financial markets. The most characteristic feature of support/resistance is a level of support becomes resistance, and a level of resistance becomes support. The price after making a breakout comes back to the level and makes a move towards the established trend. The price does not always confirm all the breakout levels, though. Traders do not know which broken level is going to produce a trading signal. In reality, they do not even have to know or guess. They have to make decisions according to the price movement or Price Action. Let us have a demonstration of this.

The price is up trending. Traders shall look for long opportunities. To be honest, the last candle on the chart is a buy signal. It was a week ending candle, which must have held the buyers back. Let us wait for a while to get more clues.

The last candle came out as a bearish engulfing candle. Such price action usually makes a pair choppy. The buyers may want to wait for an upside breakout to go long. However, a bearish engulfing candle may not let that happen.

A strong bullish candle closes within the resistance. It seems that the chart may produce a Double Top. Thus, the bear may come and dominate. Let us draw the Neck Line and resistance of the Double Top.

The equation is very simple here. A breakout at the neckline attracts the sellers, which is more likely. On the other hand, an upside breakout attracts buyers. Let us find out which way the price heads to.

The price makes a breakout at the Neckline. However, it does not consolidate around the Neckline after the breakout. Unfortunately, the sellers do not get an opportunity to go short here. It often happens with the traders. Traders’ life is never easy!

Here is a question. Do you see anything interesting? Has the price made another breakout?

It has made a breakout at the red-marked level. It goes back to the level to confirm the breakout, as well. Moreover, it has produced a bearish engulfing candle with a long upper shadow. Things look good for the sellers. A breakout at the lowest low would be the signal to go short.

Here comes the breakout. A bearish Marubozu candle breached the lowest low. The sellers may want to trigger a short entry right after the last candle closes. Let us find out how far down it goes before producing any bullish reversal candle.

Here comes the breakout. A bearish Marubozu candle breached the lowest low. The sellers may want to trigger a short entry right after the last candle closes. Let us find out how far down it goes before producing any bullish reversal candle.

The price heads toward the downside with good bearish momentum. It produces a Doji Candle. It may be time to come out with a profit.

The Bottom Line

The price does not confirm all the breakouts. That does not mean we should start pulling our hair. Concentrate hard and calculate well. The next opportunity is just around the corner.

Categories
Forex Basics

Do not be Biased with Your Anticipation

Financial markets keep going up and down. Traders make money out of those moves. To take an entry, a trader is to do a lot of calculations, such as detecting a trend, waiting for the price to go to the right zone, market psychology, and signal candle, etc.

In trading, we often find ourselves in a situation in which we were waiting for a long entry from a support zone, all of a sudden the price makes a breakout at the support and heads towards the South instead. We feel deprived. However, this should not be like this. In trading, we are to get ready to sell and to buy since the market can go anywhere. We are to stick with the rules to take an entry.

Let us demonstrate an example.

The price heads towards the North with good buying pressure. It seems that the price finds its resistance as well. The buyers are to wait for a bullish reversal candle and a breakout at the resistance to go long again on the pair.

The price keeps being bearish. It seems that the price is going to have a long correction instead of consolidation. The price is at a flipped support. This is where a battle is going to take place between the bull and the bear. Traders are to wait for a downside breakout to sell the pair. On the other hand, a bullish reversal candle is going to attract them to keep an eye for an upside breakout and buy the pair.

The bull wins here. An engulfing bullish candle right at the flipped support means traders shall wait for an upside breakout to buy the pair. The momentum looks good. If the breakout takes place within the next candle, it will be an excellent buy signal. If it takes two candles to make the breakout, that will be a good buy signal as well. Let us proceed to find out what happens next.

The bull has lost the momentum. Traders are to wait for an upside breakout to go long. A good-looking bullish engulfing candle at the support area shall attract the buyers on the minor time frames to push the price towards the upside. That would eventually help the price make an upside breakout on this chart. Let us wait and find what happens next.

What do you see here? A bearish engulfing candle is right at the resistance level. This is a Double Top resistance level as well. If you have been waiting to go long, please change your mind. Get ready to look for short opportunities. This is how the market changes its complexion. You know what you have to do to deal with it. Yes, you must not be biased with your anticipation/calculation — Trade what you see, not what you think.


Categories
Forex Market

Dealing With Liquidity & Volatility In The Forex Market

What is liquidity?

When a trader starts his trading journey, one of the things he finds most attractive is the amount of liquidity offered by the forex market. The latest figures suggest that the daily trading volume of forex is close to $5.1 trillion.

Liquidity is the ability to trade a currency pair on demand. In simple terms, it is the measure of how easily a currency can be exchanged. When you are trading major currency pairs, you have an exceedingly high amount of liquidity. This liquidity is provided by financial institutions, big businesses, and retail traders as well. However, not all the currency pairs are liquid; liquidity depends on whether a currency pair is major, minor, or exotic. Major pairs typically have high liquidity compared to the other currency pairs. In the next section, we will look at some of the money management principles in trading with respect to liquidity.

Liquidity and Risk

A market with low liquidity has chaotic moves and gaps because of the absence of buyers and sellers at any given point of time. These gaps occur when news announcements are made over the weekend or if an event happens at the same time. The chart below depicts such a gap after a news release.

According to money management principles, when you know that there will be a change in liquidity levels between Friday to Monday, it is not advised to carry huge positions on Friday. The risk drastically increases, if the price opens above your stop loss on Monday, it will become a market order, and this loss will be much higher than the predefined loss (determined using stop-loss). A conservative trader especially should not take any positions during times of news releases.

Retail forex traders need to manage liquidity risk by lowering their leverage and putting stop losses based on higher time frames. In this way, you would be safe from any kind of gaps that happen at the beginning of the week.

Volatility

Volatility refers to the currency fluctuations in the global exchange market. Price movements can vary from hour to hour, minute to minute, and second to second, depending on many factors. A lot of forex traders enjoy volatility, but it comes with a risk. Therefore it is important to manage volatility and do plenty of research before placing a trade.

Eliminating the risk of volatility

In order to make the most out of volatility, follow the below-mentioned techniques:

Volatility strategies

Money management, in relation to volatility, essentially suggests traders invest in strategies that can perform in different market conditions. Some of the strategies that can be used to turn the volatility in your favor include widening your targets, placing tight stop-losses, and analyzing the higher timeframes.

Stay diversified

Don’t rely too much on any asset class or forex pair. If one investment performs poorly, other investments may perform better over that same period and thereby reducing your overall losses. This happens due to the difference in volatility across various asset classes. A balanced portfolio protects from losses and provides a high return on investment.

Money management should always be a top priority for every trader, as these principles guide us while taking trading decisions. A lot more concepts related to money management will be discussed in the upcoming articles.

Categories
Forex Price-Action Strategies

Using Multiple Time Frames to Get Multiple Entries

We know using multiple time frames is an essential aspect of trading. Traders use the bigger time frame to find out the trend, breakout, vital support/resistance levels, and relatively smaller time frames to trigger an entry. In this lesson, we are going to learn how the trigger chart can be used as the analyzing chart to find out more entries.

This is a Daily chart, which is being used as the trigger chart. The weekly chart is used as the analyzing chart. It is a combination of Weekly-Daily. The price heads towards the North. Traders are to wait for the price to produce a bullish reversal candle.

A Spinning Top daily candle at a flipped support, the buyers have a lot to be optimistic here. One of the daily candles is to breach the daily resistance to go long on the pair. Let us draw the support and resistance on the chart to get a clearer picture.

This is how the chart looks like with support and resistance levels. If one of the daily candles breaches the resistance with good buying momentum, the daily traders are to trigger a long entry.

The next daily candle breaches the resistance. The buyer may take a long entry right after the breakout candle closes. An entry on the daily chart means that the trader shall leave the trade/chart for three to four trading days by setting Stop Loss and Take Profit.

However, if a trader uses the same daily chart as the trend-detecting chart and flips over to the H4 chart to find another entry, it surely would be more rewarding.

Let us flip over to the H4 chart.

Previously, the daily chart shows an upside breakout. Thus, the trend is bullish. The H4 chart shows that the price starts having consolidation. If the breakout level holds the H4 candles and makes an upside breakout, the H4 buyers are going to go long on the pair as well.

This is the H4 chart with the support and resistance of consolidation. The buyers must wait for an upside H4 breakout to go long on the pair. Let us proceed to the next chart.

Here it comes. An H4 bullish engulfing candle breaches the resistance. The H4 traders may want to trigger a long entry right after the candle closes.

The H4 chart shows the price may have consolidation again. The H4 buyers may want to cash in their profit. However, the entry, which is taken on the daily chart, traders are still to hold their positions until they get a bearish daily reversal candle.

At the end of the day, price action trading works very similarly on the Weekly, Daily, H4, and H1 chart. Today’s examples show that a Weekly-Daily combination offers an entry. After the daily breakout, the Daily-H4 combination offers an entry, as well. With a lot of practice, dedication, and hard work, a trader can trade both of them. This will surely beget more profit.

Categories
Forex Basics

What leads a Breakout to be Nullified?

Price action traders consider the breakout as one of the most important factors. It is, once it is confirmed. However, momentum, overall psychology are essential aspects of breakout that less experienced traders often misapprehend. In this lesson, we are going to demonstrate an example of a breakout with less momentum. Let us get started.

The chart shows that the price is up trending with good buying pressure. The price makes a breakout at the last swing. This is an ideal chart for the buyers to look for buying opportunities. They are to buy the pair on the pullback. Let us proceed to the next scene.

The price starts having a correction and comes back up to the breakout level (the last swing high). It produces an engulfing candle, which is a strong sign that it may keep going towards the upside, makes a breakout, and offers a long entry.

The price does not find a strong buying momentum. It goes towards the upside and comes back again to the support. It seems the buyers may have to wait longer than they thought.

Things look a bit different now. Rather than making an upside breakout, it has a strong rejection at the resistance. The support is being tested again.

No downside breakout, but the support holds the price. The price gets caught within two horizontal levels. To be precise, the price gets caught within a rectangle. Ideally, both the sellers and the buyers love to keep this chart in their watch list; get a breakout at either side to take an entry.

Two consecutive bullish candles right at the support suggest that the buyers have the upper hand. The buying momentum looks good here. If it continues going towards the upside and makes a breakout, the buyers may dominate here. Let us see what happens next.

Oh no, the price heads towards the North with less buying pressure. The bullish move has much less speed than the last bearish move. This sort of price action usually makes the price have another bearish move and head towards the support. Let us find out what happens next.

An upside breakout this is! After the breakout, if the price consolidates and makes another bullish move from the breakout level, it would be a buying market again. However, the question is whether it makes the buyers interested in buying or not.

  1. The last bullish wave does not have the drive.
  2. The resistance level is strong

Let us find out what happens next.

It does not produce a bullish reversal after the breakout. Instead, it comes back in. The breakout is not valid anymore. What may have been a strong buying market has become a choppy market again.

The Bottom Line

The breakout may have offered us entry if it produces a bullish reversal candle at the breakout level. That does not happen. We cannot precisely tell why that happens here. However, the less momentum to begin the potential trend is one of the reasons among many. It represents that psychologically, the buyers are not confident about the breakout and continuation, which makes that a nullified breakout in the end.

Categories
Forex Price-Action Strategies

Using Multiple Time Frames in Trading

Price action traders combine multiple time frames to trade. In most cases, they use a time frame to determine the trend and use the next one to trigger an entry. The most important factor in using multiple time frames is the combination. Usually, the combinations are Daily Chart with H4 Chart, H4 Chart with H1 Chart, H1 Chart with 15M Chart, and 15M Chart with 5M Chart. In today’s lesson, we are going to demonstrate an example of the combination of Daily and H4 Chart produces an entry.

This is a daily chart. In an uptrend, the price had a pullback. It produces a Doji candle followed by an engulfing candle (arrowed). The buyers may want to draw a support level here. Please note, it is not a Morning Star.

It is neither a Moring Star nor a Double Bottom. The price heads towards the North with good buying momentum. Many of us may think we miss an opportunity. The pair may have offered entries on minor time frames, but the daily chart does not provide anything yet.

Here we are. The price heads towards the support again. As far as the Daily chart is concerned, the price had a bounce at the level earlier. Thus, if the level produces a daily bullish reversal candle, the buyers are going to get themselves busy to look for long opportunities. Let us proceed to find out what happens next.

The last bearish candle closes within the marked level. This is a sign that the price may obey the support. However, we never know unless it produces a bullish daily reversal candle.

Here we are. The level produces an Inside Bar. It is not a robust bullish reversal candle. Nevertheless, it is a reversal candle. Do you know what the price action traders do next? They flip over to the H4 chart. Have a look at the H4 chart.

Since we are analyzing the daily chart, the trigger chart shall be the H4 chart. The H4 chart shows that the price is on consolidation. The buyers need to wait for bullish momentum.

The chart produces an H4 bullish reversal candle, although the resistance is still intact. Thus, the buyers need a breakout at that level. They must wait for it.

Here it comes. A Marubozu bullish candle breaches the resistance. The buyers may trigger a long entry right after the candle closes. Let us proceed to find out what the price does next.

As expected, the price heads toward the North with good buying momentum. There is enough space for the price to travel. It may go further North as well. Anyway, let us concentrate on what we have learned from these examples.

  1. Using multiple time frames is one of the key components of price action trading.
  2. The right combination of multiple time frames is essential.

We are going to learn more about using multiple time frames in our forthcoming lessons. Stay tuned.


Categories
Forex Price-Action Strategies

What Is Rectangle and How to Trade on It

The price after making a strong bullish or bearish move, it makes correction/ consolidation. The price consolidates within two horizontal lines. In the financial market, this is called Rectangle. In today’s lesson, we are going to demonstrate some examples of the bullish and bearish rectangle.

Let us start with a bullish rectangle.

The price heads towards the upside with good bullish momentum. At the top, the price seems to start having consolidation. A buyer may want to keep an eye for an upside breakout to go long from here. However, the price continues to consolidate.

The price consolidates within two horizontal lines. We can draw a rectangle here since the price produces the rectangle after a bullish move, so it is called ‘Bullish Rectangle.’ Traders are to wait for a breakout to take an entry. A downside breakout offers a short entry, and an upside breakout offers a long entry. Let us find out which way the next breakout takes place and the price heads to.

The price makes a downside breakout and heads towards the South. At rectangle breakout, the price usually travels at least the same distance of the consolidation length. It seems the price travels 1.5X distance of the consolidation length here. Let us concentrate on the next chart below.

The price consolidates getting trapped within horizontal support and resistance. Do you find anything interesting here? Yes, we find another rectangle. This time it is a bearish rectangle. Let us draw those two lines here.

Again, traders must wait for a breakout to find out its next direction. The price has several bounces and rejections within those two horizontal lines. It is a bearish rectangle, but we know a breakout can take place either way. There is no point in guessing. Let us wait and find out.

The price makes a downside breakout and heads toward the South with good enough selling momentum.

We have demonstrated two examples here. The first one is a bullish rectangle where the price makes a downside breakout. The second one is a bearish rectangle, on which the price makes a downside breakout as well. Breakout direction does not depend on the bullish or bearish rectangle. Trader’s job is to wait for the breakout and breakout confirmation. Entry is to be taken only when the breakout is confirmed. We can spot rectangles almost in all the time frames. However, it is often seen on the H1, H4, and Daily charts. Have some practice on the demo account or do some backtesting to get well acquainted with the pattern to make green pips.

Categories
Forex Basics

Even a Combination of Double Top and Engulfing Fails

Double Top/Double Bottom is one of the most robust patterns that price action traders wait to take entries. When the price is rejected twice at a resistance level, it forms a Double Top. As far as the candlestick pattern is concerned, an engulfing candle is the most reliable reversal candle that traders usually love to take an entry from a value area.

A combination of Double Top and a bearish engulfing candle attracts sellers to go short. Since it is an outstanding price action combination, it does not usually go wrong. However, in today’s lesson, we are going to demonstrate that even a great flourishing price action combination can go wrong, as well.

The price consolidates at the marked resistance and heads towards the downside. It then goes back towards the resistance. The sellers are to get ready to get a bearish reversal candle. The red-marked level is the resistance level, where we don’t consider the upper shadows. Since the price has several rejections at the marked level, and it is a valuable area for the sellers, the price most probably may respect the area and produce the bearish reversal candle.

The price does not respect the red-marked level, but it does not make an upside breakout either. Instead, it closes within the upper shadows. Traders are to adjust here. Let us see how it looks now.

The level where the last candle closes has some significance. One of the bullish candles closes within the marked level. This level may work as a resistance level and ends up producing a bearish reversal candle.

Here it comes. The Double Top’s resistance level produces a bearish engulfing candle. We have found the resistance level at last. So all the equations to go short from here seem to match as far as price action trading is concerned.

  1. The price produces a Double Top.
  2. The price produces a bearish engulfing candle right at the resistance of the Double Top.

The swing low is far enough, which offers good Risk-Reward as well. All seems to be okay to trigger a short entry.

After triggering the entry, the next candle comes out as a bearish Doji candle. Things still look good. The sellers are going to grab some green pips!

No! The next candle comes out as a bullish Marubozu candle, which breaches the resistance of the Double Top. It wipes off the Sellers Stop Loss. The buyers may take control once the breakout is confirmed.

The Lesson

It does not matter how good a trade setup looks: it may fail. Thus, there is no reason to be too optimistic about any entry. We must calculate our Risk-Reward and have immaculate risk management with every single entry that we take in the market.

Categories
Forex Price Action

Price Action, Market Psychology, and Adjustment

Price action traders are to get clues from what the price has been doing. Horizontal Support/ Resistance, Trend Line Support/Resistance, Fibonacci Levels, Equidistant Channel along with Candlestick Pattern are price action trader’s main weapons. A trader must know how to use these tools as far as price action trading is concerned. Moreover, traders often need to adjust to marking levels, which are to be integrated with price action and market psychology. In today’s lesson, we are going to show an example of that.

The price has been heading towards the downside with strong bearish momentum. Ideally, traders are to look for short opportunities at upside pullback. See the first reversal candle. The candle closes within the support of the last bearish candle. Thus, the traders must wait to go short since the support holds the price. Let us see what happens next.

At the last candle, the price goes towards the downside but comes back within the support again. Equations are different now. Long lower shadow and proven support suggest that the traders may have to wait longer than they thought.

As expected, the price consolidates on choppy price action, which makes traders wait. Traders find horizontal support. Let us draw it.

The price obeys the support level several times. However, do not forget that the price had a strong rejection. This is where traders may need to make an adjustment.


The price has been heading towards the adjusted support. Risk-Reward does not look right here. It is better to wait for either a downside breakout or a bullish reversal to go long. Let us see what happens next.


We have a bullish reversal here. A bullish engulfing candle right at the support level suggests that the traders may have to look for long opportunities here. The question is, shall we take an entry right after the last candle closes or not. The answer is ‘No”. We have to wait for an upside breakout. Can you guess where the breakout level is? Think for a minute, and then proceed to the chart below.

The price has been obeying a down-trending Trend line producing a Descending Triangle. Thus, the breakout at the Trend line resistance is a signal to go long here. All the buyers need here a breakout by a bullish Marubozu candle.

Here comes the breakout that the price action traders shall wait for. The buyers may trigger a long entry right after the breakout candle closes. Stop Loss is to be set below the horizontal support. Let us find out how it proceeds.

The price heads towards the North and provides 1:1 Risk-Reward. So far here, it seems that it is having consolidation. Some traders may want to come out with their profit. Some may shift their Stop Loss at the breakeven and take some profit out targeting to go all the way towards the swing high. This depends on how a trader wants to manage his trade. With these above charts and examples, we have realized the importance of adjustment in marking support/resistance.


Categories
Forex Price-Action Strategies

When A Breakout Occurs by More than One Candle

Price action traders’ main job is to watch the price action and find out the message out of it. The message comes from candles, various charts, momentum, as well as the attributes of breakouts. In this lesson, we are going to demonstrate an example of a breakout, which occurs with more than one candle. Let us find out whether a breakout with multiple candles gives us any message or not.

The price finds its support at the marked level and heads towards the North with good buying pressure. Price action traders start eyeing on the pair to go long on the pair. The first thing they would want is consolidation. Let us proceed to the next chart.

It seems that the price may have started having a pullback. The price is to come about 38% of the trend’s length to attract the buyers to watch for an upside breakout. Let us see what happens next.

The last candle seems to have covered a good distance. The buyers are going to be keen to get a bullish reversal candle on the chart now. If a reversal candle makes a breakout itself, it attracts traders more. Eventually, it pushes the price towards the trend’s direction at a good pace. Let us find out what happens here.

Here it comes. The bullish reversal candle is here. It is a ‘Track Rail,’ which is the second strongest reversal candle after the Engulfing candle. Traders are to wait for an important event. You know what that is, right?

‘The Breakout’!

The breakout occurs here by a Marubozu candle. Price action trader shall trigger a long entry right after the candle closes. Before triggering the entry, a trader must know where to set his Stop Loss and Take Profit. Stop Loss level is obvious here, which is below the support of the consolidation zone. Where the Take Profit level is to be set? Ideally, a 1:1 risk-reward ratio is the first target in any entry. However, there seems to be enough space for the price to travel. We may go for 1:2 risk-reward here. Does a trader go for a 1:3 risk-reward ratio or even more here? We get the answer later. Meanwhile, let us continue watching the drama.

The plan seems to be working amazingly well. The price heads towards the North with good buying momentum. 1:1 risk and reward ratio is easily achieved within the next candle. 1:2 risk-reward is achieved as well. Some may start splitting the hair for not setting the target with a 1:3 risk-reward ratio. Let us proceed.

The price has produced an Evening Star. This surely is not a good sign for the buyers. Those who set their Take Profit with a 1:3 risk-reward ratio must be in a pensive mood.

The price does not hit the Stop Loss, but there is no profit left for the buyers that are holding the positions. Targeting a 1:3 risk-reward ratio does not bring more pips. It rather makes them lose some pips that they could have earned.

Price Action breakout attributes suggest that if a breakout occurs with multiple candles, the trend often loses its impetus early. Thus, it is best to target 1:1 (in most cases), 1:2 (if there is enough space) risk-reward ratio when a breakout occurs by more than one candle.

Categories
Forex Price-Action Strategies

Breakout by a Single Candle Generate More Impetus

Breakout is one of the most important factors in trading. Attributes of a breakout give clues with what traders can manage their opened position to make more profit. Price action traders, in particular, love to compute the attributes of a breakout to determine their take profit level.

In this section, we are going to demonstrate an example of a single candle breakout and its impact afterwards. Have a look at the chart below.

The price finds support at the red market level and heads towards the North. The price action suggests that the buyers are going to control the pair. A downward correction/consolidation followed by a bullish reversal candle at a value zone is what they need to wait for. Let us find out what happens next.

The price seems to have started having a pullback. The first corrective candle comes out as an Inside Bar, which is a good sign for the buyers. The buyers wait for the price to come back at a level of support with a reasonable distance from the resistance. Let us see how far it comes up to.

The price has crossed a good distance from resistance. The buyers are to wait for a bullish reversal candle. Ideally, a bullish engulfing candle is the first choice for the buyers. Other candles such as Inside bar, Spinning Top do the job as well, but an engulfing candle’s signal attracts more traders, and it brings more liquidity. Let us see what happens next.

Price action traders dream of such a reversal candle. This is not only a bullish engulfing candle but also an engulfing candle, which breaches the highest high of the last wave. Let us draw the consolidation zone on the chart.

The reversal candle makes the breakout with good momentum. A trader shall trigger a buy entry shall right after the candle closes. When a reversal candle itself makes a breakout, it makes the fore coming move go towards the trend’s direction with good momentum. Look at the chart below.

Look at the pace of the bullish move after the breakout. Here is another very important factor that traders must remember. A single candle breakout usually offers a 1:2 risk-reward ratio. This means traders shall add some extra pips with their profit target when they get such price action. The drama remains. Have a look at the chart below.

The price makes a correction and seems to have found support again. It suggests that the buyers are still in control. Smart buyers take their Partial profit and let the rest of the trade run to earn more pips.

As mentioned, breakout attributes give clues about the trend’s strength. Eventually, this helps traders manage their trade nicely and make more money out of trading.

Categories
Forex Price Action

Equidistant Channel Trading: What Else to Consider?

Equidistant Channel is a very reliable trading tool for the price action traders. In an ascending Equidistant Channel, the buyers wait for the price to come at the support level and to get a bullish reversal candle to go long. It is vice versa, in the case of a descending channel. However, some other equations are to be taken care of by the traders when trading with an Equidistant Channel. In today’s lesson, this is what we are going to demonstrate. Let us get started.

The chart above shows that the price is caught within an ascending Equidistant Channel. Look at the last bearish wave. After a rejection, the price heads towards the support. As a trader, we shall wait for a bullish reversal candle to go long here. Let us proceed to find out what happens next.

Wow! The price action traders always dream of this. This is one good bullish reversal candle. A bullish engulfing candle right at the channel’s support, the buyers, shall jump into the pair to start buying. However, we must set stop loss, take profit. Stop Loss level looks very evident here, which will be below the signal candle (Bullish Engulfing Candle here). What is about the Take Profit level? Where shall we set it? Typically, we set it at the upper band of the channel since the price usually goes towards the resistance of the channel after having a bounce at the support level.

Look at the chart. At the last wave, the price produced a bearish engulfing candle right at a strong horizontal resistance (arrowed). It had a rejection at this level earlier, as well. Thus, this is a level, which must be counted at the time of setting Take Profit level.

Despite having an engulfing daily candle, the price does not head towards the North with a good buying pressure. Anyway, it heads towards the upside. Look at the rejection. This means setting our take profit at the horizontal resistance would give us 1:1 risk and reward ratio here. This is not bad. However, if we make a target to go all the way towards the upper band, it may get us a loss instead.

Let us see how the price action acts afterward.

We would not make a loss here, but see how the price action has been. It gets choppy. It may still offer more long entries since the support is held by the price. However, we know what else is to look for, a breakout at a significant level of horizontal resistance.

Key Points to Remember in Equidistant Channel trading:

  1. A significant level of horizontal support/resistance is to be broken.
  2. If there is no horizontal support/resistance, an anti-trend line is to be broken.
  3. The signal candle is to be a strong trend reversal candle.
  4. In the case of having horizontal support/resistance in the middle of a channel, at least the Risk-Reward ratio is to be 1:1.
Categories
Forex Price Action

Retracement, Consolidation, Breakout, and Price-Action Trading

In the financial market, there is a saying, “Trend is your friend.” When the price makes a strong move towards a direction breaching a significant level of support/resistance, traders start looking for opportunities to take entries. The word ‘opportunity’ signifies a lot. After making a strong move, the price usually makes a correction/consolidation. At the correction/consolidation, the price finds a level of support/resistance. This is what gives a good risk-reward ratio to traders. In the end, it brings more winning trades, as well. In this lesson, we are going to demonstrate how a retracement gives us an entry.

The price produces a Double Bottom and breaches the neckline level. The buyers are to look for opportunities to go long on the chart. Look at the last two bearish candles. The price seems to have started having a correction. The last candle closes within the support. We might as well get a buying opportunity here. A bullish reversal candle at this level shall attract the buyers to go long. Let us see what happens next.

A bullish engulfing candle is produced here, which is considered the most powerful reversal candle. We have been eyeing to buy. Make a decision. What shall you do? Are you going to click the “Buy” button? Hang on. You must consider an equation before going long here. Look at the chart below.

The bullish reversal candle is produced at a level of support where the price had its last bounce. This is consolidation where the price is caught in a range. Thus, until the price makes a breakout at the resistance, we must not buy. Let us look at the chart below to find out what happens next.

The price comes out from the consolidation zone by making a downside breakout. It seems that the price is going to have a long retracement. Honestly, it appears that the buyers may not get the opportunities to go long. The price has been heading towards the South by making an ABC pattern, and the bullish trend is about to collapse. A down-trending Trend Line works as a resistance as well. Then, this is what happens.

We have a massive bullish engulfing candle at the level where the price has had several bounces. This is the candle, you may click the “Buy” button, right after it closes. A question shall be raised here that we do not take the long entry at the first bullish engulfing candle, but we do it now. What is the reason behind that? Before answering the question, look at the chart below.

The signal candle this time makes a breakout at the down-trending Trend line. This means along with a strong bullish reversal candle, we get a breakout as well. This is what makes the price action traders click the “Buy’ button this time. Let us have a look at the chart how it looks after clicking the “Buy” button.

It looks good. The price heads towards the North with good buying pressure. This is what we love to see. However, this does not come as easy as it sounds. The first bullish engulfing candle does not offer us entry, but this one does. The reason is it makes a breakout. We need to have a lot of practice, study, and research to be well acquainted with consolidation, correction, reversal, and breakout. Stay tuned to get more lessons on these topics.


Categories
Forex Basic Strategies

Trade Breakouts Like A Pro With This ‘Breakout Trading Strategy’

Introduction

In previous strategies article, we have discussed the ‘Turtle Soup Strategy by fading the Donchian channel.’ We hope you tried that strategy. In today’s article, let us discuss how to trade breakouts. We will also cover some of the best strategies used by professional traders to trade breakouts. Aggressive traders prefer trading this Breakout strategy compared to the conservative ones.

What is breakout trading?

To understand breakout trading, it is necessary to know the two important types of breakouts.

Defining a breakout

Breakout trading is an effort to enter the market when price moves outside a defined price range. The price range could be between support and resistance or between swing high and swing low. It is good if the breakout is accompanied by high volume.

Breakout of support and resistance

This type of breakout is quite simple and straight forward. The breakout of support and resistance should ideally happen with a big and bold candle. Because that shows the genuineness of the breakout. In the below chart, the candle closes well above the support and resistance level. In the below figure, it can be noticed instantly. A rule of thumb is that the bigger the breakout candle, the better it is.

Breakout of swing high and swing low

Very similar to the support and resistance breakout, this type of breakout has an additional filter. The filter is nothing but to trade the setups that offer the best outcome. In a swing high and swing low breakout, we enter the market after the price crosses a long-time high (1hr or 4hr high). That high should be followed by a strong sell-off. Conversely, the same is true for a swing low.  A trader must backtest their strategy before applying them to the live markets.

Best Breakout Strategy

To increase the accuracy of the signals generated by this strategy, we use an indicator known as Volume Weighted Moving Average (VWMA). It is a very simple technical indicator that is used for volume analysis. It resembles a moving average but is based on volume. It gives extra information than just the price of an asset. This indicator can be found on most of the trading platforms by default, and when plotted, it looks something like this.

Step 1: Identify the swing highs from where the market sold off very strongly and traveled a fair amount of distance. Mark that price on the chart.

The first step of a breakout strategy is to identify those levels and mark them as breakout trading levels. This step is important because we should pay attention to only significant and clear levels.

The resistance level we have identified in the above figure is a significant level. If you look closely, you will see rejection off the resistance level took the price down three times. Whenever there was a rally, the swing high stopped the price.

Step 2: Wait for a break and close above the resistance level

Once we have identified the swing highs, it’s just a game of patience and waiting. Next, we need a breakout candle to close above our resistance level. This is a sign that bulls are in full power.

It is not the end yet. We need confirmation from the VWMA indicator. This will give us the green signal to enter the trade in this breakout.

Step 3: Buy when the price closes above the VWMA

The final step of the breakout strategy is confirmation from the VWMA indicator. You should buy only if the VWMA is stretching above the close of the breakout candle. Visually, the VWMA should look stretched up. It is better if the moving average inclination is towards the upside.

Let’s understand this more clearly with the help of a chart.

In the above chart, prior to the breakout, the VWMA moved gradually higher, and after the breakout happened, the VWMA moved aggressively higher. This shows a strong presence of volume behind the breakout.

We haven’t still talked about placing our stop loss, which is crucial to reduce your losses in a trade. We also need to know where to book profits. This brings us to the final step of the strategy.

Step 4: Put stop loss below the breakout candle and take profit when you see a break below the VWMA

It is obvious to place the protective stop loss below the breakout candle. Because, if the price breaks below the candle that initiated the breakout, it will quickly tell that it was a false breakout.

Our take profit technique is automatic because a break below the VWMA suggests no more buyers are willing to participate in the current rally. We want to book profit at the early sign of market rollover.

We have taken the example of a buy trade. The same rules apply for a sell trade but in reverse. The best breakout strategy can be used in all market trends, whether up or down.

Bottom line

One of the advantages of our breakout trading strategy is that you’re trading with the momentum of the price. A final tip for all the traders while using this strategy is that, if the breakout happens after a big news event, then it is likely that big institution money is behind this breakout. When both fundamentals and technicals are working for you, the probability of success increases. We hope you find this strategy useful. If you have any questions, please let us know in the comments below. Cheers!

Categories
Forex Price Action

A Breakout-caused by a Gap – Anything to Offer to the Price Action Trader?

In today’s lesson, we are going to demonstrate an example of a breakout created by a gap or price adjustment. Usually, we get a gap at the start of a new week. Extremely high impact news events make charts have a gap too. Price action traders do not like the gap. Gap usually provides fewer clues which lead the market to be in a range. However, it sometimes may create opportunities by making a breakout. Today we are going to see how a gap makes a breakout at the support of an up-trending trend line and offers us an entry. Let us have a look at the chart below.

A strong uptrend is pushing the price towards the North. In this chart, traders shall look for opportunities to go long. Along with horizontal support, we shall draw an up-trending trend line here.

The buyers shall be more confident now. On the other hand, the sellers are to wait to get a downside breakout. In this case, the trendline has been a vital element. Thus, a trendline breakout may attract sellers to look for short opportunities. Have a look at how the breakout takes place here.

The breakout should have been done with a good-looking bearish candle. We do not see any here, but the price stays below the trendline. There has been an adjustment or price gap which has made the breakout. The question is do we consider it as a breakout?

The first sign of a downside breakout is the price goes past a support level. We have that here. Do you see that the price starts having an upward correction after the breakout? It closes within the flipped support of the trendline. This is the confirmation of a breakout. This means we have a confirmed breakout here which is done by a gap meaning the gap creates an opportunity here.  Everything looks good so far. The price action traders are to wait for the final signal to go short. Can you guess how it may look like? Close your eyes for twenty seconds and think about the signal candle that you may want to have here. Open your eyes and have a look at the chart below.

See how strong the last candle looks. This is the signal candle that the price action traders always dream of. A short entry may be triggered right after the last candle closes.

Let’s now have a look at how the chart looks like after triggering the entry.

Looks good right. It does, but there has been an instantaneous upward correction. That may have created some butterflies in the sellers’ stomach. The price is held way above the signal candle’s resistance and in the end, the price heads towards the South with good selling pressure. The bottom line of the story “A breakout which is created by a gap helps the price action traders grab some green pips”.


Categories
Forex Price Action

An Entry Derived from a Double Bottom

The Double Bottom is one of the strongest bullish reversal patterns that price action traders wait for once they see the price may have found a support zone. On a strong downtrend, the first bounce does not attract the buyers to go long. On the second bounce, however, it attracts the buyers to start looking for long opportunities. In today’s lesson, we are going to demonstrate an example of how a Double Bottom offered us an entry.

What do you think about the price action here? A choppy price action where the price gets caught within a horizontal range. It is best to avoid taking entries when the price action is like this. You may have noticed that the price has several bounces on the support and rejections on the resistance. To get a clearer picture, look at the chart below.

The price has a rejection of the resistance and a bounce on the support. The price goes up again; it had a rejection and a bounce on the same level. This means we may get a Double Top or a Double Bottom here. The chances are the same. Thus, we must wait for the price to make the decision.


Here it goes. An upside breakout takes place here. A Double Bottom and  Breached Neckline, a perfect buying meadow. Do we start buying from here? No, we must wait for a confirmation. A pullback and another bullish move are needed to go long. See what happens next.

It seems like we may not get an opportunity to trigger an entry here. The price continues to go towards the North. Do not get into a trap. Never jump into a running train. Keep patience. See what happens next.

Here it goes. Finally, the price starts having a correction. Look at the last H4 bearish candle closing obeying the level where the price on minor time frames has bounces. It is time to wait for a bullish reversal candle. Is it going to be the very next candle or do we have to wait longer?

It is the very next candle that signals us that it is the time to trigger a long entry. The candle closes above the consolidation resistance having a tiny upper shadow. A perfect signal candle that the buyers have been waiting for.

The price heads towards the North with good buying pressure. 1:1 Risk and reward is easily achieved here. Such a nice price action this is! I have a question to you though. Do you see any other potential buying opportunity here? If you do, write on the comment box what the price action would be like if it is to offer another long entry. I am looking forward to getting your comments.

Categories
Forex Price Action

How a Broken Resistance Offers Us an Entry

In today’s lesson, we are going to demonstrate an example of how the price heads towards the direction of the trend upon a breakout. We know that it is not only the breakout that traders shall be looking at. There are other factors, such as consolidation or correction, breakout confirmation, and the signal candle. Let us have a look at what the price does before offering us an entry.


The price heads towards the North and has a rejection. Look at the candle at the top (arrowed candle). This is where the price has its first rejection and lands at the support zone. The price has another rejection at the level below (arrowed candle). However, it continues the consolidation. As a trader, you have to wait for a price to make a move either to make a breakout at the support of the consolidation or the resistance level.  Let’s see what happens next.


Oh! Upside breakout! This is how a breakout candle should look like. It closes just below the second resistance. The first resistance is now a support. The price is to make a pullback to confirm the breakout. Let us see what happens next.


It rather continues its bullish journey and makes a breakout at the second level of resistance as well. Guess what shall we do here? Shall we wait for the price to come back to the first breakout level or the second breakout level? Have a look at the chart below.


The breakout level seems to be held and produces a bullish candle already. Shall we consider taking an entry here? The answer is no. The price does not come up to the breakout level. Let us see what happens next.


Look at the last candle. A bullish engulfing candle closes above the last highest high and confirms the breakout level by having a bounce on it. This is the signal candle price-action traders crave for. A buy entry may be triggered right after the candle closes by setting Stop Loss below the candle’s lowest low. In this case, the candle’s lowest low and breakout level are the same. If the signal candle had a bigger lower shadow below the breakout level, the Stop Loss should have been set below the candle’s lowest low.

About setting Take Profit level, there are several ways to determine it. To be very safe, you may have 1:1 risk and reward. This means the number of pips that we have set as our Stop Loss from the entry point; we shall set our Take Profit at a distance with the same amount of pips.

The price travels almost twice the distance than we have anticipated. Never regret, but keep studying to learn how to maximize your risk and reward ratio. We will write some articles on this. Stay tuned.

Categories
Forex Candlesticks

Ideas that can be Blended with Candlestick to Trigger Entries-Part4

In this article, we are going to demonstrate how a Morning Star offered us an entry. We know Morning Star is a strong bullish reversal candle, which is a combination of three candlesticks. There are two types of Morning Star.

  1. Morning Star
  2. Morning Doji Star

Here is how Morning Star looks like

And this is how Morning Doji Star looks like

The example we are going to demonstrate is a Morning Doji Star. Let us get started.

The price was down-trending and produced a Doji Candle on a support level where the last bearish candle closed within. Look at the very last candle. It came out as a Bullish Marubozu Candle closing above the 2nd last candle’s open. This is a typical example of Moring Star upon which buyers shall start integrating other equations to go long.

Let us have a look at those equations.

At first, we have to draw a level of resistance here. Let us draw it.

We draw the resistance line right where the candle closes. Since we do not have any down-trending Trend Line or a Double Bottom’s neckline here, thus we must wait for a trigger candle to close above the bullish candle on the trading chart.  We now have to flip over to the trigger chart. This is an H4 chart, so let’s flip over to the H1 chart to get correction/consolidation and breakout.

This is how the H1 chart looks. The first H1 candle came out as a bearish corrective candle, and the very next one closed above the bullish H4 candle’s close. A perfect trigger candle, we shall wait for. We sometimes may not get the corrective candle here. The very next H1 candle may breach the resistance line and offer us the entry.

In our previous article, we demonstrated an example of how a Bearish Engulfing Candle offered us an entry. Have you spotted out the difference between a single candlestick pattern and a combination of candlesticks pattern’s entry?

On a single candlestick entry, we had to wait for a neckline breakout (it may be trend line breakout), consolidation (on the trading chart), bearish reversal candle (on the trading chart), then the breakout (trigger chart). With Morning Star, we did not have to wait for consolidation on the trading chart. Once the combination pattern (Morning Star) was evident, we flipped over to the trigger chart; waited for a candle to make a new higher high to take an entry.

It may sound so many things to be remembered and integrated with candlesticks trading. However, once we practice and try to understand the market psychology that goes with those patterns, things will get as easy as you may like.


Categories
Forex Chart Basics

Ideas that can be Blended with Candlestick to Trigger Entries-Part 3

In Part 2, we learned how important a breakout is for taking an entry. Even the strongest reversal candle itself is not enough to create a new trend. In this article, we are going to learn other steps that we need to maintain for taking an entry in case of engulfing candlestick.

Let us have a look at the chart below.

After producing the engulfing candle,

  1. The price breached through a support level.
  2. The breakout candle looks very strong.

First two equations have been met. Shall we take the entry right now? The answer is “NO”. We must wait for an upward correction/consolidation. A correction/consolidation gives us another level of support/resistance (in this case resistance). It offers a better risk and reward ratio as well as a better winning percentage. Thus, correction/consolidation is considered one of the most vital components of trading.

Let us have a look at how consolidation took place here.

Pay attention to those candles after the breakout. The pair produced one more bearish candle. Many traders may think an opportunity missed here. Look at the very next candle. That came as a Doji Candle followed by a bullish one. Be very careful. The market often keeps having a correction and changes the trend even by making new higher highs. Thus, a bearish reversal candle we must wait for.

We got one and luckily, it was a bearish engulfing candle. Candle Stick Pattern is being used here again to show us selling sign. What do we have to do now?

We have to wait for another breakout. This time we have to flip over to our Trigger Chart. This is an H4 chart. Thus, our trigger chart is H1 Chart. Let us flip over to the H1 Chart.

The price came out with the last candle from the consolidation zone. A Marubozu Bearish Candle made the breakout. A less low spike indicates that the sellers are very confident. Look, Candle Stick Pattern is being used here again. Here we go. This is the point where we trigger out short (sell) entry.

Let us have a look at the chart below how our trade would play.

Wow, it played well. Though it had consolidation on the minor time frames later, however, this should not be our concern. We followed our trading chart’s trend, breakout, consolidation (H4) and the H1 breakout. By setting our Stop Loss and Take Profit, we shall forget the entry. This is another thing of trading called “Set and Forget” that need to be integrated.

In this article, we learned these are the things to be integrated as well.

  1. Consolidation/ Correction on the trading chart.
  2. Reversal candle to be formed on the trading chart.
  3. Flipping over to the trigger chart and waiting for a breakout.

In the next article, we are going to demonstrate an example of how a Morning Star offered us entry with the integration of consolidation, breakout, and breakout candle with a Morning Star. Stay tuned.

Categories
Forex Candlesticks

Ideas that can be Blended with Candlestick to Trigger Entries – Part 2

Candlestick Patterns are widely used by traders to take entries and making money out of trading. We have come to know from Part 1 that relying on a candlestick formation only is not enough for a reliable entry signal. Other things need to be integrated with candlestick formation so that traders can trade accordingly. In this article, we are going to demonstrate an example of how an entry should be taken depending mainly on an engulfing candle as well as other equations that need to be maintained by traders.

Let us have a look at the chart below.

The chart above shows that the market is up-trending. At first glance, we shall look for buying opportunities here. However, look at the last candle. This is an engulfing candle which indicates that the sellers may take over. An engulfing candle is a strong sign of a trend reversal. However, we must not get carried away, but wait for other indications. In this case, we may wait for a breakout at the last swing low. Have a look at the chart.

Pay attention to the red line. This is the last swing low where the price had a bounce and moved towards the North. Then, after finding a resistance, it produced a bearish engulfing candle; kept going down on the next candle and made a breakout with a huge bearish candle. This is now an ideal chart for the sellers to look for selling opportunities. The trend starts with an engulfing bearish candle. Candlestick pattern suggests that the sellers may take over. It has. It is pretty simple, right? Not really. Just go three candles back. Look at the same chart below.

Pay attention to the arrowed candle. This is a bearish engulfing candle as well. That could have changed the trend and the price could have headed towards the South. However, that did not happen. The price kept going towards the North for three more candles then came down. Do you spot out the difference? The price did not make any downside breakout. In this case, if it had made a breakout at the nearest swing low, it might have come down from right there. Look at the chart below to get a better idea of which level I am talking about.

The drawn red level was the last swing low. If the price continued to go down and made a breakout at that level, it would have been a different ball game.

In this lesson, we have learned that Candlestick Pattern is a sign. In fact, is the first sign of a trend reversal. However, we need at least two more things to integrate with Candle Stick Pattern for taking an entry. These are:

  1. A Breakout at a significant level of support or resistance.
  2. The breakout is to have good momentum meaning the breakout candle is to be a good-looking bullish or bearish candle.


Stay tuned to get to know more about candlestick and integration in Part-3.

Categories
Forex Candlesticks

Ideas that can be Blended with Candlestick to Trigger Entries-Part 1

Candlesticks are considered one of the strongest components to take an entry. However, this is not the only thing that a trader shall consider before taking an entry. An Engulfing Candle or a Pin Bar is a strong reversal candle. If the price is down-trending and we get a bullish engulfing candle, we may want to go long on the pair. No doubt, a bullish engulfing candle is a strong reversal candle, but there are other factors we must consider before taking an entry.

Let us find more about it from the charts below.

I have chosen a chart which was down-trending and produced a Bullish Pin Bar. The price then changed its direction and headed toward the North. Let us have a look at the chart.

The arrowed candle is one good-looking bullish Pin Bar. A Pin Bar like this attracts the buyers to go long. We see the consequence; the price headed towards the North with good buying pressure. Does this mean whenever we see a Bullish Pin Bar, we go long or vice versa? The answer is no. We must consider other factors such as Support/Resistance zone, Double Top/Bottom, Neckline Breakout, Trend Line breakout, Breakout Candle.

Let us have a look at the chart again.

See where the Pin Bar was formed. It was formed right at a zone where the price had several bounces. Ideally, this is a level where the sellers want to come out with their profit. Thus, a strong bullish reversal candle such as a Bullish Pin Bar shall attract the buyers to concentrate on the chart to go long. Now that we have found a strong support level what else to look for?

The price was down-trending by following a Trend Line. Can you spot that?

Have a look at this.

A down-trending Trend Line can be drawn. Buyers must wait for a breakout there. See the breakout candle. That was a strong bullish candle which was followed by another one. Moreover, the price came back and touched the Trend line after the breakout. Many buyers may have taken their entry there. This is not a bad idea. You may want to go long right after the second candle closes.

However, some buyers may want to go long at the neckline breakout. Have a look at the chart below.

To be very safe, some traders love to set a pending buy order and go long above the neckline level. It is a safer option for sure, but it has some disadvantages as well. We will talk about this later. Meanwhile, concentrate on what we have learned from this article.

  1. Candlestick or Candlestick pattern is to be formed at a value area.
  2. The existent trend is to be collapsed.
  3. Double Bottom or Double Top is to be evident.
  4. Breakout Candle is to be a strong commanding candle.


Categories
Forex Market Analysis

Forex and Indices – Daily Update – June 06th, 2018

Hot Topics:

  • US Trade Balance Falls.
  • Euro raises supported by ending bonds debate.
  • European Indices Move Sideways.

US Trade Balance Falls

The US Trade Balance deficit falls in April to the lowest level for seven months, boosted by the shipments of industrial materials and soybeans.

GBPUSD continues moving higher, aided by the weakness in the Dollar Index. For the coming sessions, we expect that the price makes a bearish connector, probably in the 1.348 zone before it sees new higher highs. Invalidation level is at 1.3254.

Today Forex Market Analysis


The USDCHF pair still moves sideways above the bullish long-term trendline. If the price breaks down the trendline, we expect more dips. In the first instance to the target should be 0.9783; in the second instance, the next support is 0.9725. Invalidation Level is 0.9983.


Euro Raises Supported by Ending Bonds Debate

In the next week, the ECB could start to debate the end of their bonds buying said Peter Praet, the ECB chief economist. This is not the first signal of the QE ending, on May 29th, the ECB member Sabine Lautenschlaeger noted that “June might be the month to decide once and for all to gradually end net asset purchases by the end of this year.”

EURUSD continued rising after the flag breakout and supported by the macroeconomic data. The next resistance levels are 1.1889, 1.19635 and 1.2102. Invalidation level is updated to 1.1616.


EURJPY continues its rally that started on May 29th when it tested the support 124.621. The first corrective structure it developed was brief, this move makes us suspect that the rally continuation could lead to the 132 to 133 area. In the short-term, the cross could see the 130.270 level for bringing steps to a consolidation structure before it continues the bullish cycle. Invalidation level is 126.330.


EURNZD is making a bullish connector inside a bearish major degree structure. Our vision is that the price could visit the area between the 38.2% to 50% of Fibonacci Retracement before it continues its downtrend. In the short-term, the price made a breakout of the 1.6713 level; this move could lead the price to areas between 1.6866 as first resistance and 1.6947 as the second resistance. Invalidation level is below 1.66.


European Indices Move Sideways

The FTSE 100 is moving in a range between 7,680 and 7,720, expecting more volatility. The price could make a limited high completing an A-B-C pattern before it continues the bearish cycle.


The DAX 30 is running sidelong but could complete three waves move in the zone between 12,946 to 13,014 pts before it continues the bearish sequence started on May 23rd, with the bearish target in the 12,528 pts area. If the price plunges below 12,386, the DAX could complete the bearish cycle near to the 12,000 pts. Invalidation level is updated to 13,102.7 pts. In case that price breaks above this level, the next bullish target is 13,250 pts.