Breakout plays a very vital role in the Forex market. Traders use breakout, breakout levels to make a trading decision. Fibonacci traders are to make sure whether a particular level is breached or it holds the price to make a better trading decision. In today’s lesson, we are going to demonstrate an example where Fibonacci traders may need to concentrate more to be sure about the Fibonacci level from where the price trends. Let us get started.

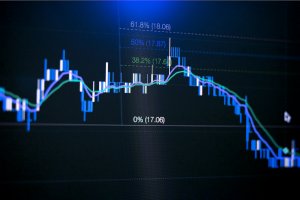
This is an H1 chart. The chart shows that the price makes a strong bearish move. It makes an upside correction followed by a strong bearish move again. The price has been having an upside correction again. Fibonacci traders are to draw the Fibonacci levels in the chart to find out where the price makes a bearish reversal and how far it may go up to.
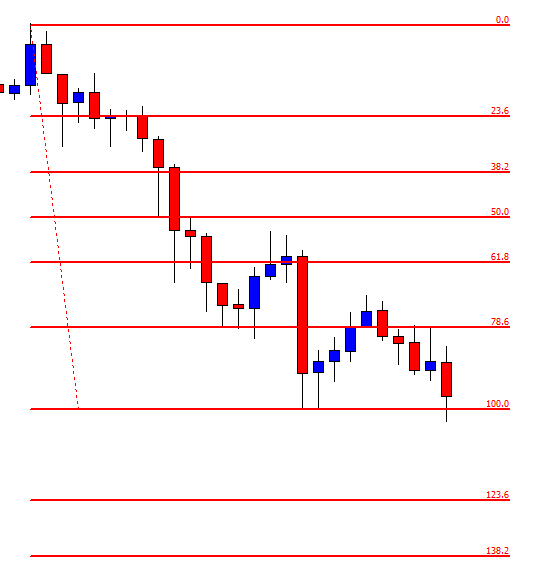
Here are the levels. The chart shows that the price produces a bearish engulfing candle and heads towards the South with good bearish momentum. The question is whether the price trends from 78.6% or 61.8%. It is a vital issue since the price heads towards either 138.2% or 161.8% based on these two levels. If we concentrate on the chart, we see one of the bullish candles closes above the 78.6% level. However, the price comes back within the 78.6% level with the next candle. This means the H1 chart does not make a bullish breakout at 78.6%. The sellers may plan their entries to go short up to 138.2% in this chart. Let us proceed to the next chart to find out what price does.
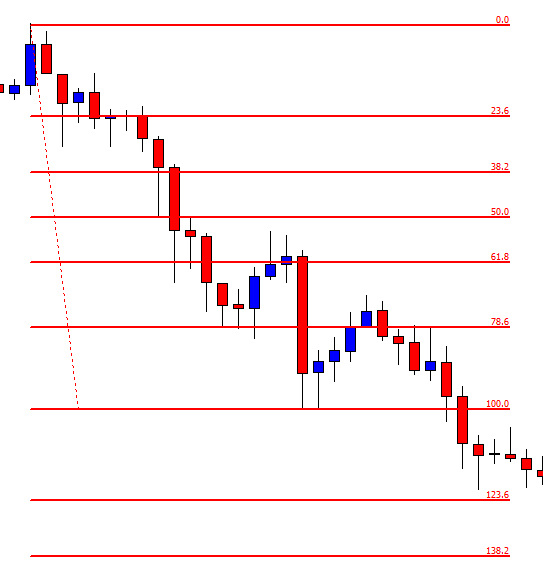
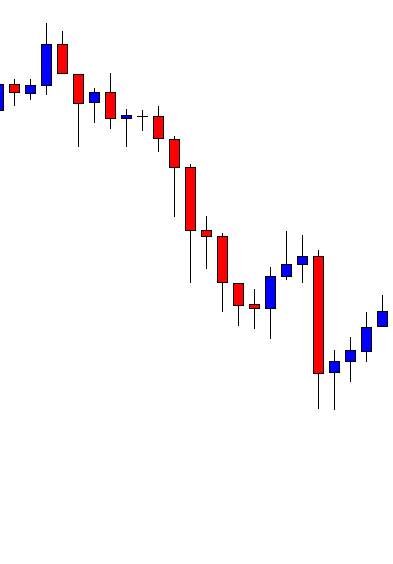
The price breaches the 100.0 level and trades below for several candles. The sellers may wait for a bearish reversal candle and go short in the pair as long as they are satisfied with the risk-reward factor. Usually, it is best if the price goes back to the 100.0 level and produces a bearish reversal candle around the level as far as the risk-reward ratio is concerned. However, it may be produced anywhere between 100.0% to 123.6%. The sellers with different strategies may set their stop loss at different levels, but their last take profit level is to be set at 138.2 %. Let us proceed to the next chart to find out what the price does next.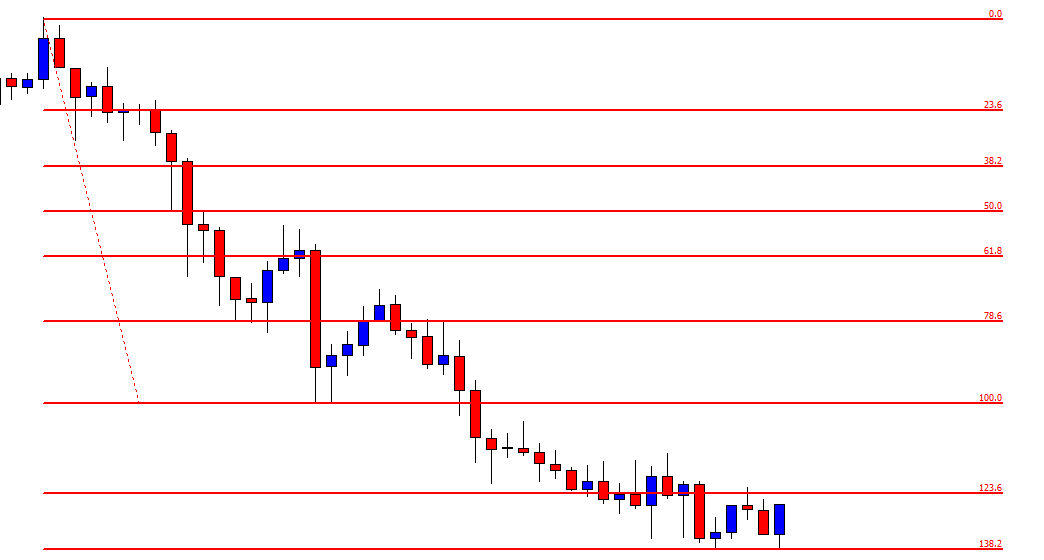
The chart shows that the price hits 138.2%. As expected, it has been roaming around the level. It seems that the price may have found its support around 138.2% level, and it may make a bullish reversal. The sellers with Fibonacci levels have completed their mission with perfection.