In today’s lesson, we are going to demonstrate an example of the H4-H1 chart combination trading where the breakout takes place, but the traders have to be sensible to spot out the breakout. Let us get started.
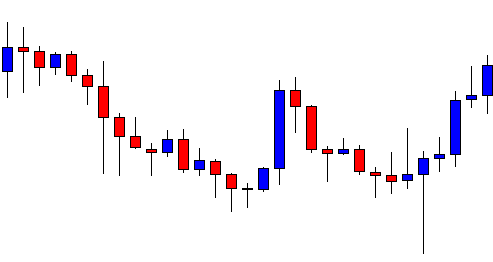
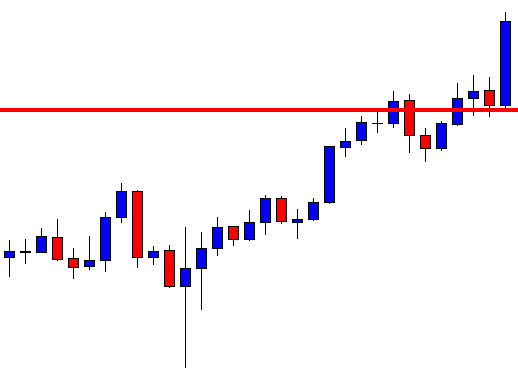
This is an H4 chart. The chart shows that the price heads towards the North upon having its second bounce at the level of support. Look at the last candle. The candle comes out as a bullish engulfing candle since it closes well above the body of the last candle. Can you spot something out here?
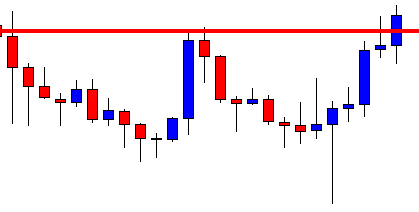
The candle closes well above the level where the price had a rejection earlier. The price reacted around the same level before producing the last candle. If we draw a level by using the significant level, which has been working as the level of resistance, we see that the last candle breaches the level. This means the piercing may be considered a breakout. Let us now flip over to the H1 chart.
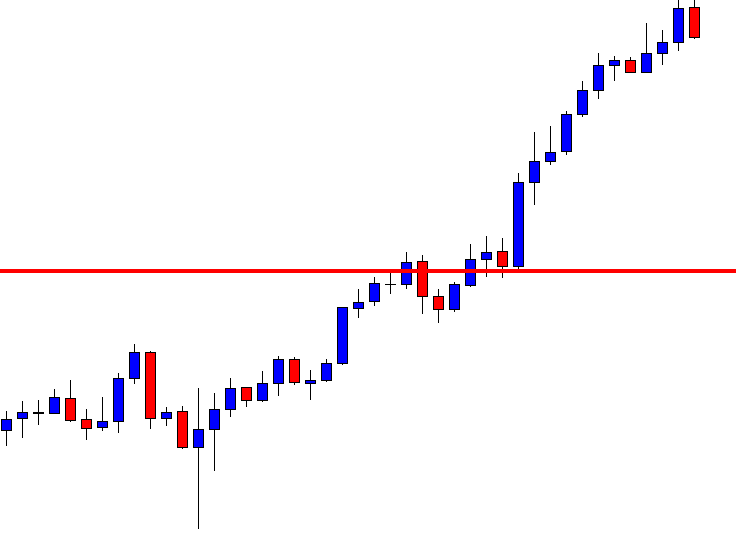
This is how the H1 chart looks. The chart shows that the last candle comes out as a Spinning Top. The H4-H1 buyers are to wait for the price to consolidate and to get a bullish reversal candle to go long in the pair. Let us wait and see what the price does.
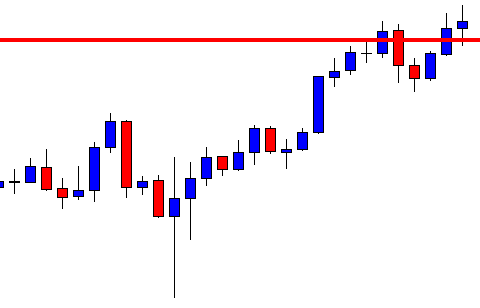
The chart produces a bearish engulfing candle closing within the breakout level. Look at the last candle. The last candle came out as a long bullish engulfing candle. The buyers may get huge confidence about the earlier H4 breakout and trigger a long entry right after the last candle closes. Let us now find out how the entry goes.
The price heads towards the North with good bullish momentum. The last candle comes out as a bearish Inside Bar. This action suggests that the Bull may continue its run. It is a bearish reversal candle (the weakest one). Thus, the buyers may consider closing their entry. In the end, this comes out as an excellent trade setup.
If we concentrate on the breakout, it is to be found out by the traders. Without drawing the horizontal line, it would be difficult to found that out. Thus, mark the points that are significant and keep looking at our charts. It would help you find out breakout and make the trading decision easily. Some breakouts may not seem like a breakout without drawing lines on the chart. Thus, pick your drawing tool to mark significant levels with horizontal lines/trend lines/channels on your trading chart and watch out how the price reacts around them.