
The Double Bottom is one of the strongest bullish reversal patterns. When the price gets its second bounce at the same level and makes a breakout at the last swing high, the pattern it produces is called the double bottom. In today’s lesson, we are going to demonstrate an example of a double bottom in the H1 chart. At the end of the wave, an interesting thing happens. Let us proceed and find out how the double bottom offers entry and what that interesting thing is.

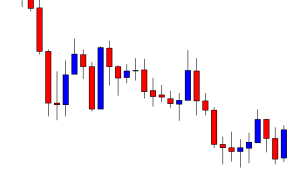
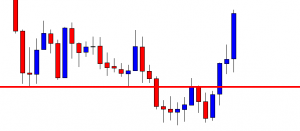
This is an H1 chart. The chart shows that the price has its second bounce and produces a bullish engulfing candle. Since the same level of support produces a bullish engulfing candle at the second bounce, it is going to have a strong impact on the market if it makes a breakout at the last swing high.
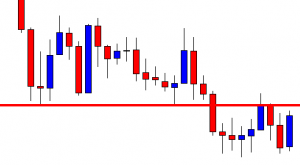
Here is the level of resistance, which the buyers are going to wait for a breakout to go long in the pair upon breakout confirmation. The price reacted at the drawn level earlier as well. Thus, this has been a significant level. The last rejection signifies it more.
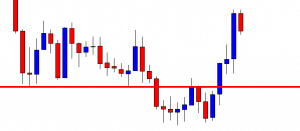
Look at the next candle. The candle comes out as a bullish Marubozu candle. The candle closes well above the level where the price had a rejection earlier. Some buyers may want to trigger a long entry right after the last candle closes. Some buyers may wait for the breakout confirmation to go long in the pair.
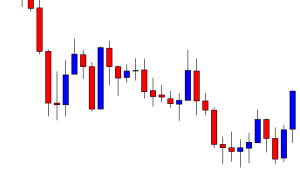
The next candle comes out as a spinning top with a tiny bullish body. The price closes above the last candle’s highest high. It confirms the breakout. The buyers may trigger a long entry right after the last candle closes since they have the breakout confirmation.
See how the price heads towards the North with good bullish momentum. The price hits 1R within one candle. The last candle suggests that the price may continue its move towards the North. Let us see what happens next.
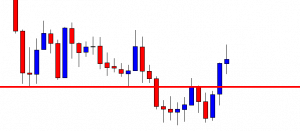
The chart produces a bearish inside bar. It suggests that the price is still bullish. If the next candle comes out as a bullish engulfing candle, the price may resume its journey towards the North with good bullish momentum. However, many buyers may come out with their profit and wait for the next bullish reversal candle to go long.
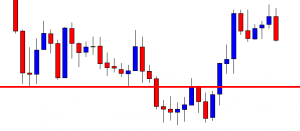
The price gets choppy within two horizontal levels. The last candle comes out as a bearish engulfing candle. Do you notice anything interesting here? Yes, the chart produces a Double Top this time, and it produces a bearish engulfing candle at the second rejection. The sellers may want to go short if the price makes a breakout at the last lowest low. This is how things change in the Forex market. It is interesting, is not it?