An engulfing candle makes a strong statement about the price reversal. The longer the body, the stronger the statement is. In today’s article, we are going to demonstrate an example of the daily-H4 chart combination trading, where the daily chart produces a bearish engulfing candle with a long bearish body. We find out what it has to offer to the sellers in the end.

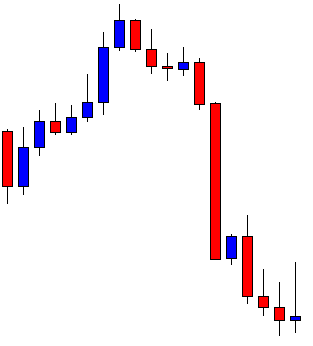
The chart shows that the price produces a bearish engulfing candle having a tiny lower spike. The body of the candle is a long one closing well below the last bullish candle. This is one good-looking bearish engulfing candle. Since it is the daily chart, the daily-H4 chart combination traders may flip over to the H4 chart to look for short entries.
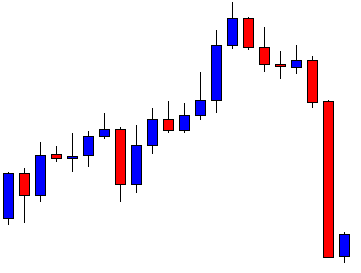
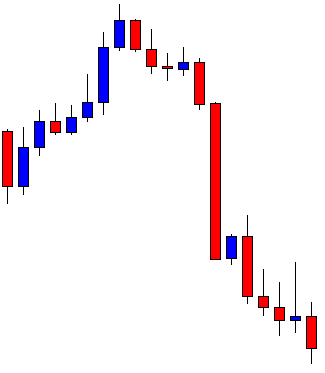
The above figure shows the H4 chart. We can see that the last candle comes out as a bullish inside bar. It means the price in the H4 chart may consolidate. The sellers are going to wait to get a bearish reversal candle to go short in the pair.
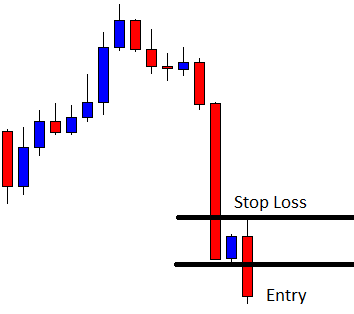
The last candle comes out as a bearish engulfing candle closing well below consolidation support. The sellers may trigger a short entry right after the last candle closes by setting stop-loss above consolidation resistance and by setting take profit with 1R. Let us now find out how the entry goes.
The next two candles come out as bearish candles. However, the price does not head towards the South as expected. Moreover, the last candle comes out as a doji candle having a long upper shadow. The sellers are to wait for the price to hit the target. The last candle does not convey a good message to the sellers.
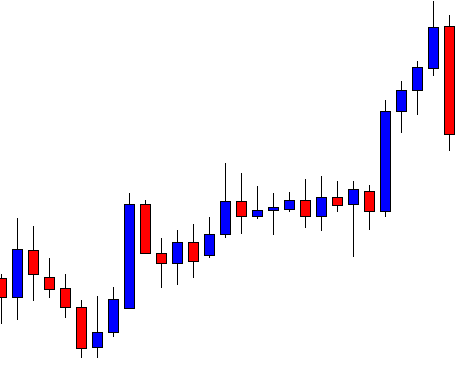
Here it comes. The last candle hits the target of 1R. The reversal candle in the daily chart is a very strong one. Do the sellers get anything extra out of it? Let us proceed to the next chart to see what the price does in the chart.
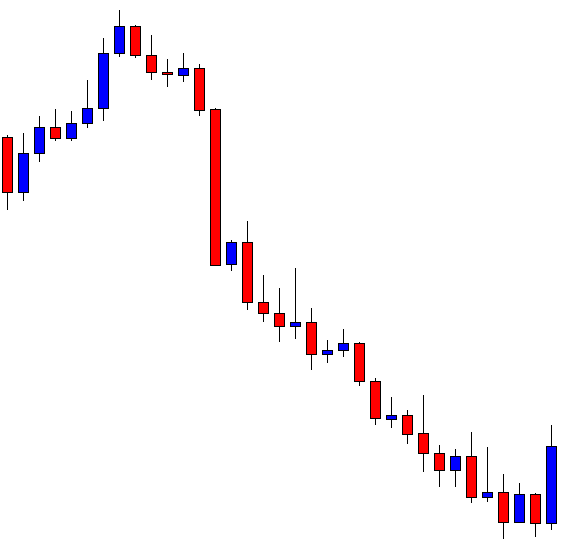
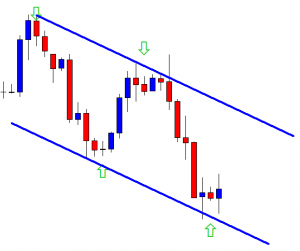
The price makes a long bearish move. It heads towards the South upon having consolidation. The sellers can make a handful of pips by eying in the chart. One of the reasons may be the bearish reversal candle in the daily chart. As far as a candlestick pattern is concerned, an engulfing candle is the most reliable reversal pattern. When you get an engulfing candle like the one we have seen here, it does have a lot to offer. Okay, here is a question. What do you see in the H4 chart here? Yes, the last candle comes out as a strong bullish engulfing candle. This has a lot to offer to the H4-H1 chart combination traders. Therefore, if you are an H4-H1 combination trader, flip over to the H1 chart and make full use of it.