In today’s lesson, we will demonstrate an example of a chart where the price is having a retracement within the last weekly range. The price produces a double bottom and makes a breakout at the neckline. It then consolidates but does not head towards the North as it normally does when it makes a breakout at weekly high/low. Let us proceed and find out the possible reason behind it.
In today’s lesson, we will demonstrate an example of a chart where the price is having a retracement within the last weekly range. The price produces a double bottom and makes a breakout at the neckline. It then consolidates but does not head towards the North as it normally does when it makes a breakout at weekly high/low. Let us proceed and find out the possible reason behind it.
In today’s lesson, we will demonstrate an example of a chart where the price is having a retracement within the last weekly range. The price produces a double bottom and makes a breakout at the neckline. It then consolidates but does not head towards the North as it normally does when it makes a breakout at weekly high/low. Let us proceed and find out the possible reason behind it.
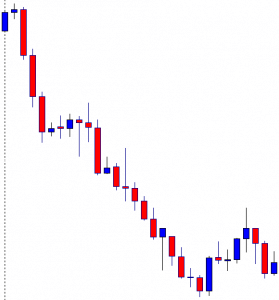
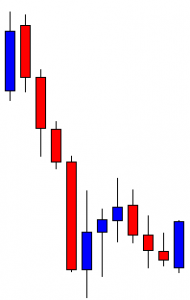
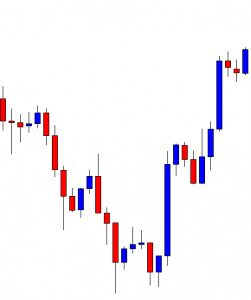
The price makes a long bearish move and finds its support. Upon producing a bullish engulfing candle, it heads towards the North and comes back again. At the support zone, it produces a bullish inside bar. Let us see what happens next.
The price heads towards the North next week. It means it is trading within the last week’s range. The price is at the last swing high. If it makes a bullish breakout, the buyers may want to go long at its weakness.
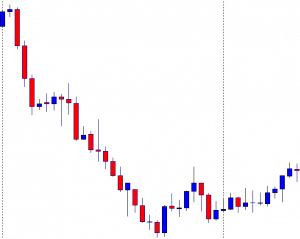
The chart produces two bearish candles followed by a bullish engulfing candle closing within the last swing high. It seems that the price may consolidate more to find its way.
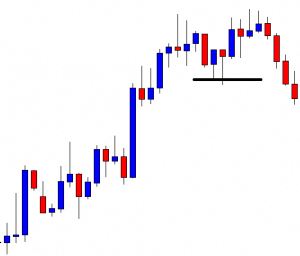
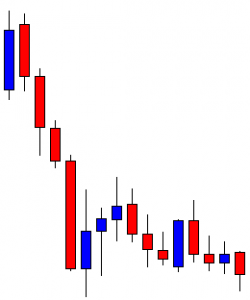
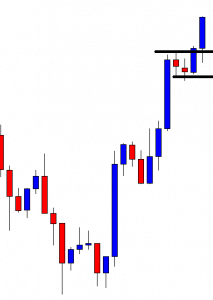
The price upon producing a spinning top followed by a bullish engulfing candle makes a bullish breakout at the last swing high. It is a neckline breakout of a double bottom. The buyers may keep their eyes on the chart to go long on its weakness.
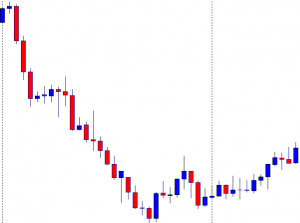
The price produces a bearish inside bar followed by a spinning top with a bullish body. Then, it produces a bullish candle closing above consolidation resistance. Since it is a breakout at the resistance, it is supposed to be a buy signal. The question is whether the buyers should trigger a long entry or not. Let us see the next chart.
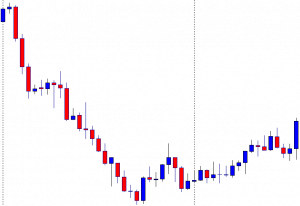
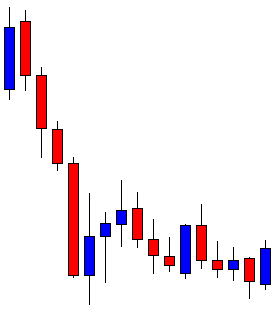
The price gets choppy, struggling to make a breakout towards the North. The buyers would not love to see such price action after triggering the entry. If the price makes a breakout at the last week high/low, traders wait for the price to consolidate and produce a bullish/bearish reversal candle to take entry upon a breakout. On the other hand, if the price trades within last week’s range, the price usually makes retracement (instead of consolidation) to offer entry. The Fibonacci level, such as the 38.2% and 61.8%, play a significant role in producing the reversal candle. In today’s chart, the price is in the weekly range. Thus, traders are to wait for the price to make a retracement to offer them entry. It rather consolidates, which ends up making the price choppy.
Last week, in one of our lessons, we showed an example of how the price gets bullish based on the double bottom and flipped support. In today’s lesson, we are going to demonstrate an example of a double top and flipped resistance. a Double Top is the opposite of a Double Bottom, so it drives the price towards the South. It is one of the strongest bearish reversal patterns. Traders love to go short when a chart produces a double top in the Forex market. Let us now proceed and find out how it usually works.
Last week, in one of our lessons, we showed an example of how the price gets bullish based on the double bottom and flipped support. In today’s lesson, we are going to demonstrate an example of a double top and flipped resistance. a Double Top is the opposite of a Double Bottom, so it drives the price towards the South. It is one of the strongest bearish reversal patterns. Traders love to go short when a chart produces a double top in the Forex market. Let us now proceed and find out how it usually works.
Last week, in one of our lessons, we showed an example of how the price gets bullish based on the double bottom and flipped support. In today’s lesson, we are going to demonstrate an example of a double top and flipped resistance. a Double Top is the opposite of a Double Bottom, so it drives the price towards the South. It is one of the strongest bearish reversal patterns. Traders love to go short when a chart produces a double top in the Forex market. Let us now proceed and find out how it usually works.
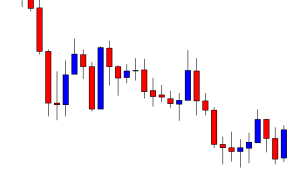
The chart shows that the price heads towards the North and finds its resistance. It produces a bearish engulfing candle. Sellers on the minor chart may look to go short in the chart. However, the sellers in this chart may wait for either the price consolidates and makes a bearish breakout or to produce a double top.
The price finds its support and heads towards the level of resistance again. It consolidates around the level of resistance. A bearish reversal candle followed by a breakout at the last support may attract the sellers to go short in the pair since the chart would produce a double top, and the breakout would be a neckline breakout.
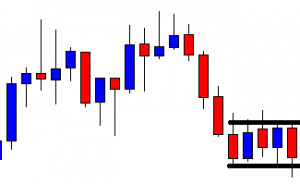
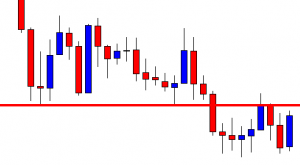
Here it goes. The price heads towards the South with good bearish momentum. It makes a breakout at the neckline and produces one more bearish candle. The sellers are going to wait to go short in the pair below the lowest low. However, it is best to wait for the price to consolidate around the breakout level and produce a bearish reversal candle to get a better risk-reward.
The price consolidates around the breakout level and produces a bearish engulfing candle at the breakout level. The sellers may go short below consolidation’s support by setting stop-loss above consolidation’s resistance and by setting a take-profit target with 1R at least. Please note, a double bottom/double top and consolidation around the neckline breakout level usually offers more than 1R. Let us find out how the trade goes.
The price heads towards the downside with extreme bearish momentum. It produces an inverted hammer. The price may make a bullish correction from here. Count the length that the price has traveled so far. It has traveled a long way offering about 6R to the sellers. One trade like this in a week may make a trader fulfilled. Thus, keep your eyes on patterns such as the Double Top/Double Bottom. Remember the procedure; wait for the price to consolidate and produce a reversal candle at the breakout level; trigger an entry below consolidation support/resistance, and manage your trade accordingly.
In today’s lesson, we are going to demonstrate an example of a double bottom, which pushes the price towards the North. The example also proves an old theory of support becomes resistance or resistance becomes support after a breakout. Let us get started.
In today’s lesson, we are going to demonstrate an example of a double bottom, which pushes the price towards the North. The example also proves an old theory of support becomes resistance or resistance becomes support after a breakout. Let us get started.
In today’s lesson, we are going to demonstrate an example of a double bottom, which pushes the price towards the North. The example also proves an old theory of support becomes resistance or resistance becomes support after a breakout. Let us get started.
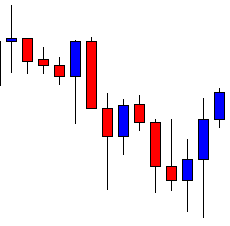
The chart shows that the price makes a bearish move and finds its support. The level of support produces a bullish candle, which is followed by two more bullish candles. The buyers may wait for the price to consolidate and produce a bullish reversal candle to go long in the pair.
The price makes a long bearish correction. It comes back to the level of support again. A bearish breakout may attract the sellers to go short and drive the price towards the South. On the other hand, the buyers may wait to get a bullish reversal candle at its second bounce.
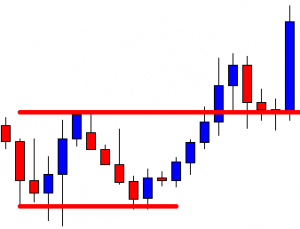
The chart produces a bullish engulfing candle. Since it is produced at the second bounce, the buyers in the chart may wait for the price to make a breakout at the neckline and go long.
The price heads towards the North with good bullish momentum. It makes a breakout at the neckline and trades above the level for one more candle. The buyers would love to see the price to consolidate or make a bearish correction at the breakout level and produce a bullish reversal candle to trigger a long entry.
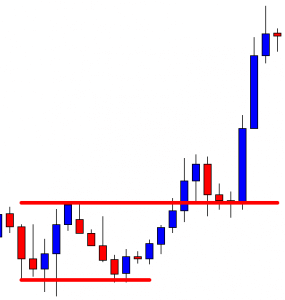
The price makes a bearish correction and produces a bullish engulfing candle closing above the level of resistance. The buyers may trigger a long entry right after the last candle closes by setting Stop Loss below the candle’s lowest low and by setting Take Profit with 1R. Here we must notice that the neckline level becomes the level of support. This is one of the most reliable theories in the financial market.
The price heads towards the North with extreme bullish momentum. It hits 1R in a hurry and travels towards the North further. The last candle comes out as a hanging man, which is a bearish reversal candle. However, it is not a strong one. The price may keep traveling towards the North. Anyway, the buyers achieve their target with the entry, which is taken on two theories.
Resistance works as a level of support after the breakout.
In the case of a double bottom and neckline breakout, we may sometimes find that the price does not come at the breakout level. It consolidates well above and makes a bullish move. In some cases, the price may not hit the target. However, if the price comes and produces a bullish reversal candle at the breakout level, the price may hit the target in most of the cases.
In today’s lesson, we are going to demonstrate an example of double bottom support, which does not end up producing entry. However, the price comes back to the level of support again, and upon producing a triple bottom, support offers a beautiful trade setup. Let us get started.
In today’s lesson, we are going to demonstrate an example of double bottom support, which does not end up producing entry. However, the price comes back to the level of support again, and upon producing a triple bottom, support offers a beautiful trade setup. Let us get started.
In today’s lesson, we are going to demonstrate an example of double bottom support, which does not end up producing entry. However, the price comes back to the level of support again, and upon producing a triple bottom, support offers a beautiful trade setup. Let us get started.
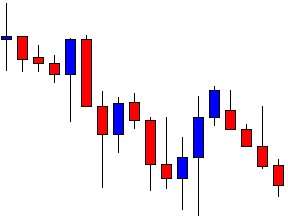
This is the daily chart. The price makes a strong bearish move and bounces off at a level of support. It produces a bullish inside bar and heads towards the North. The price comes back to the level of support again upon producing a bullish engulfing candle. The buyers may flip over to the H4 chart for the price to consolidate and produce a bullish engulfing candle to trigger a long entry.
We are still on the daily chart. The H4 chart does not consolidate or produce a bullish reversal candle. On the daily chart, the price comes down again and consolidates around the level of support. Both the buyers and the sellers are to wait for the price to see what it does. Does it produce a bullish reversal candle, or does it make a bearish breakout?
The chart produces a bullish engulfing candle at the level of support again. It has become a level of triple support. Thus, the buyers may be more interested in going long in the pair. The buyers may flip over to the H4 chart now.
This is how the H4 chart looks. The last candle comes out as a hammer. The buyers are to wait for a bullish engulfing candle to trigger a long entry. Let us proceed to the next chart to find out what the price does.
The price consolidates for four more H4 candles. At last, it produces a bullish engulfing candle closing well above consolidation resistance. It takes a long time to produce the signal candle, but it does just before the day ends. It is a valid signal. The buyers may trigger a long entry right after the last candle closes by setting take profit with 1R.
The price heads towards the North with good momentum and hits the target. The extreme bullishness of the signal candle makes the price hit the target in a hurry.
If we look back, when the chart produces the first bullish engulfing candle at the level of double bottom support, it does not end up offering an entry. When it bounces again at the same level of support, it ends up offering an entry. This is what may happen more often than traders think. If a buyer leaves the chart when it does not offer entry, he will lose the chance to make a profit from the trade setup that we have demonstrated here.
In our previous articles, we had reviewed several technical formations that render signals for potential market-entry setups in a trend reversal context or trend continuation.
In this educational article, we will review the characteristics of the double top and double bottom pattern.
The Nature of Double Top and Bottom
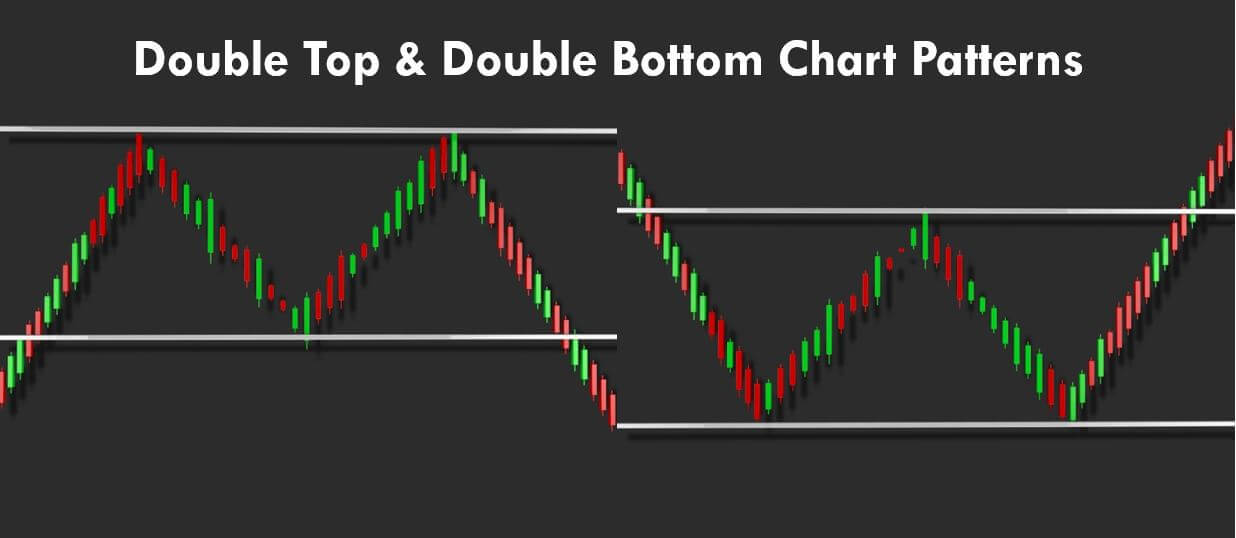
The double top and double top formations are the most popular trend reversal technical patterns in financial markets. These patterns characterize themselves by developing an internal “M” and “W” structures on double tops and double bottoms respectively.
Considering the fractal nature of financial markets, the technical trader can detect these formations in any timeframe, from intraday chart to monthly range.
The double top formation tends to be tough to identify, especially if the second peak is higher than the first one. This situation occurs because the technical trader could be waiting for the uptrend continuation or a bullish trap.
The Setup Rules
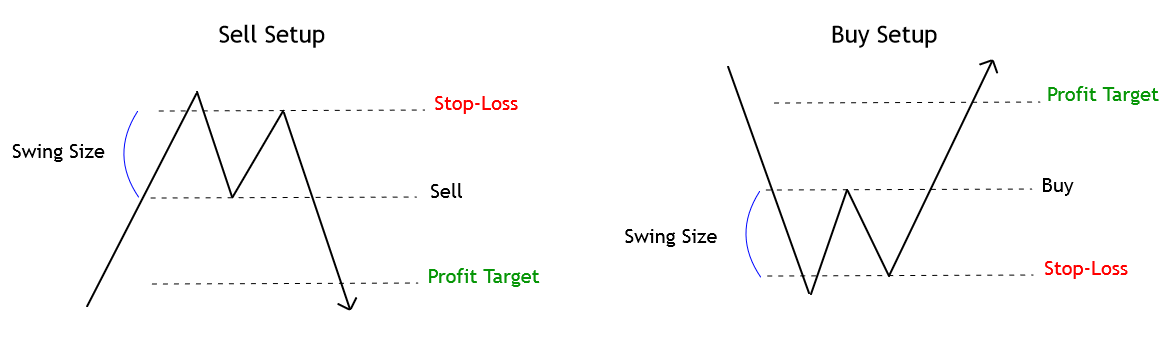
The price action will generate an entry signal if the price breaks and closes below (or above) the swing between both peaks (or valleys), as shown in the following figure.
The stop-loss order will take place above the last high (or low); this distance between the entry-level and the previous top (or bottom) is known as the swing size, as illustrated in the last figure.
The double top/bottom pattern holds an easy way to identify the profit target level. The technical rule says that if the swing size is 50 pips, the profit target will locate at 50 pips from the entry-level.
The Behavior of the Double Top and Bottom Formation
Thomas Bulkowski, in his “Encyclopedia of Chart Patterns,” described the performance of double top and bottom considering some shape variations as a rounded peak or a spike.
In general, Bulkowski reveals that on average, the break-even and failure rate of the double top pattern is 11.5%, while the percentage of break-even and failure of double bottom is 6.5%. However, the double top formation tends to reach its price target 71.5%, while the double bottom tends to strike its target 51.25% of times.
Bulkowski summarizes its finds stating that some variations of double top and bottom patterns with a narrow range perform better than those that show a wide one.
Conclusions
In this educational article, we reviewed the essential reversal formation known as the double top and double bottom pattern. The setup studied provides the technical trader a one to tone risk to reward ratio, which could be increased as the trade advances in favor of the trend.
In the next article, we’ll review the use of Fibonacci tools as retracements and extensions to identify trade opportunities.
Suggested Readings
Fischer, R., Fischer J.; Candlesticks, Fibonacci, and Chart Patterns Trading Tools; John Wiley & Sons; 1st Edition (2003).
Bulkowski, T.; Encyclopedia of Chart Patterns; John Wiley & Sons; 2nd Edition (2005).
In today’s lesson, we are going to demonstrate an example of a chart offering multiple entries upon producing the double bottom. We know the double bottom is one of the strongest bullish reversal patterns. When a chart produces a double bottom, price action traders keep their eyes on the chart to keep going long. Usually, a double top or a double bottom ends up offering multiple entries. Let us now have a look at today’s example of how it offers us multiple entries.
In today’s lesson, we are going to demonstrate an example of a chart offering multiple entries upon producing the double bottom. We know the double bottom is one of the strongest bullish reversal patterns. When a chart produces a double bottom, price action traders keep their eyes on the chart to keep going long. Usually, a double top or a double bottom ends up offering multiple entries. Let us now have a look at today’s example of how it offers us multiple entries.
In today’s lesson, we are going to demonstrate an example of a chart offering multiple entries upon producing the double bottom. We know the double bottom is one of the strongest bullish reversal patterns. When a chart produces a double bottom, price action traders keep their eyes on the chart to keep going long. Usually, a double top or a double bottom ends up offering multiple entries. Let us now have a look at today’s example of how it offers us multiple entries.
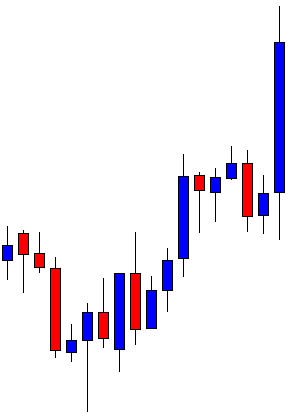
This is an H4 chart. The chart shows that the price heads towards the South with good bearish momentum. It makes a long bearish move too. However, look at the last candle in the chart. It comes out as a bullish inside bar, which is produced at double bottom support. The buyers are to wait for a breakout at the neckline and go long in the pair.
The chart shows that one of the candles breaches through the neckline level. The next candle comes out as a bullish candle. The buyers are to wait for the price to consolidate and produce a bullish reversal candle to go long in the pair.
Upon producing a bearish inside bar, the price produces a bearish candle. The last candle looks very bearish. However, the buyers must keep their eyes on the chart since it may produce a bullish reversal candle anytime as far as double bottom and neckline breakout are concerned.
The chart produces a bullish reversal candle followed by another bullish candle breaching through consolidation resistance. The buyers may trigger a long entry right after the last candle closes by setting stop loss below consolidation support and by setting take profit with 1R.
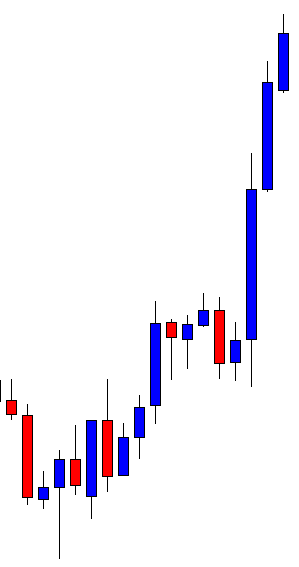
The price heads towards the North with good bullish momentum. It hits 1R within the next candle. The price consolidates and produces a bullish reversal candle closing above the last swing high. Do you notice anything here? Yes, this is another entry. The buyers may trigger a long entry right after the last candle closes. Let us have a look at the trade setup with two horizontal lines on the chart.
The price heads towards the North again and hits 1R within the next candle. It seems that the buyers are having a feast here. The way it has been going, they may wait for the price to consolidate again and produce another bullish reversal candle to offer them one more entry. In a word, this is a chart that is going to be closely monitored by the buyers until it produces a strong bearish reversal pattern such as a double top or a bearish engulfing candle on the daily chart (this is an H4 chart). Next time when you see a double top or bottom on a chart, keep eyeing on the chart to make full use of that.
The Double Bottom is one of the strongest bullish reversal patterns. When the price gets its second bounce at the same level and makes a breakout at the last swing high, the pattern it produces is called the double bottom. In today’s lesson, we are going to demonstrate an example of a double bottom in the H1 chart. At the end of the wave, an interesting thing happens. Let us proceed and find out how the double bottom offers entry and what that interesting thing is.
The Double Bottom is one of the strongest bullish reversal patterns. When the price gets its second bounce at the same level and makes a breakout at the last swing high, the pattern it produces is called the double bottom. In today’s lesson, we are going to demonstrate an example of a double bottom in the H1 chart. At the end of the wave, an interesting thing happens. Let us proceed and find out how the double bottom offers entry and what that interesting thing is.
The Double Bottom is one of the strongest bullish reversal patterns. When the price gets its second bounce at the same level and makes a breakout at the last swing high, the pattern it produces is called the double bottom. In today’s lesson, we are going to demonstrate an example of a double bottom in the H1 chart. At the end of the wave, an interesting thing happens. Let us proceed and find out how the double bottom offers entry and what that interesting thing is.
This is an H1 chart. The chart shows that the price has its second bounce and produces a bullish engulfing candle. Since the same level of support produces a bullish engulfing candle at the second bounce, it is going to have a strong impact on the market if it makes a breakout at the last swing high.
Here is the level of resistance, which the buyers are going to wait for a breakout to go long in the pair upon breakout confirmation. The price reacted at the drawn level earlier as well. Thus, this has been a significant level. The last rejection signifies it more.
Look at the next candle. The candle comes out as a bullish Marubozu candle. The candle closes well above the level where the price had a rejection earlier. Some buyers may want to trigger a long entry right after the last candle closes. Some buyers may wait for the breakout confirmation to go long in the pair.
The next candle comes out as a spinning top with a tiny bullish body. The price closes above the last candle’s highest high. It confirms the breakout. The buyers may trigger a long entry right after the last candle closes since they have the breakout confirmation.
See how the price heads towards the North with good bullish momentum. The price hits 1R within one candle. The last candle suggests that the price may continue its move towards the North. Let us see what happens next.
The chart produces a bearish inside bar. It suggests that the price is still bullish. If the next candle comes out as a bullish engulfing candle, the price may resume its journey towards the North with good bullish momentum. However, many buyers may come out with their profit and wait for the next bullish reversal candle to go long.
The price gets choppy within two horizontal levels. The last candle comes out as a bearish engulfing candle. Do you notice anything interesting here? Yes, the chart produces a Double Top this time, and it produces a bearish engulfing candle at the second rejection. The sellers may want to go short if the price makes a breakout at the last lowest low. This is how things change in the Forex market. It is interesting, is not it?
We will be discussing many Forex chart patterns in the upcoming course lessons that are widely used by traders around the world. But none of those patterns can beat the popularity of Double Bottom and Double Top chart patterns. This pattern can be seen frequently in not just the Forex market but all types of markets.
This pattern is independent of timeframes, i.e., it appears on all the time frames and the strategies that we are going to discuss work on all the trading timeframes too. Fundamentally, the Double Top and Double Bottom are reversal patterns, and they consist of two price swings approximately the same size on the same price level.
Double Top Chart Pattern
The Double Top chart pattern typically appears in an uptrend. It is formed when a bullish trend is interrupted at some point, and as a result, the price action tends to range. If that range consists of two swing tops, we can consider that as the formation of a Double Top chart pattern. After the second top, the price action drops and starts a new bearish trend.
Double Bottom Chart Pattern
The Double Bottom chart pattern typically appears in a downtrend. It is formed when the downtrend is interrupted at some point, which results in the price action to form a range. In the consolidation phase, if the range consists of two swing lows, and if the second low is struggling to reach the BottomBottom of the range, we can confirm the formation of the Double Bottom chart pattern. When the second Bottom is printed, we can expect the price to print a brand new higher high.
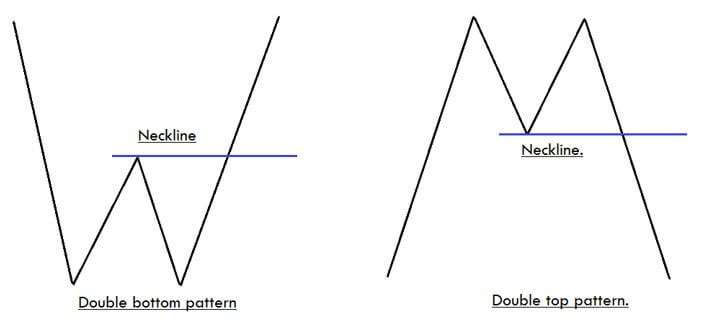
Neckline
The Double Top and Double Bottom patterns consist of a neckline. The Neckline is often used to confirm the pattern. The Neckline in a Double Top pattern is the horizontal level at Bottom where the two tops converge. Likewise, Neckline in a Double Bottom pattern is the horizontal level at the top where the two bottoms converge.
How To Trade The Double Top & Double Bottom Patterns?
Double Top Pattern
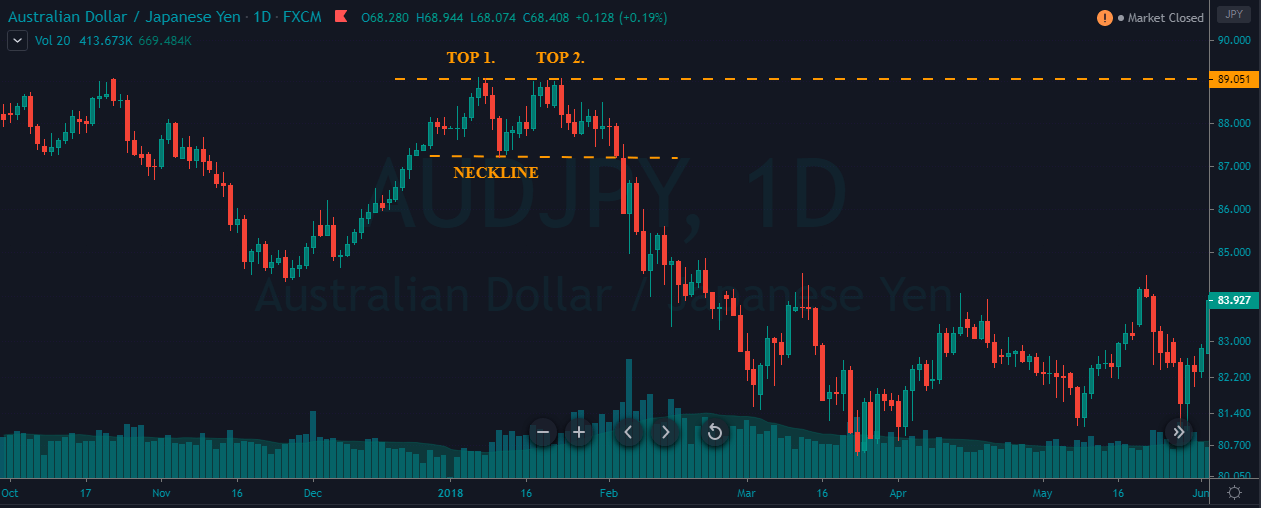
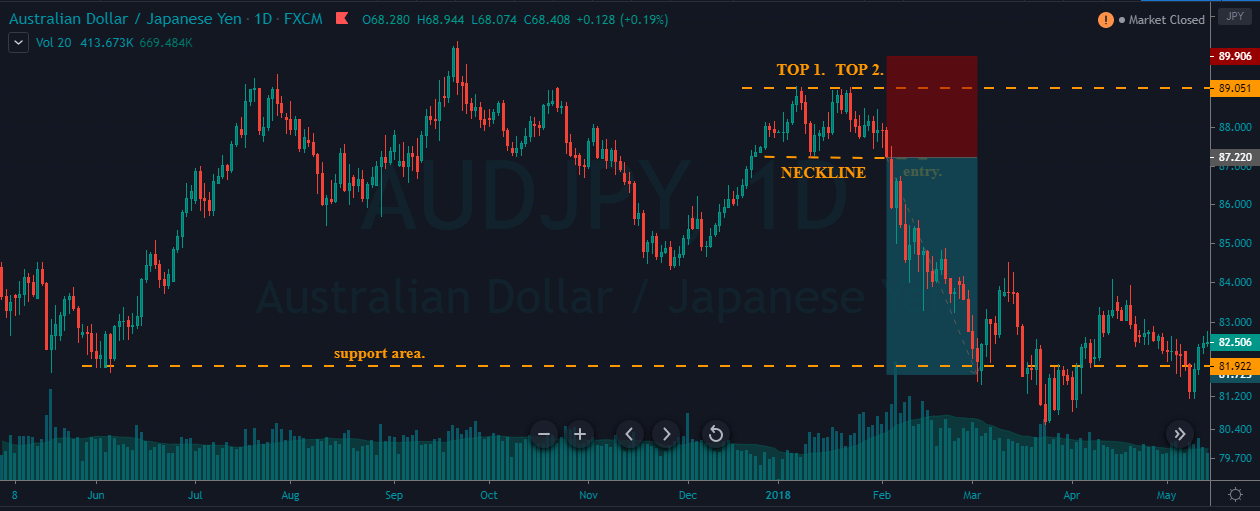
The below charts represents the formation of a Double Top pattern on the AUD/JPY daily Forex chart.
In the below chart, we had activated a sell trade when the price action broke below the Neckline. The stop-loss is placed just above the Double Top pattern. It is advisable to set the take-profit order two times below the size of the pattern. Activating our trades at the Neckline is the safest and most professional way of trading this pattern; because it shows that the last buyers are out of the league, and going short positions from here is a good idea.
Double Bottom Pattern
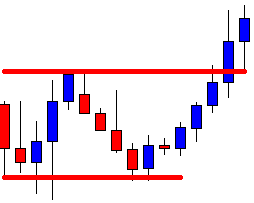
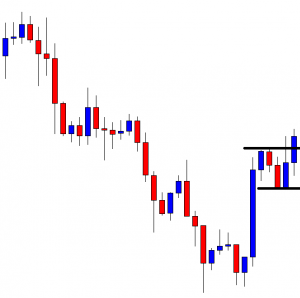
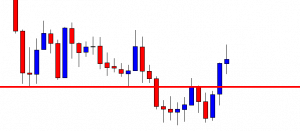
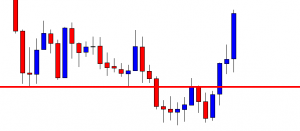
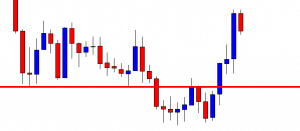
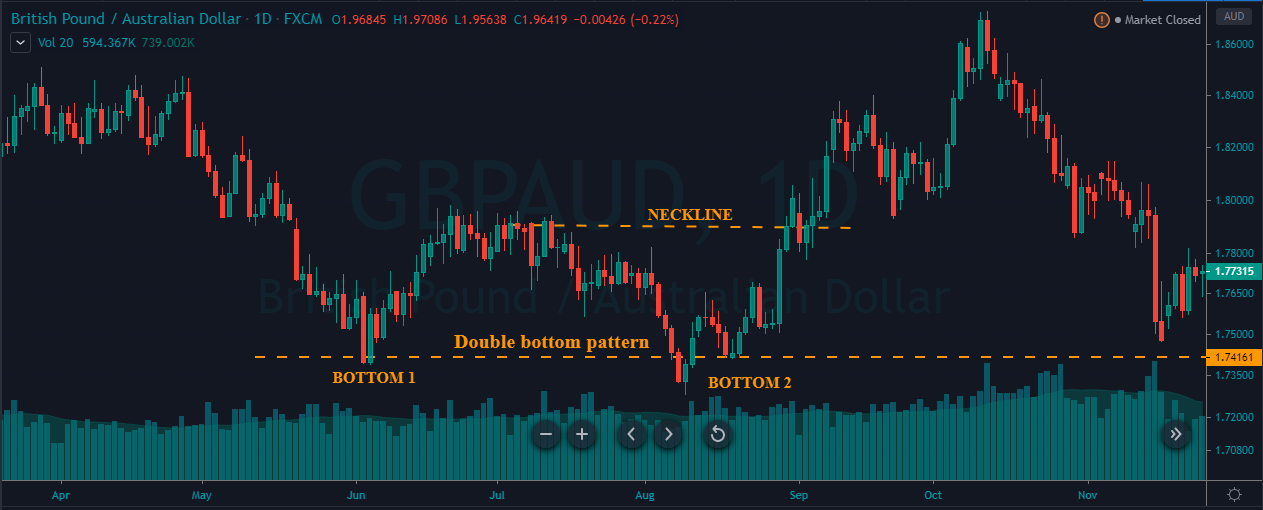
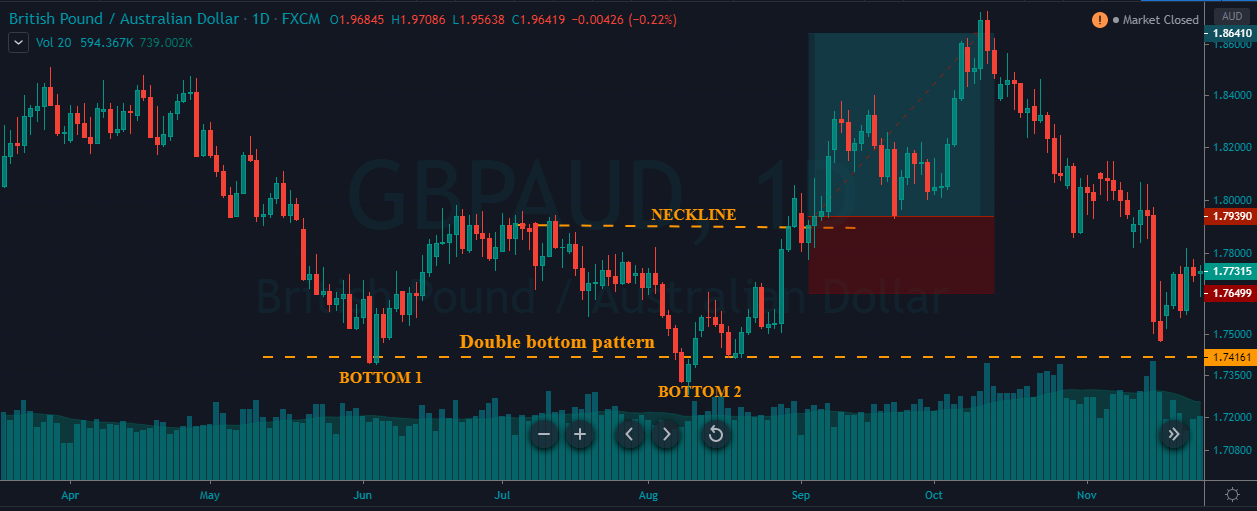
The chart below represents the formation of a Double Bottom chart pattern on the GBP/AUD Forex pair.
As we can clearly see below, when the price action is closed above the Neckline, it indicates a buy signal. We can see the most recent leg of the buyers being very strong, which indicates the buyers’ strength. Hence, in this case, we have decided to place the stop-loss just below our entry. For placing TP, we chose the previous recent high, and we can see how perfectly the price respected our placement.
This ends our discussion on Double Top & Double Bottom Forex chart patterns. We, at Forex Academy, have provided a lot of strategies to trade this pattern in the Basic Strategies section. You can check them out to get a deeper insight into these patterns. Cheers!
Trading Crypto using Double Top and Bottom patterns
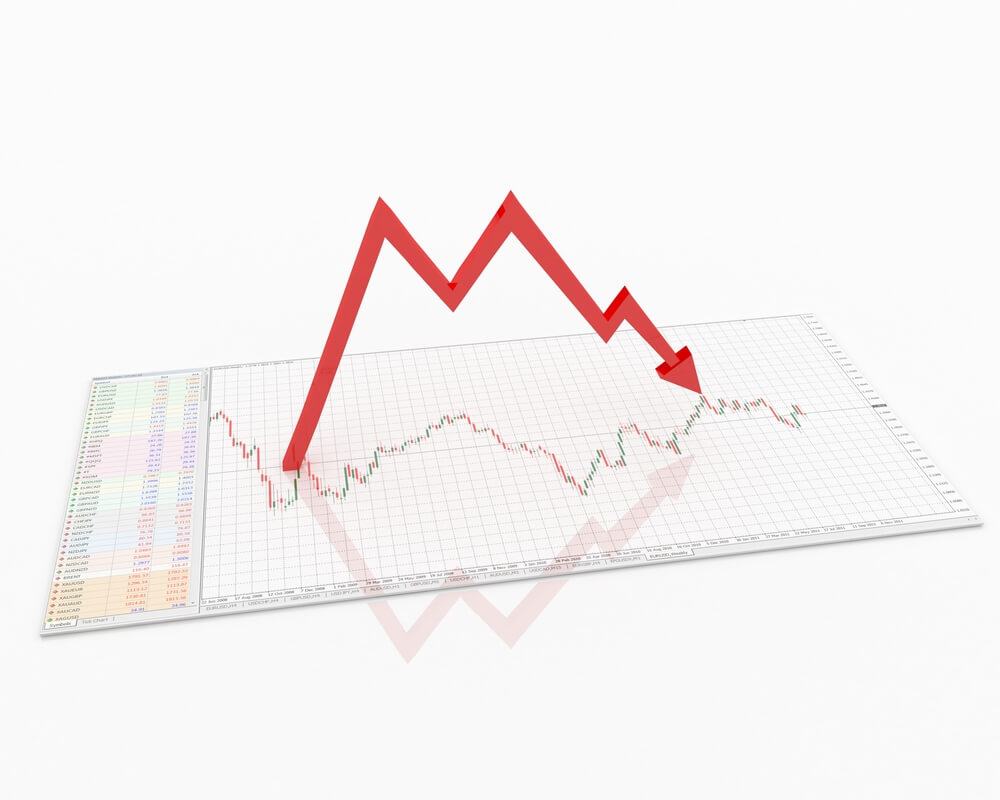
This year has brought many uncertainties in all aspects of the world, especially health and finance. Cryptocurrencies have not been an exception, either. For the past couple of months, the sentiment has changed from very bullish to very bearish. The trend changed as quickly and sharply as the sentiment did. This is why we will cover the patterns which signal a trend reversal, called “double top” and “double bottom.
Double Top pattern
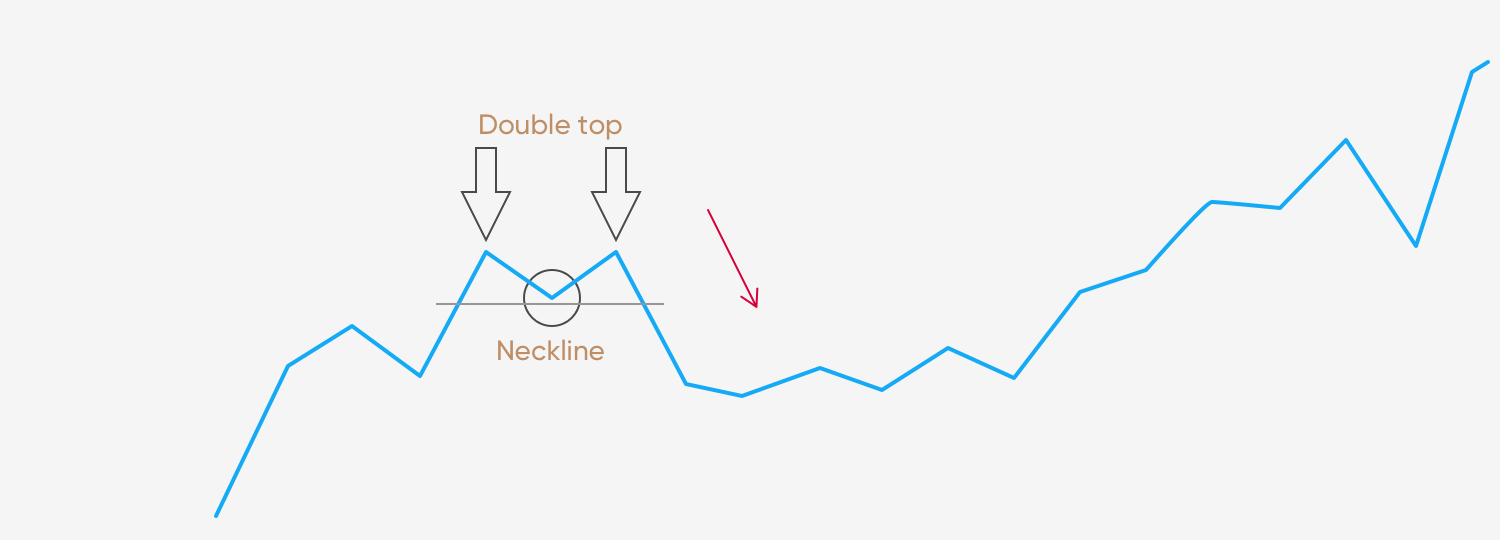
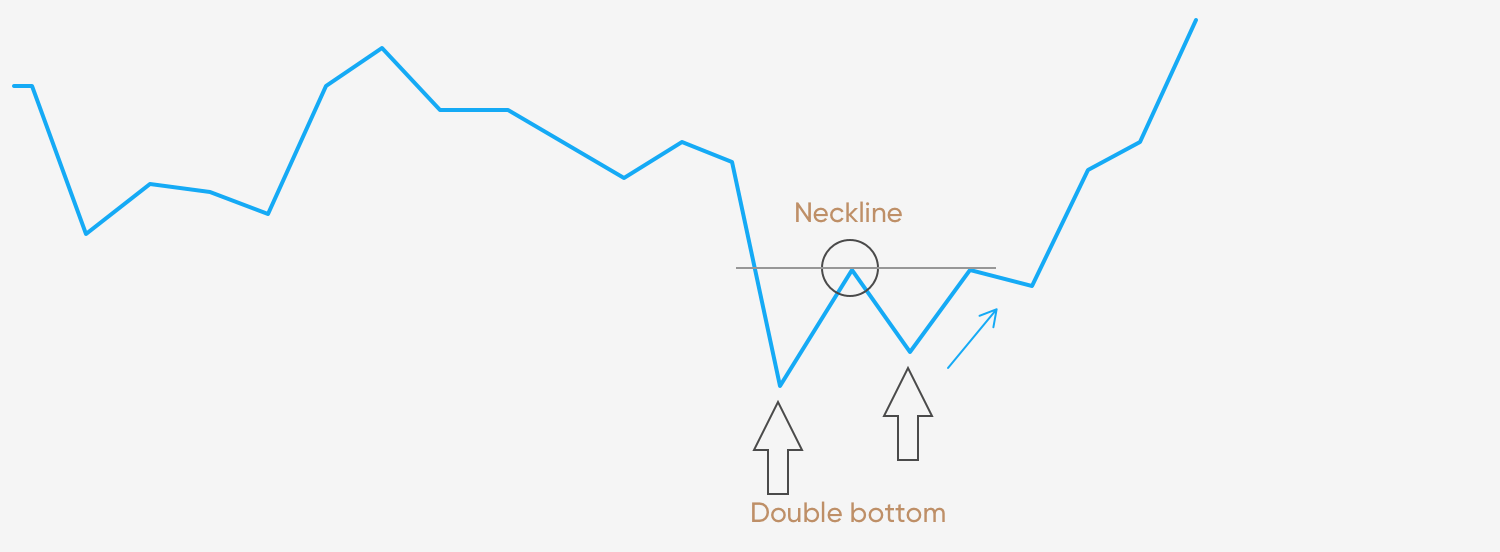
This image represents a double top pattern. After a cryptocurrency’s has trended upward for a while, it will create a top in price. Investors will often close their positions during this pause of the market, thus creating a downward trend in price. Shortly after that, the value rises again, reaching a second top at almost the exact same price as the previous one. These two tops form a double top pattern, which is essentially a test of the market.
The market is tested in terms of whether the price is susceptible to be nudged higher or not. The downward trend after the second top shows that the market does not have enough of a drive to go further up and that it will trend downward again. In a nutshell, the distinct shape of a double top that is quite similar to the letter M represents a bearish move.
Double Bottom pattern
As expected, the double bottom represents everything that the double top represents, but in reverse. Rather than testing the upside of a cryptocurrency, the market testing comes after a downward move and tests if the market is ready to go further down. The double bottom pattern is recognized by the two inverted peaks that are formed at approximately the same price level.
When it happens that the downward trend has been tested twice, and the bottom has been found, then the market will reverse, and the uptrend will start. In a nutshell, the distinct shape of a double bottom that is quite similar to the letter W represents a bullish move.
Additional information
The double top pattern and the double bottom patterns are price reversal indicators. However, there is always the risk that you will encounter a false reversal, meaning that the price movement will play out just the way you want for a very short amount of time, and then do the complete opposite. That’s why it is important to mitigate the risk by doing a couple of things. First, set the stop-loss below the double bottoms or above the double tops. Second, make sure to wait for a candle close in your direction to get a confirmation of the trend reversal. Ultimately, you can pair trading this pattern with candlestick analysis, indicators, and other tools at your disposal.
As the last piece of advice, try to make trades where the double bottom or top will show a trend reversal to a direction of the longer time-frame trend. This way, you will trade alongside the long-term trend, which is much safer than trading against.
In this presentation, we will be looking at the technical analysis chart pattern known as a double top. Being able to recognize this formation or pattern and the information it provides us with will help to trade more effectively.
Double top patterns one of the many pillars of technical trading structures and should be incorporated into your trading knowledge base. Double top identification and understanding can further enhance your technical analysis when trading the forex market,y helping us see more than just support and resistance levels.
Example A
So what exactly is a double top? It will include two high points within the market, which generally signify an impending bearish reversal. There will usually be a decline in price between two high points. After the first peak has formed, there will be a retracement to a certain degree, before another rally to the upside. The second peak usually forms at the same level or slightly below the first peak, although occasionally it might breach the level of the first peak before price action reverses.
Example B (OR EXAMPLE C)
Here we can see that after a rally to the upside to peak one, price action reverses to our line of support line, often called a neckline between the two peaks, before the second push higher to peak number 2, and where price action reverses from this area, suggesting unsustainable buying pressure and that we should expect a reversal. And where price action goes on to breach the previous level of support, with a strong bearish candlestick, this is confirmed as a double top formation. And where price action subsequently comes back after some brief consolidation, with mixed small shaped candlesticks suggesting a lack of direction and where the previous level of support becomes an area of resistance and hence the continuation downwards which adds to our belief and support for this technical setup.
Example D
On the flip side, we have the double
bottom formation. This setup is identical to the double top in its theory and execution of trading. However, it is simply in reverse, In which case the exact same rules apply, But it is simply the mirror image of the double top. In this case, we would expect a bullish signal once the neckline is broken.
Example E
So here, for example, we can see a push down in price action to our first bottom, before price reverses to the neckline, which acts as an area of resistance, and where price subsequently comes down again to our second bottom, and where price action again returns to the neckline and breaches it and where this prior area of resistance becomes an area of support, and where price action continues to the upside from.
So to sum up, we are looking for two peaks at a similar height and where price action reverses between them to a neckline or area of support, which subsequently becomes breached after reversing from the second peak.
Secondly, we should make sure that the peaks are not too small because we prefer them on larger time frames of 15 minutes or higher because that is where we would expect larger amounts of pips to be made from this successful trade setup. This type of setup should be used in conjunction with a stochastic or ma CD to support double top or double or bottom formation.
One of the biggest problems with technical trading is that sometimes these patterns appear obvious in hindsight and that quite often we will miss opportunities and of course this can be very frustrating when you are always missing the mark. These patterns appear on our chats and often can be difficult to decipher when the market is moving, and with the pressure of placing trades sometimes, we simply miss these setups. There are two ways of going about solving this problem, and both have their pros and cons. We can either anticipate the formation before it occurs or wait for confirmation to trade the potential reversal. This will always be down to your appetite for risk, your personality as a trader, and your competence at understanding the nature of the forex market. Reactive traders who are playing the safer game have the advantage of simply seeing the pattern occur and trading it accordingly with the downside to this, which is that part of the trade has already been missed. This can equate to larger potential stop losses and less pips being made as the move continues.
Traders who have gotten into the sell or buy during the second peak or bottom phase of the setup will enjoy the comfort of having tighter stop losses, which should be placed a few pips above or below the first peak or first bottom. And of course, they will be able to claim more pips.
As with anything in forex trading, these things are a matter of trial and error and consistency, and therefore practice and observation will pay dividends in the long run.
Price action trading is considered one of the most effective and easiest ways of trading. Traders are to follow a few rules and be disciplined to be a successful price action trader. One of the most important factors is marking the support/resistance zone/level. If a trader draws support/resistance zone/level; accordingly, trade management gets easy for him. In today’s lesson, we are going to demonstrate an example of how important it is to mark support/resistance levels on our trading chart and manage trade accordingly.
Price action trading is considered one of the most effective and easiest ways of trading. Traders are to follow a few rules and be disciplined to be a successful price action trader. One of the most important factors is marking the support/resistance zone/level. If a trader draws support/resistance zone/level; accordingly, trade management gets easy for him. In today’s lesson, we are going to demonstrate an example of how important it is to mark support/resistance levels on our trading chart and manage trade accordingly.
Price action trading is considered one of the most effective and easiest ways of trading. Traders are to follow a few rules and be disciplined to be a successful price action trader. One of the most important factors is marking the support/resistance zone/level. If a trader draws support/resistance zone/level; accordingly, trade management gets easy for him. In today’s lesson, we are going to demonstrate an example of how important it is to mark support/resistance levels on our trading chart and manage trade accordingly.
This is a daily chart. The chart shows that the price after being very bullish produces two bullish candles consecutively. The first candle comes out as a bearish engulfing candle as well. Thus, major intraday charts’ traders may flip over to their charts and look for short opportunities. However, before we proceed, we must mark significant levels that may work as a level of support. Think about the levels that you may mark as the level of potential support. If you are done, proceed to the next chart.
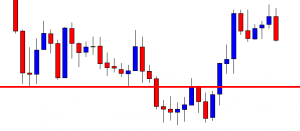
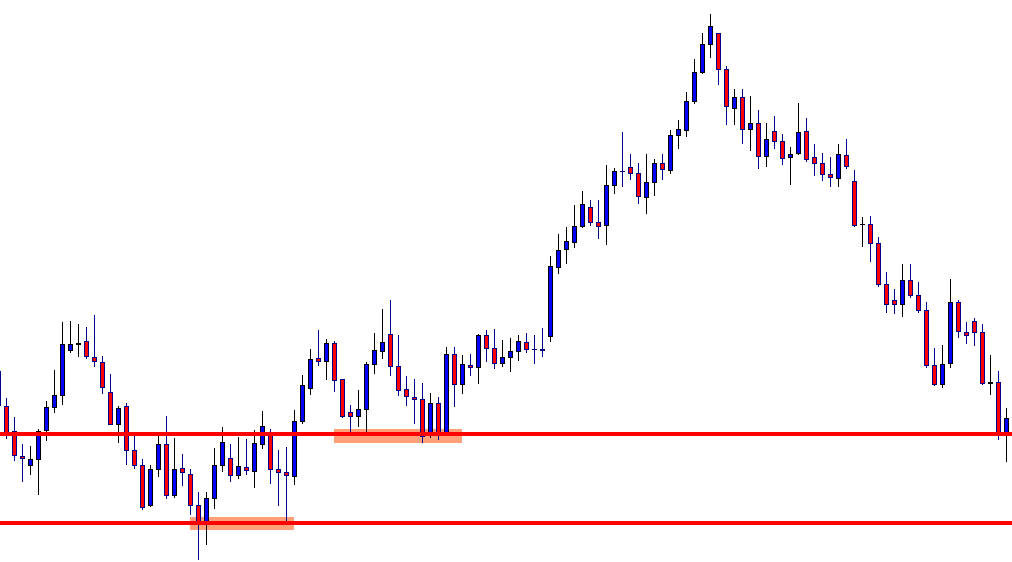
These two levels may work as a level of support. The line below is the most significant level on this chart because this is the lowest low, and this is where the trend starts. The line above is quite significant since it produces a double bottom earlier. There are levels where the price reacted earlier. Thus, they may work as flipped support. However, two marked levels are crucial as far as this chart is concerned.
The chart produces a bullish reversal candle right at the marked level. It has been extremely bearish. The second last candle comes out as a strong bearish candle as well. Price action traders usually keep their eyes on a chart like this to go short upon breakout. That does not happen here. It produces a bullish inside bar. The chart is still the sellers’ paradise. Nevertheless, it is a bullish reversal candle, and it may change the whole equation on this chart. To have a better idea, let us zoom out the same chart.
The chart now tells the whole story. Do you recognize these two marked levels now? The sellers shall plan about trade management before the price hits such levels. It is often seen the price makes a big anti-trend move after reaching such levels. The reason is many traders/ big traders set their take profit at such level. Once they get out of the market with their profit, the price goes another way around, causing an abrupt opposite move. This may make traders lose money and lose profit. Let us make sure we learn how and where to mark the support/resistance zone/level and manage our trade accordingly.
In mastering technical analysis, one of the key pattern formations is the double top and double bottom, and it is essential that you understand what this is, and that you develop your skills for identifying it, and implementing it in your trading because these patterns will recur time after time. It will provide you with invaluable information when it comes to trading around it. Double tops and double bottoms will enhance your trading by showing you where potential reversals in price action may occur, whether or not they form the basis of technical support and resistance levels.
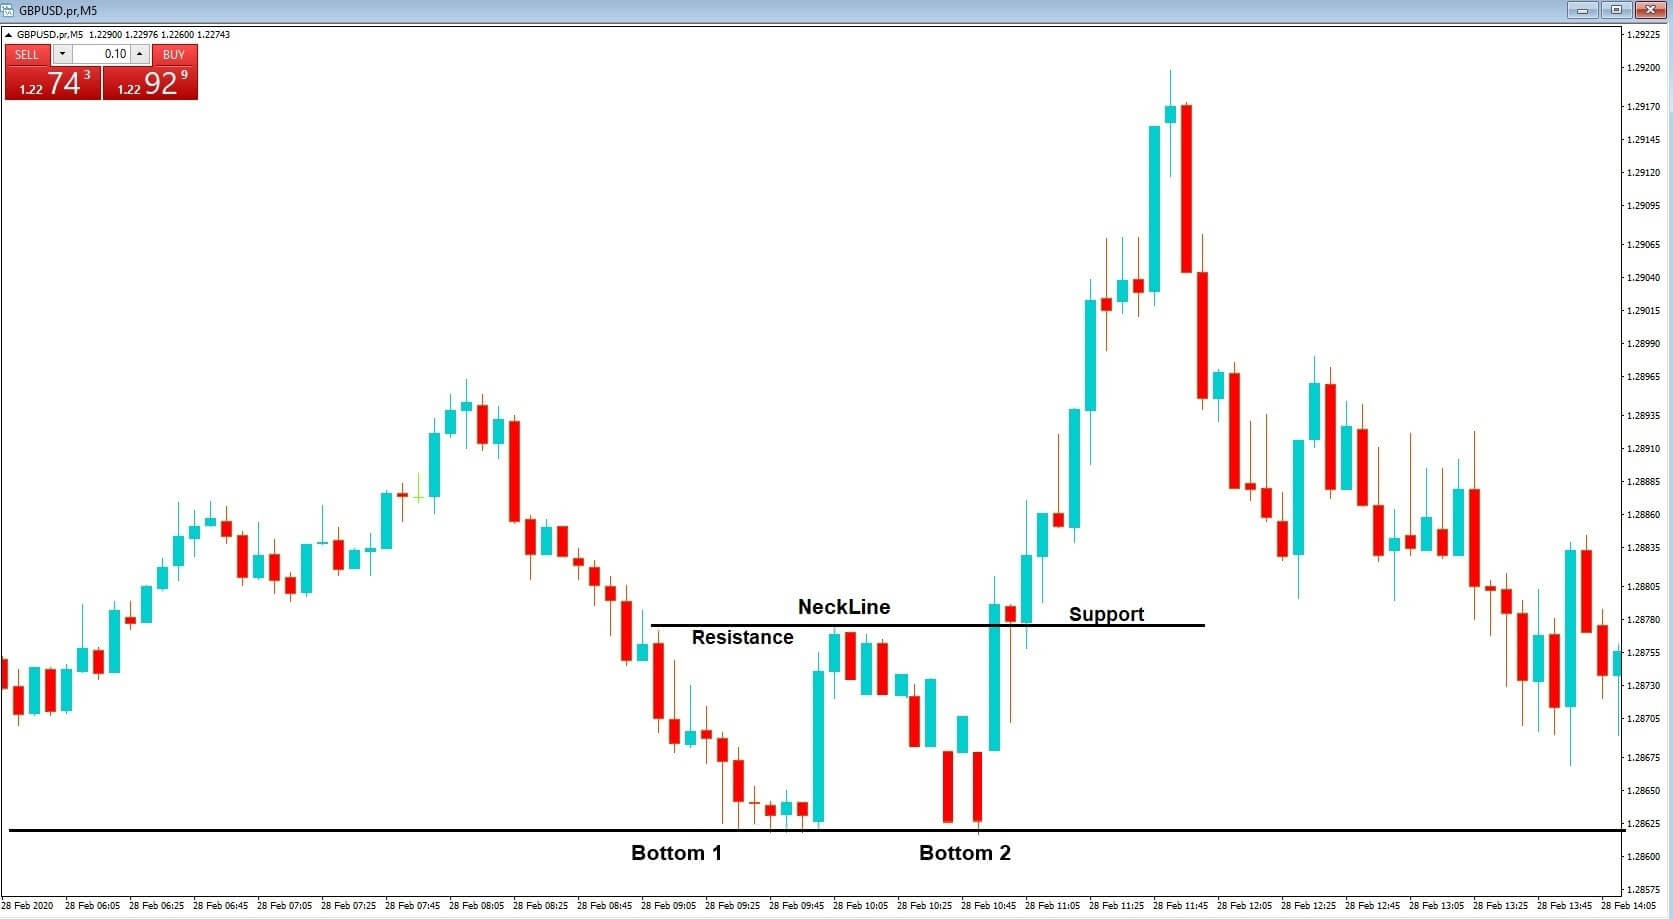
Example A
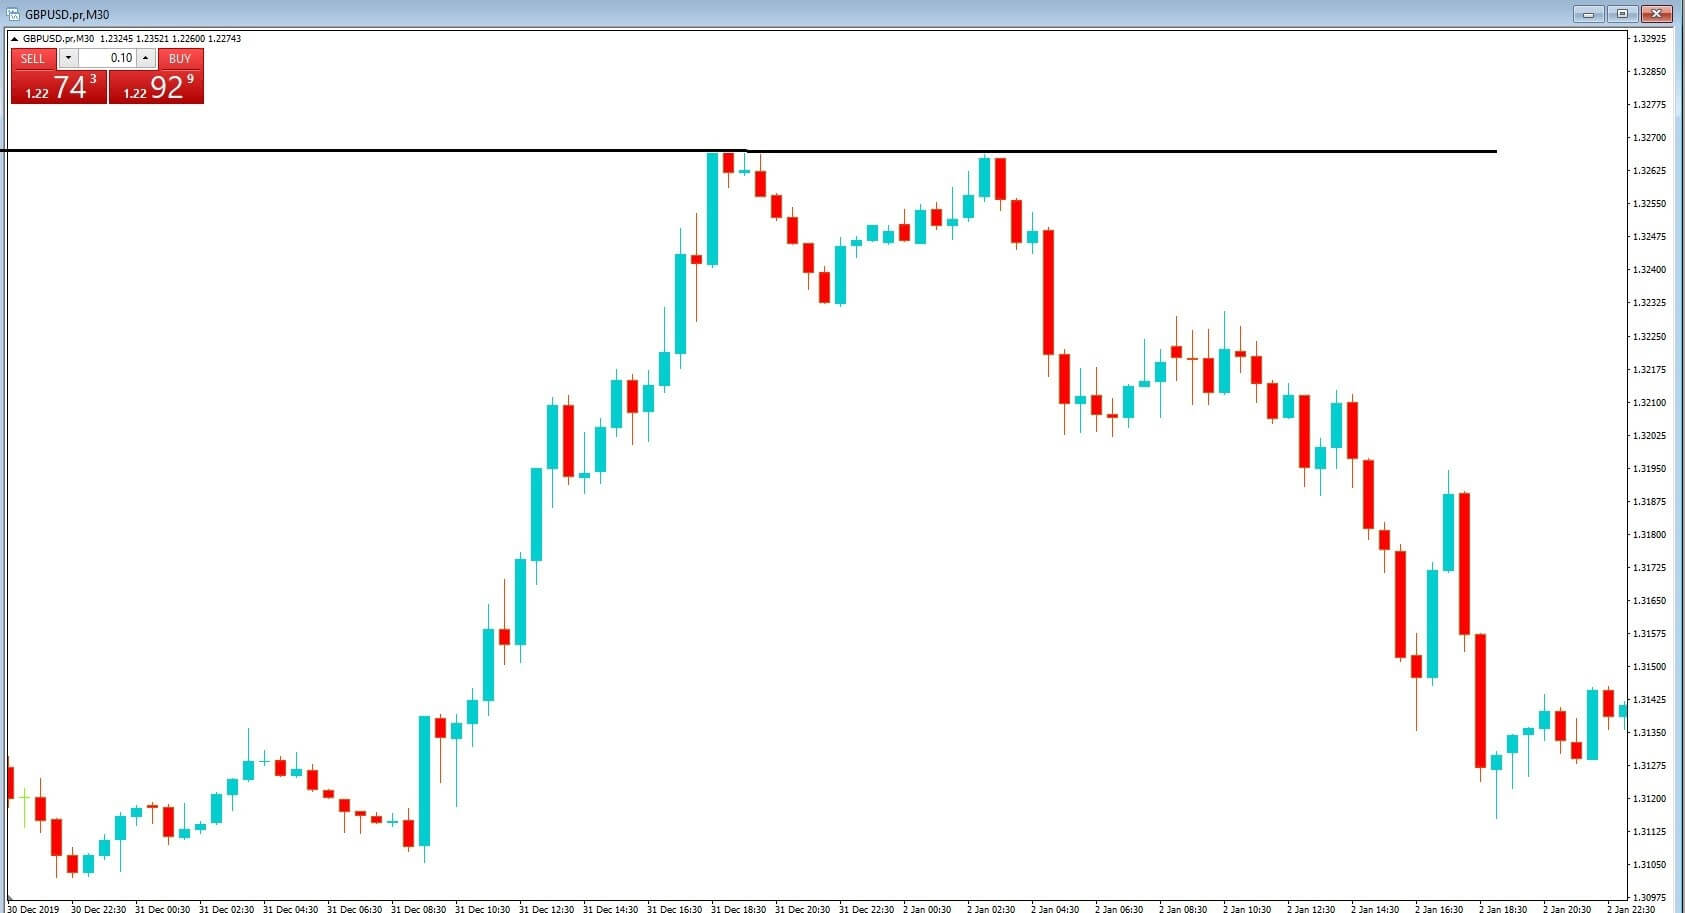
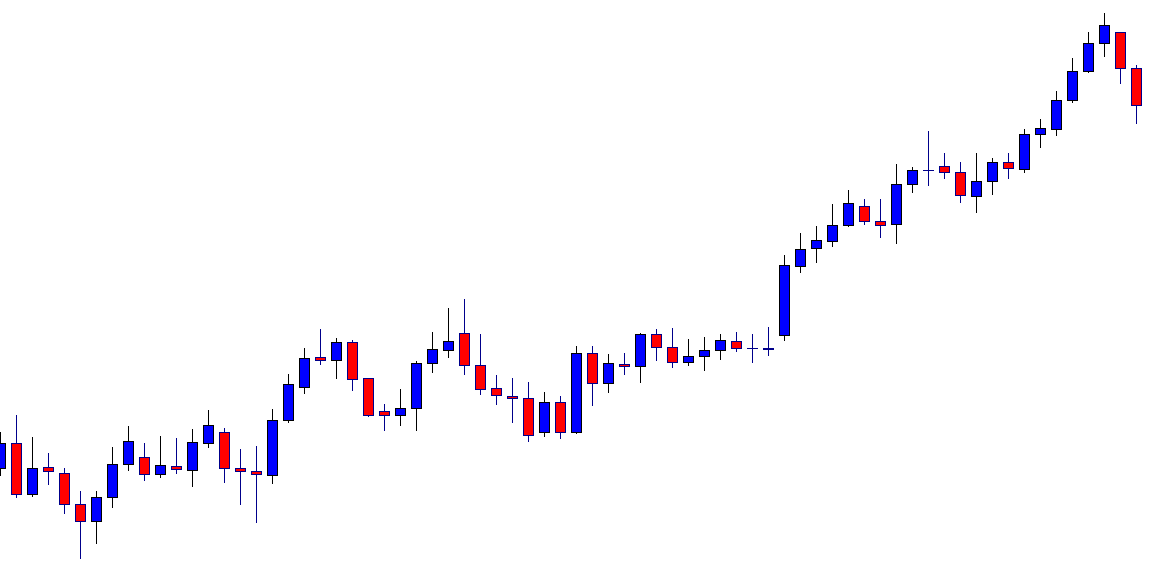
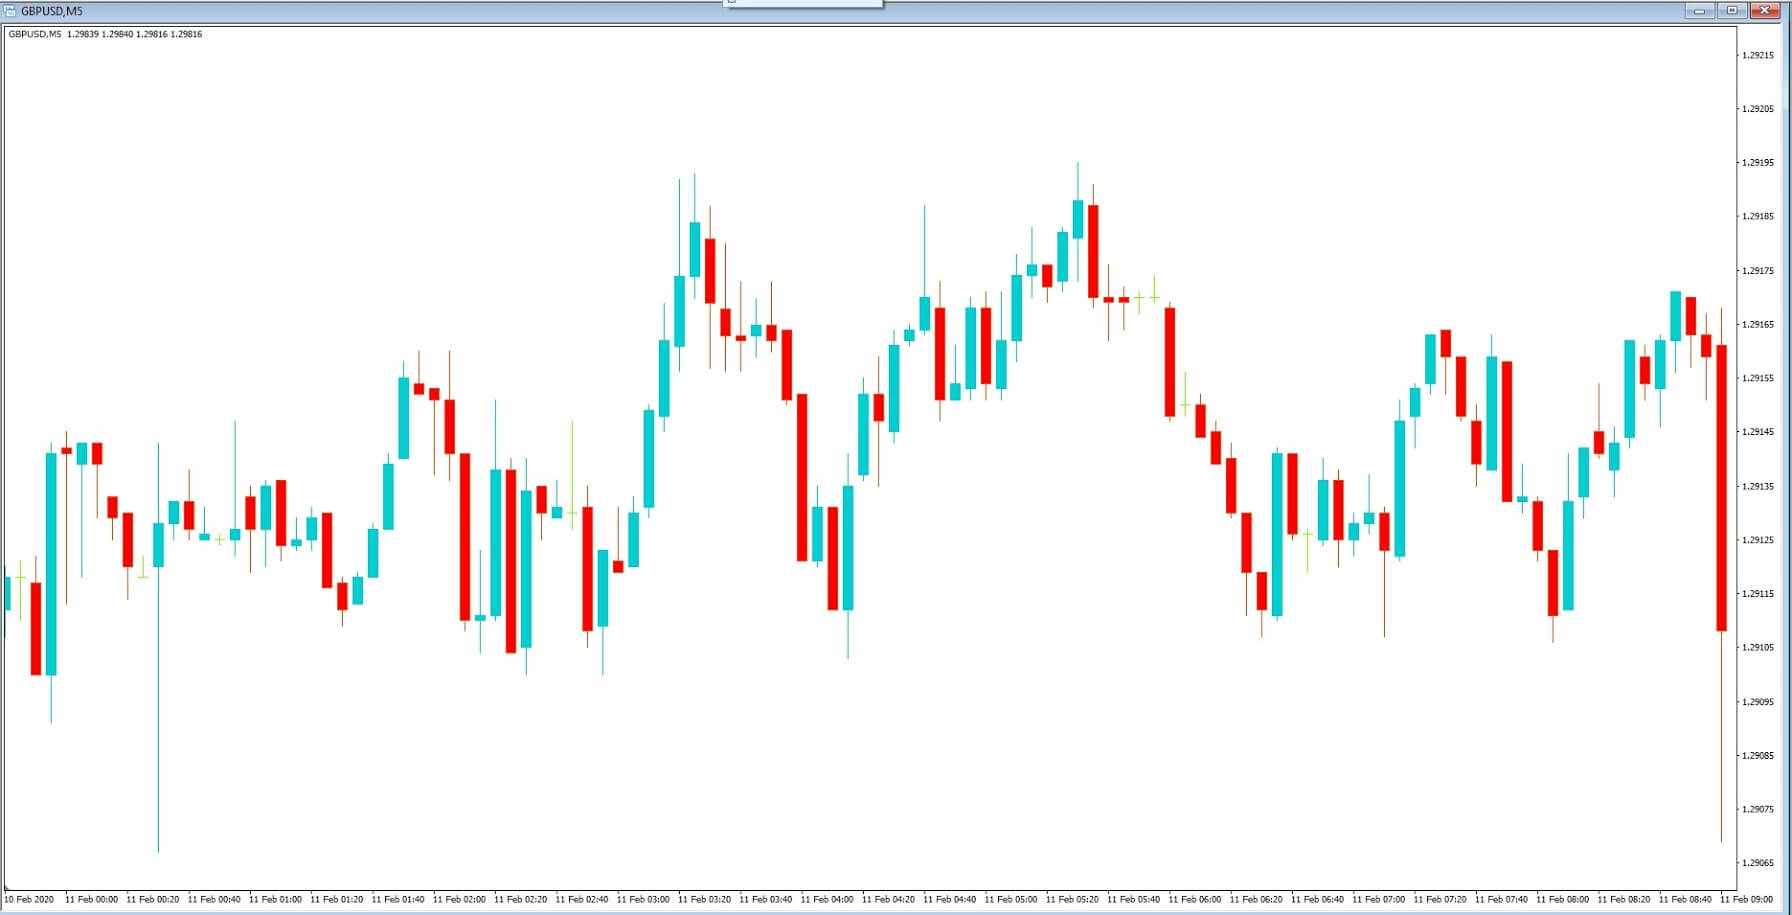
So what exactly is a double top? Let’s take a look at example A, which is a 5-minute chart of the GBPUSD and where only price action is shown on the chart.
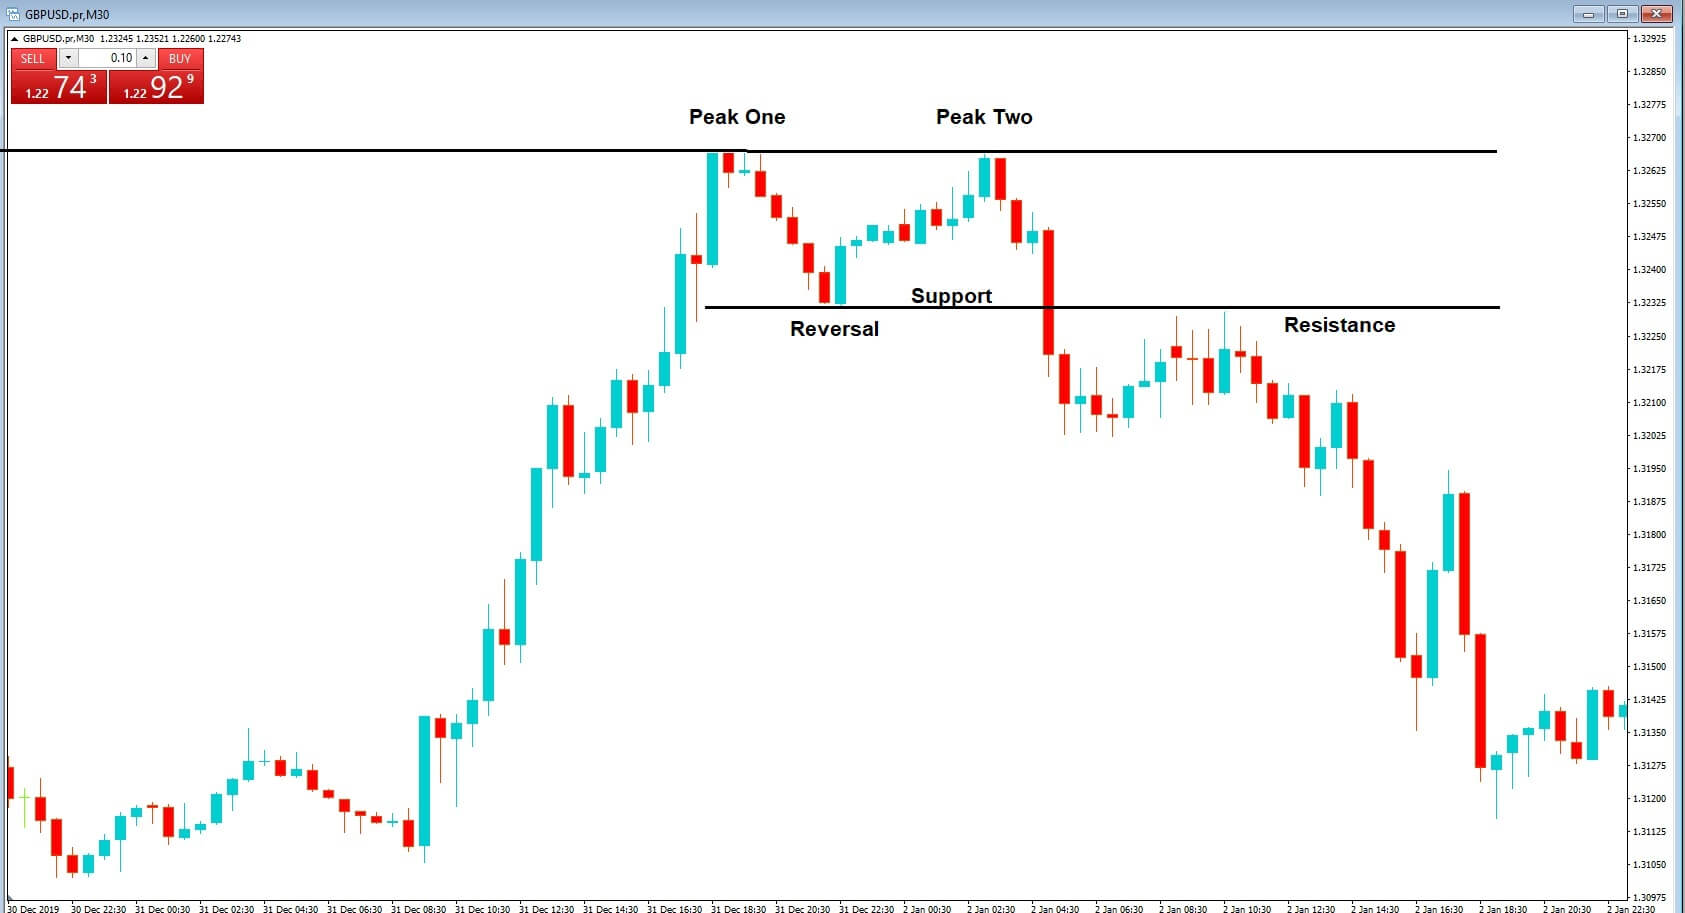
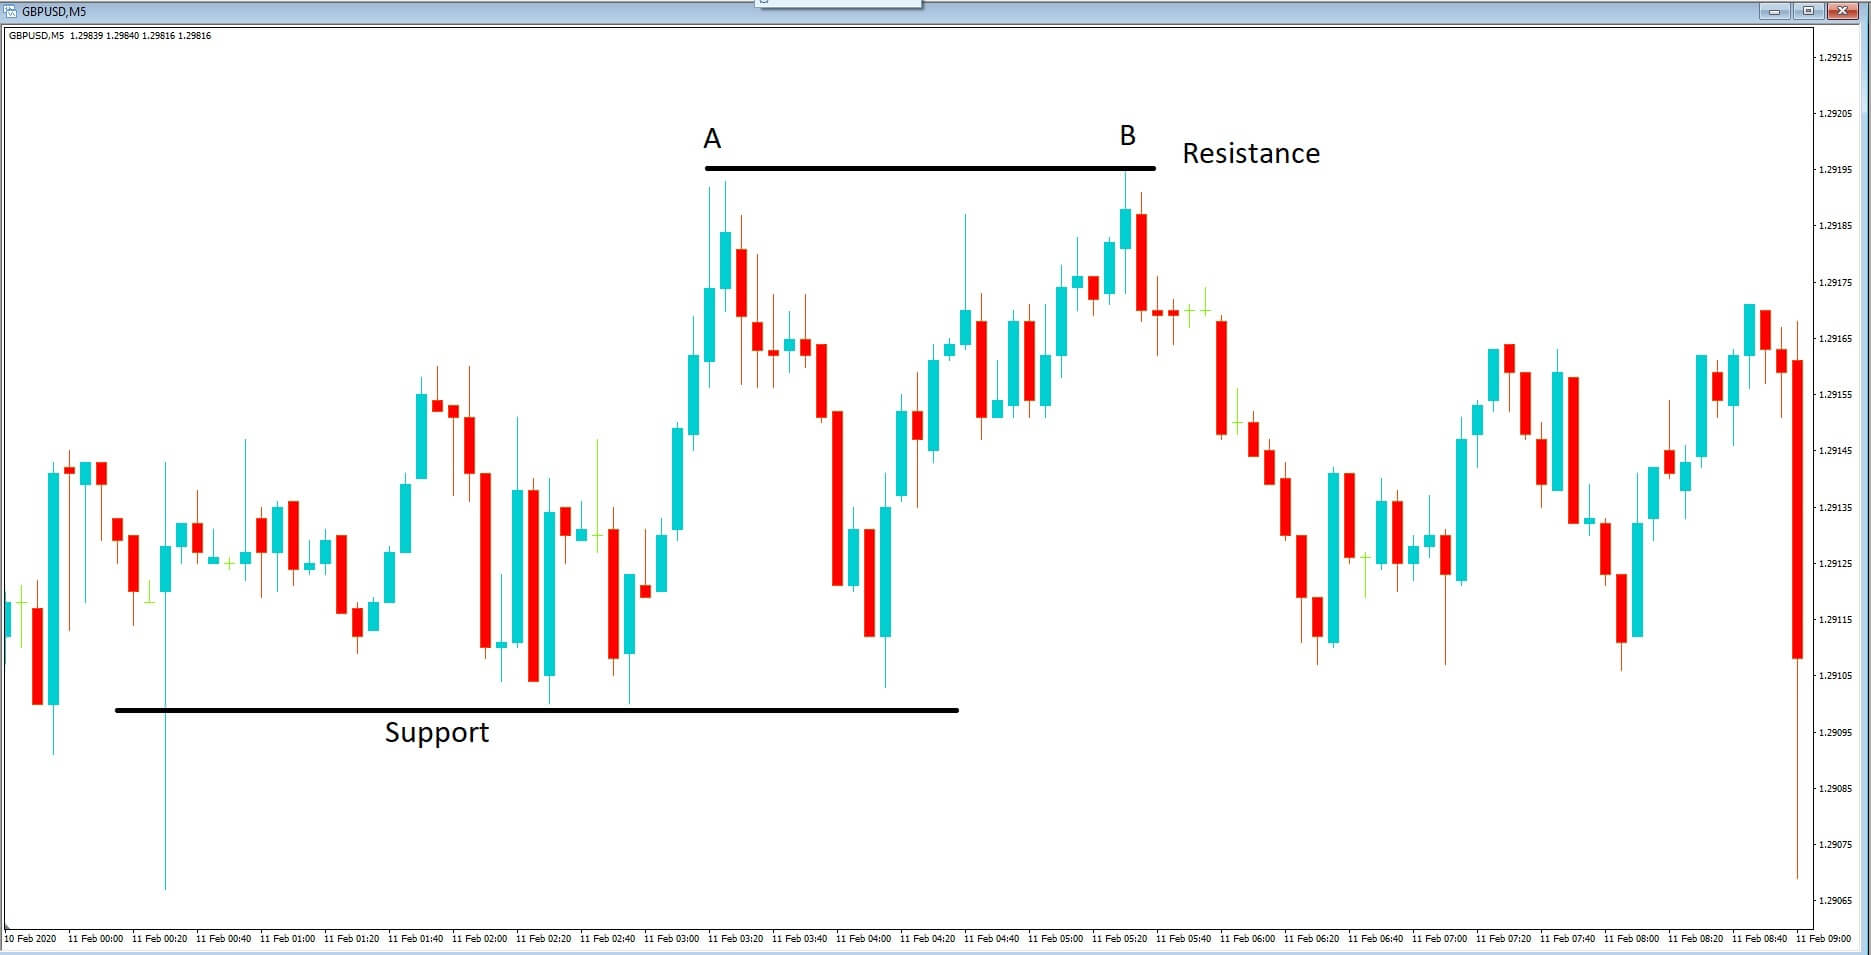
Example B
Now, let’s drill down a little further on this chart as per example B, pair and where we have a high at position A and where we have had a pullback, followed by another push higher at position B, and where the price action stopped at the same level as position A, before selling off again.
So what is the rationale behind this double top? Traders read their charts from left to right, because they tell a story of how price action is unfolding as time goes on. Firstly we have the area of support which has seen price action fails to go lower on at least two occasions, which will have been observed by traders, and where price action moved higher from this line, and then ran out of steam at position A, before retreating, and whereby traders would again keenly observes the area of support and therefore started to close out their short positions when price failed to breach the support line while expecting a reversal. This does indeed happen and where we see price action move up to position B, and where traders would have noted the reversal at position A, and used that as a possible area of resistance, and therefore exited their long trades when price failed to move higher than position A, and thus leaving a double top formation.
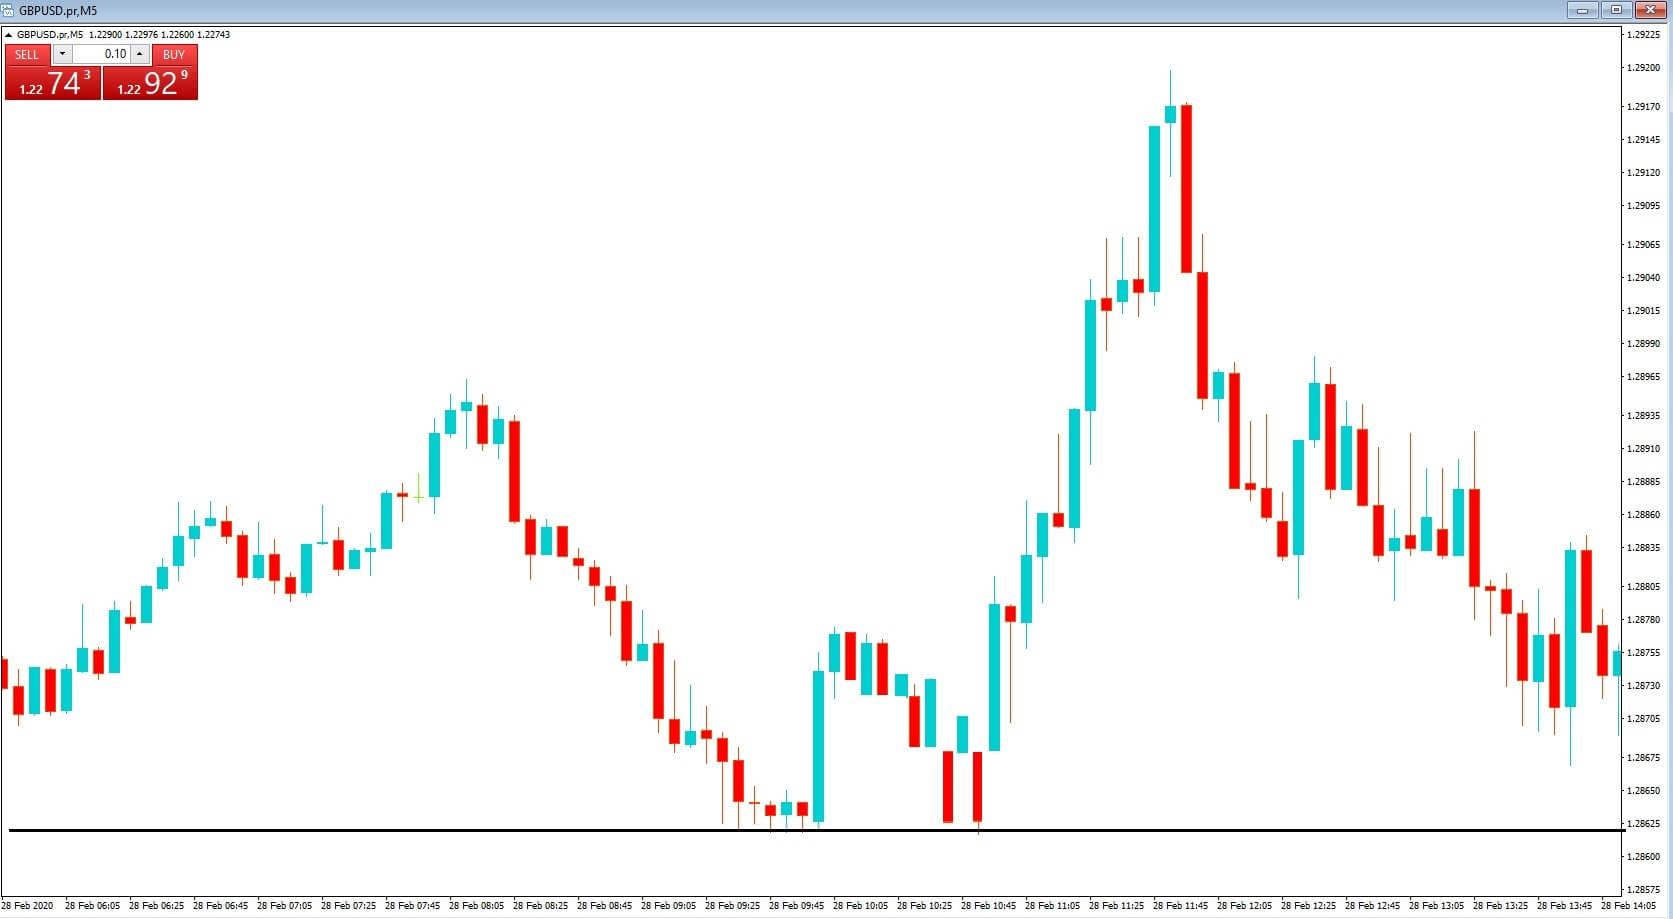
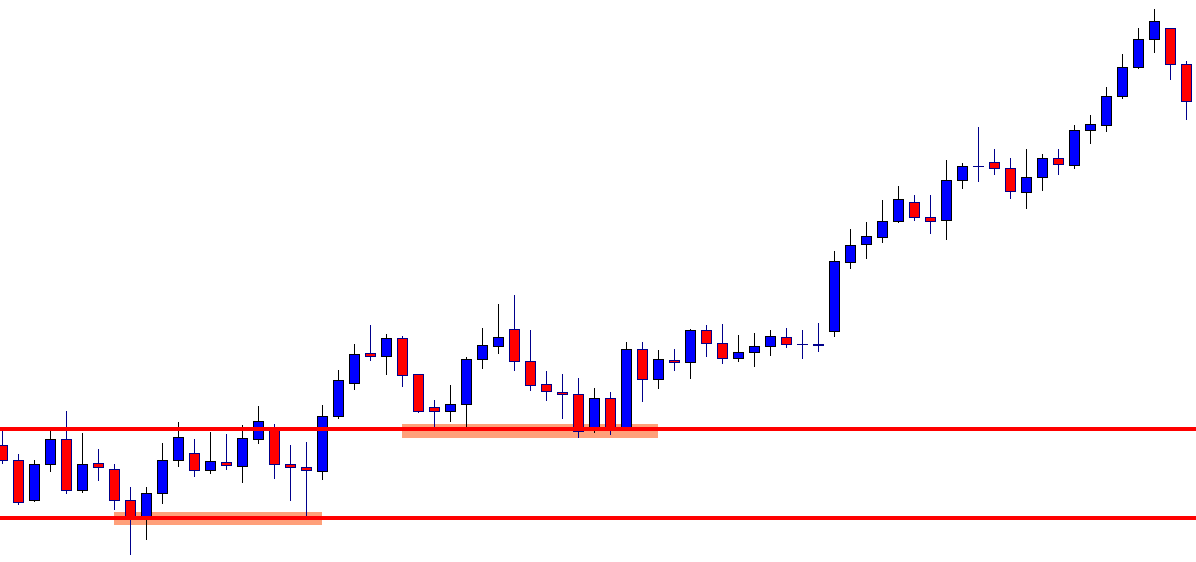
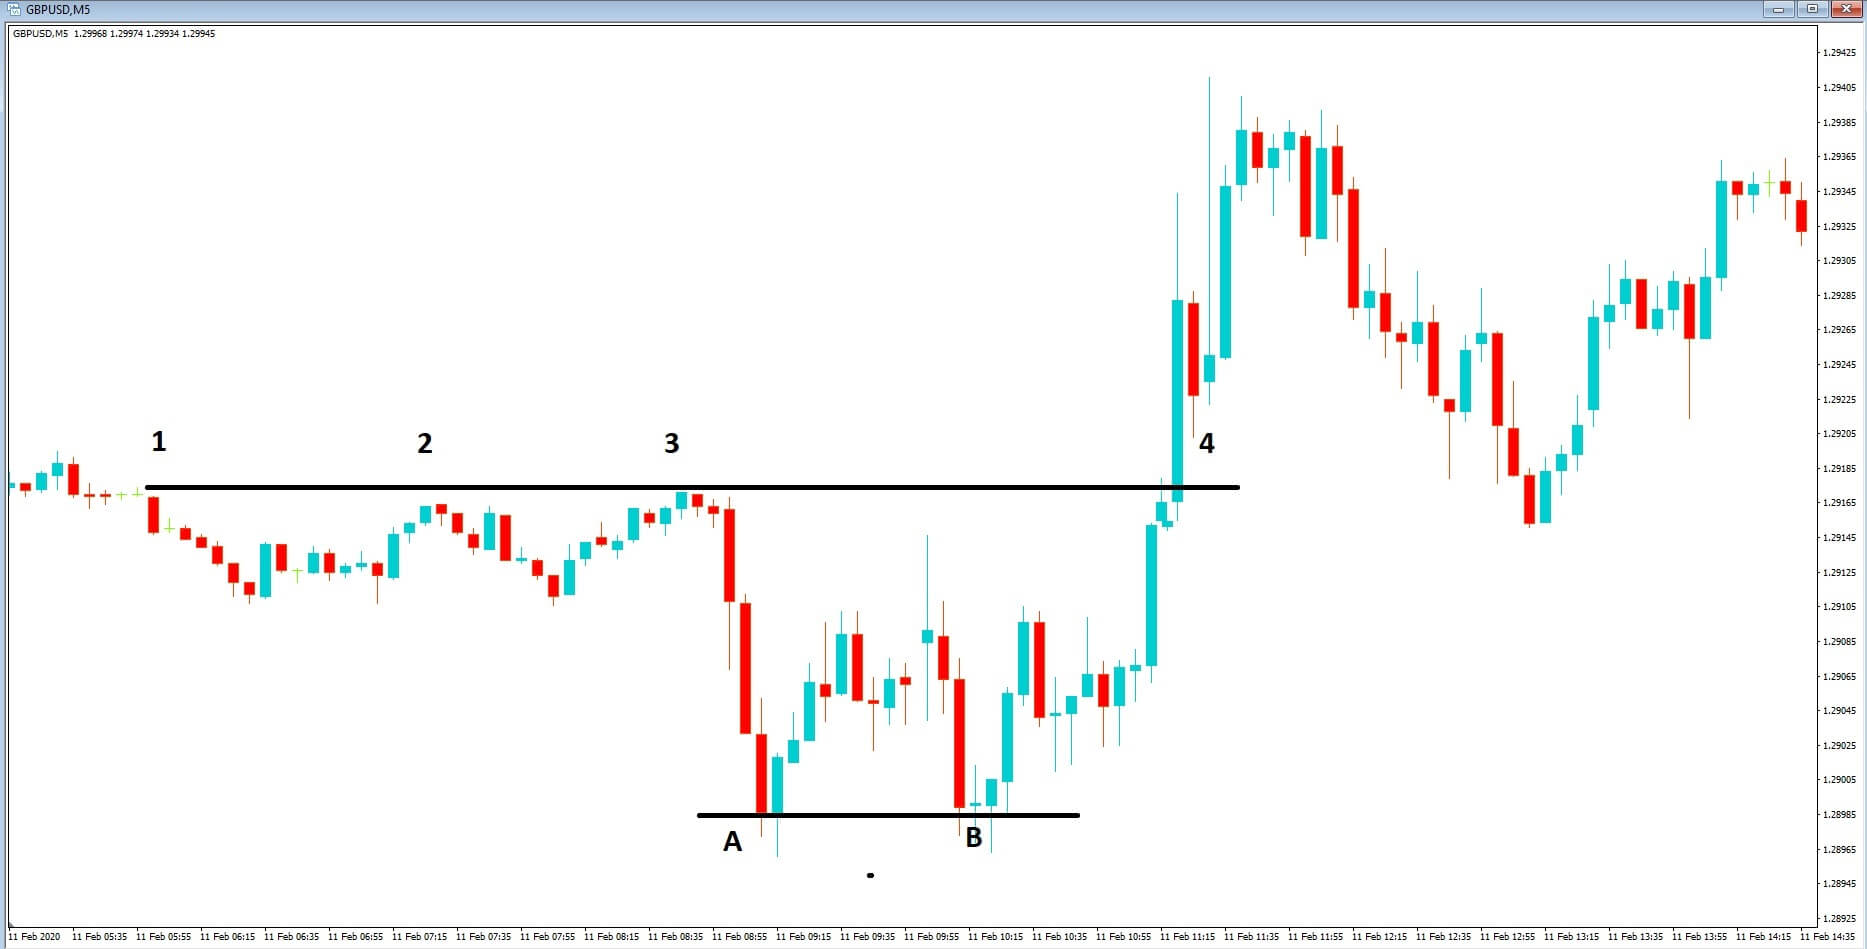
Example C
In example C, we have the reverse, which is a double bottom formation, where we can see that price has failed to breach the resistance line at positions 1 2 and 3, before moving lower to position A, and where price action failed to move any lower and where it reversed before failing to reach the resistance line, and then has a second attempt to move lower to the support line at position B. Thus forming a double bottom formation.
Incidentally, we can see that eventually, price action does move higher and breaches the line of resistance at position 4, which then becomes a line of support for future price action.