
In today’s lesson, we are going to demonstrate an example of double bottom support, which does not end up producing entry. However, the price comes back to the level of support again, and upon producing a triple bottom, support offers a beautiful trade setup. Let us get started.
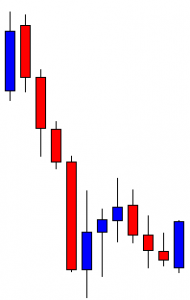
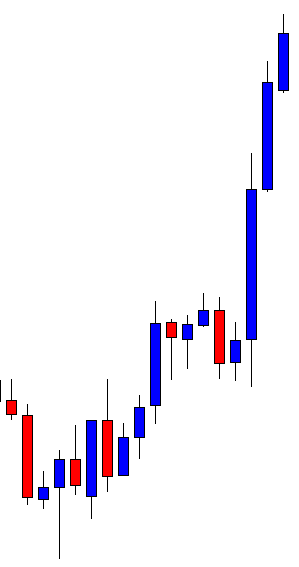
This is the daily chart. The price makes a strong bearish move and bounces off at a level of support. It produces a bullish inside bar and heads towards the North. The price comes back to the level of support again upon producing a bullish engulfing candle. The buyers may flip over to the H4 chart for the price to consolidate and produce a bullish engulfing candle to trigger a long entry.

We are still on the daily chart. The H4 chart does not consolidate or produce a bullish reversal candle. On the daily chart, the price comes down again and consolidates around the level of support. Both the buyers and the sellers are to wait for the price to see what it does. Does it produce a bullish reversal candle, or does it make a bearish breakout?
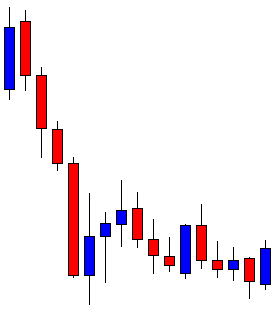
The chart produces a bullish engulfing candle at the level of support again. It has become a level of triple support. Thus, the buyers may be more interested in going long in the pair. The buyers may flip over to the H4 chart now.
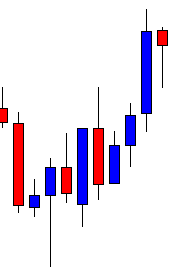
This is how the H4 chart looks. The last candle comes out as a hammer. The buyers are to wait for a bullish engulfing candle to trigger a long entry. Let us proceed to the next chart to find out what the price does.
The price consolidates for four more H4 candles. At last, it produces a bullish engulfing candle closing well above consolidation resistance. It takes a long time to produce the signal candle, but it does just before the day ends. It is a valid signal. The buyers may trigger a long entry right after the last candle closes by setting take profit with 1R.
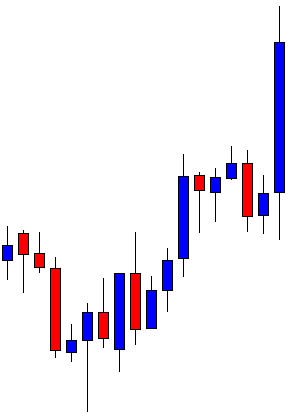
The price heads towards the North with good momentum and hits the target. The extreme bullishness of the signal candle makes the price hit the target in a hurry.
If we look back, when the chart produces the first bullish engulfing candle at the level of double bottom support, it does not end up offering an entry. When it bounces again at the same level of support, it ends up offering an entry. This is what may happen more often than traders think. If a buyer leaves the chart when it does not offer entry, he will lose the chance to make a profit from the trade setup that we have demonstrated here.