
Price action trading is considered one of the most effective and easiest ways of trading. Traders are to follow a few rules and be disciplined to be a successful price action trader. One of the most important factors is marking the support/resistance zone/level. If a trader draws support/resistance zone/level; accordingly, trade management gets easy for him. In today’s lesson, we are going to demonstrate an example of how important it is to mark support/resistance levels on our trading chart and manage trade accordingly.
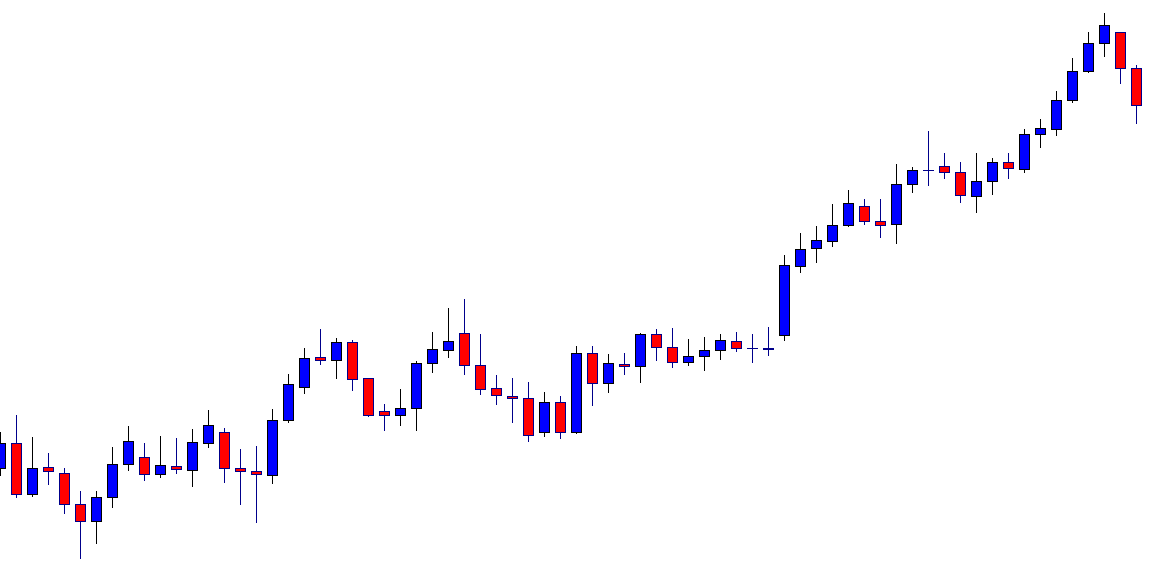
This is a daily chart. The chart shows that the price after being very bullish produces two bullish candles consecutively. The first candle comes out as a bearish engulfing candle as well. Thus, major intraday charts’ traders may flip over to their charts and look for short opportunities. However, before we proceed, we must mark significant levels that may work as a level of support. Think about the levels that you may mark as the level of potential support. If you are done, proceed to the next chart.
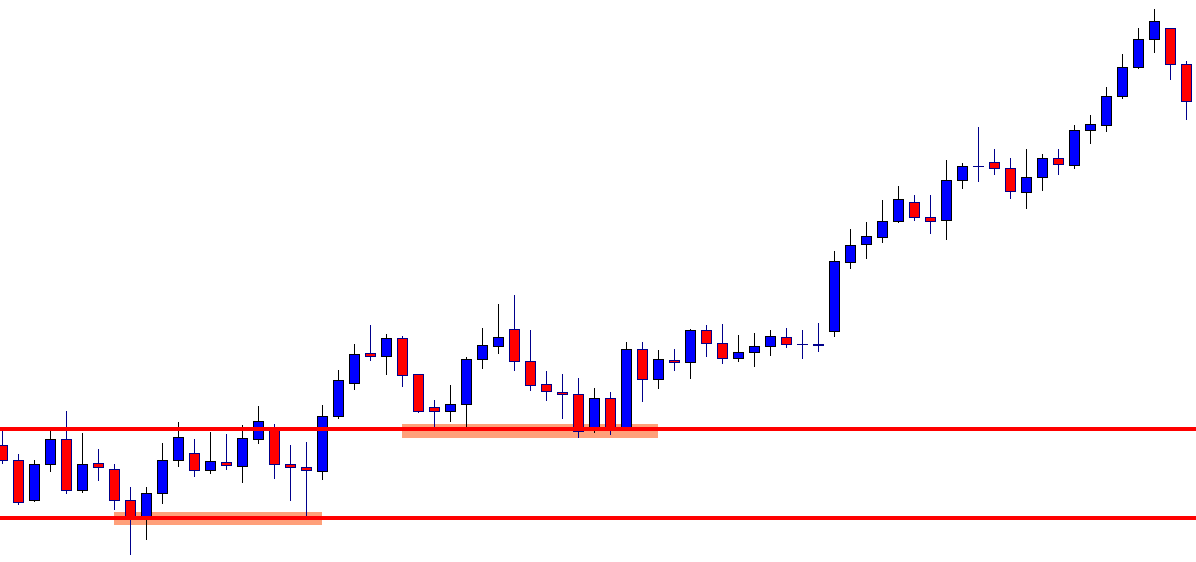
These two levels may work as a level of support. The line below is the most significant level on this chart because this is the lowest low, and this is where the trend starts. The line above is quite significant since it produces a double bottom earlier. There are levels where the price reacted earlier. Thus, they may work as flipped support. However, two marked levels are crucial as far as this chart is concerned.
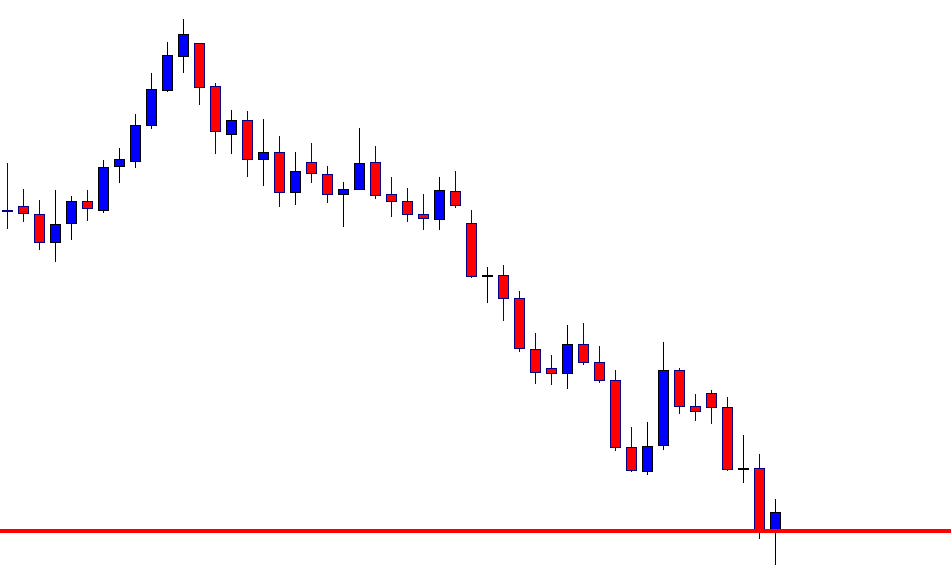
The chart produces a bullish reversal candle right at the marked level. It has been extremely bearish. The second last candle comes out as a strong bearish candle as well. Price action traders usually keep their eyes on a chart like this to go short upon breakout. That does not happen here. It produces a bullish inside bar. The chart is still the sellers’ paradise. Nevertheless, it is a bullish reversal candle, and it may change the whole equation on this chart. To have a better idea, let us zoom out the same chart.
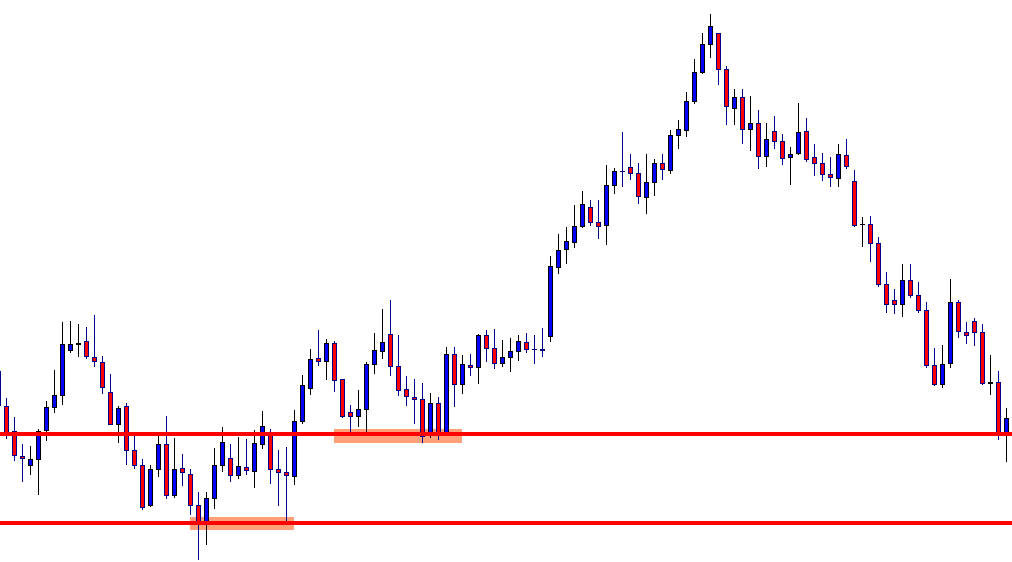
The chart now tells the whole story. Do you recognize these two marked levels now? The sellers shall plan about trade management before the price hits such levels. It is often seen the price makes a big anti-trend move after reaching such levels. The reason is many traders/ big traders set their take profit at such level. Once they get out of the market with their profit, the price goes another way around, causing an abrupt opposite move. This may make traders lose money and lose profit. Let us make sure we learn how and where to mark the support/resistance zone/level and manage our trade accordingly.