Trading Crypto using Double Top and Bottom patterns
This year has brought many uncertainties in all aspects of the world, especially health and finance. Cryptocurrencies have not been an exception, either. For the past couple of months, the sentiment has changed from very bullish to very bearish. The trend changed as quickly and sharply as the sentiment did. This is why we will cover the patterns which signal a trend reversal, called “double top” and “double bottom.
Double Top pattern
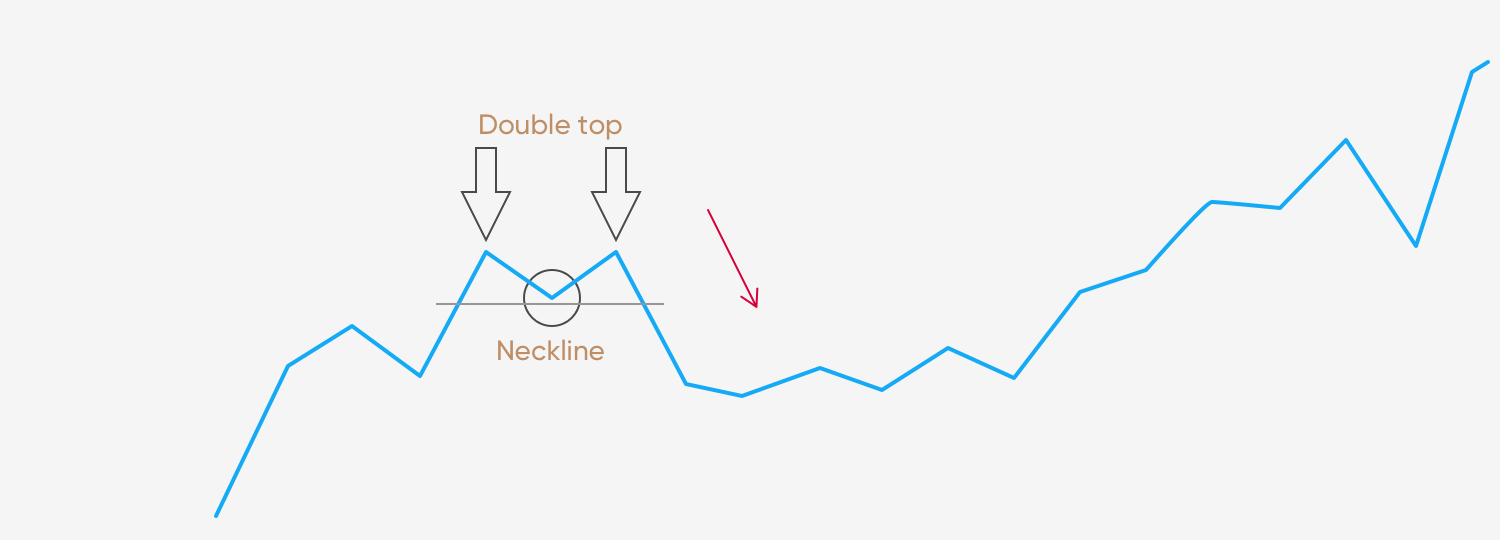
This image represents a double top pattern. After a cryptocurrency’s has trended upward for a while, it will create a top in price. Investors will often close their positions during this pause of the market, thus creating a downward trend in price. Shortly after that, the value rises again, reaching a second top at almost the exact same price as the previous one. These two tops form a double top pattern, which is essentially a test of the market.
The market is tested in terms of whether the price is susceptible to be nudged higher or not. The downward trend after the second top shows that the market does not have enough of a drive to go further up and that it will trend downward again. In a nutshell, the distinct shape of a double top that is quite similar to the letter M represents a bearish move.
Double Bottom pattern
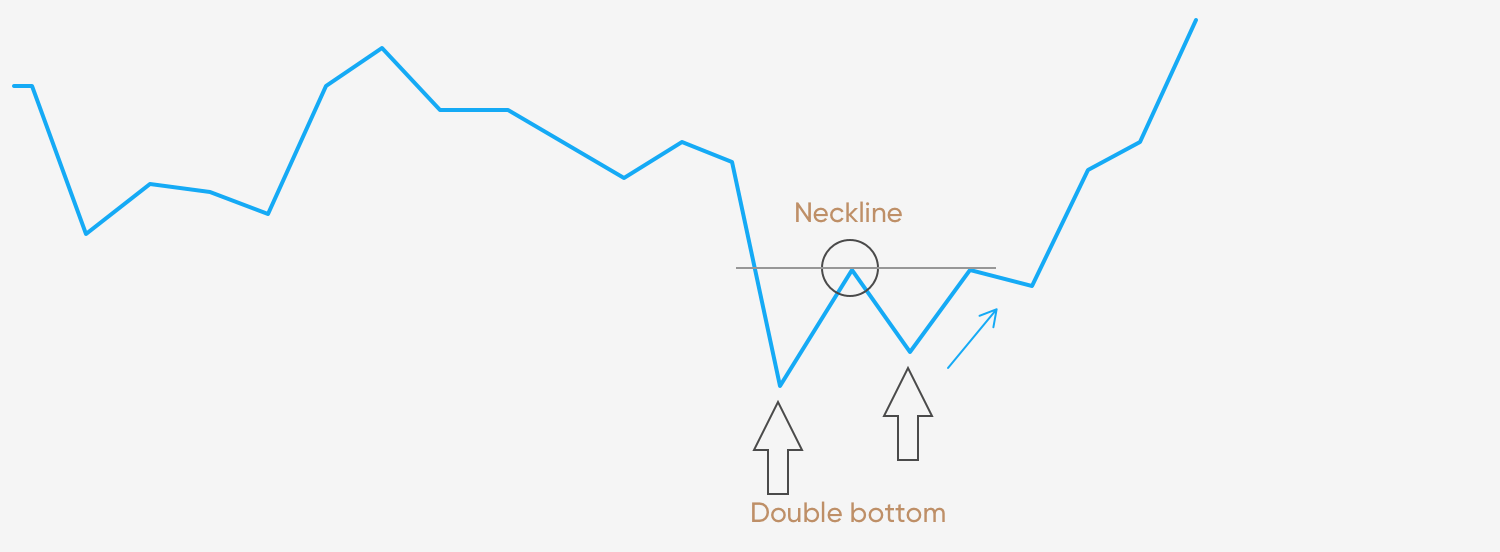
As expected, the double bottom represents everything that the double top represents, but in reverse. Rather than testing the upside of a cryptocurrency, the market testing comes after a downward move and tests if the market is ready to go further down. The double bottom pattern is recognized by the two inverted peaks that are formed at approximately the same price level.
When it happens that the downward trend has been tested twice, and the bottom has been found, then the market will reverse, and the uptrend will start. In a nutshell, the distinct shape of a double bottom that is quite similar to the letter W represents a bullish move.
Additional information

The double top pattern and the double bottom patterns are price reversal indicators. However, there is always the risk that you will encounter a false reversal, meaning that the price movement will play out just the way you want for a very short amount of time, and then do the complete opposite. That’s why it is important to mitigate the risk by doing a couple of things. First, set the stop-loss below the double bottoms or above the double tops. Second, make sure to wait for a candle close in your direction to get a confirmation of the trend reversal. Ultimately, you can pair trading this pattern with candlestick analysis, indicators, and other tools at your disposal.
As the last piece of advice, try to make trades where the double bottom or top will show a trend reversal to a direction of the longer time-frame trend. This way, you will trade alongside the long-term trend, which is much safer than trading against.