
Introduction
In our previous articles, we had reviewed several technical formations that render signals for potential market-entry setups in a trend reversal context or trend continuation.

In this educational article, we will review the characteristics of the double top and double bottom pattern.
The Nature of Double Top and Bottom
The double top and double top formations are the most popular trend reversal technical patterns in financial markets. These patterns characterize themselves by developing an internal “M” and “W” structures on double tops and double bottoms respectively.
Considering the fractal nature of financial markets, the technical trader can detect these formations in any timeframe, from intraday chart to monthly range.
The double top formation tends to be tough to identify, especially if the second peak is higher than the first one. This situation occurs because the technical trader could be waiting for the uptrend continuation or a bullish trap.
The Setup Rules
The price action will generate an entry signal if the price breaks and closes below (or above) the swing between both peaks (or valleys), as shown in the following figure.
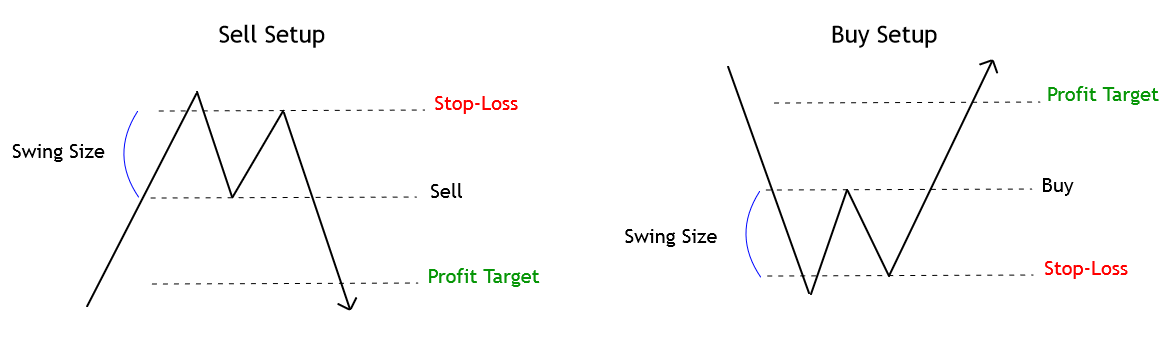
The stop-loss order will take place above the last high (or low); this distance between the entry-level and the previous top (or bottom) is known as the swing size, as illustrated in the last figure.
The double top/bottom pattern holds an easy way to identify the profit target level. The technical rule says that if the swing size is 50 pips, the profit target will locate at 50 pips from the entry-level.
The Behavior of the Double Top and Bottom Formation
Thomas Bulkowski, in his “Encyclopedia of Chart Patterns,” described the performance of double top and bottom considering some shape variations as a rounded peak or a spike.
In general, Bulkowski reveals that on average, the break-even and failure rate of the double top pattern is 11.5%, while the percentage of break-even and failure of double bottom is 6.5%. However, the double top formation tends to reach its price target 71.5%, while the double bottom tends to strike its target 51.25% of times.
Bulkowski summarizes its finds stating that some variations of double top and bottom patterns with a narrow range perform better than those that show a wide one.
Conclusions
In this educational article, we reviewed the essential reversal formation known as the double top and double bottom pattern. The setup studied provides the technical trader a one to tone risk to reward ratio, which could be increased as the trade advances in favor of the trend.
In the next article, we’ll review the use of Fibonacci tools as retracements and extensions to identify trade opportunities.
Suggested Readings
- Fischer, R., Fischer J.; Candlesticks, Fibonacci, and Chart Patterns Trading Tools; John Wiley & Sons; 1st Edition (2003).
- Bulkowski, T.; Encyclopedia of Chart Patterns; John Wiley & Sons; 2nd Edition (2005).