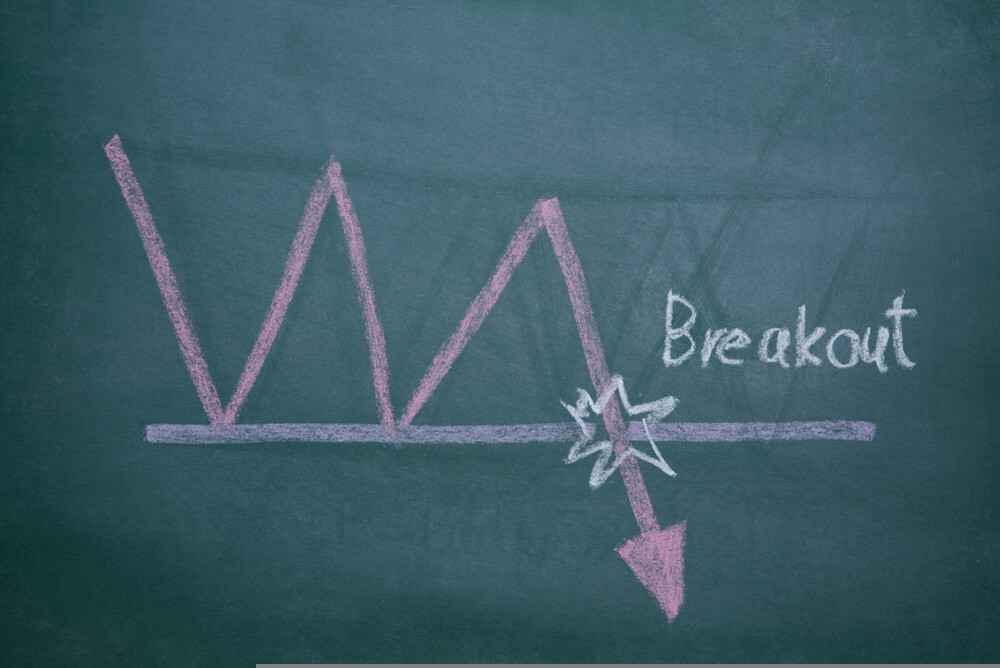
In today’s lesson, we are going to demonstrate an example of a chart where the price makes an H4 breakout at the last week’s low. However, the chart does not offer entries. It rather gets choppy. We will try to find out the reason behind that. Let us get started.

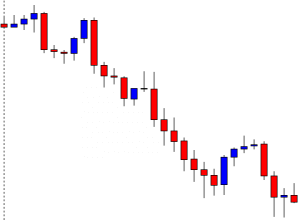
It is an H4 chart. The chart shows that the price makes a bearish move and had a bullish correction. Upon producing a bearish engulfing candle, it heads towards the South again. The market is about to close for the weekend, and the sellers are going to wait for the H4 chart to make a bearish breakout and go short in the pair.
The chart produces a Doji candle to start its trading week. The next candle comes out as a bearish engulfing candle. It seems that the pair is going to make an H4 breakout at the week’s low soon.
The chart produces a long bearish candle closing well below the week’s low. It does not consolidate but produces a spinning top with a bearish body. The chart looks bearish, and the sellers may love to wait for the price to consolidate and to offer them a short entry. The question is whether they should wait to go short in the pair or not.
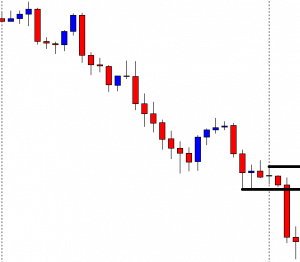
Look at those two drawn lines. One at the above indicates the highest high of the current week. The other one at the bottom indicates the lowest low of the last week. The difference between these two lines is vital. It determines the length of the next move. Usually, the price travels twice the distance of that length with good momentum. Once it travels three times that distance, the price usually makes longer consolidation or correction. The price travels three times that distance here. Thus, it may make a long bullish correction.
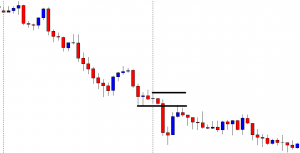
The chart produces a bullish engulfing candle followed by another bullish candle closing within the last week’s lowest low. The chart then creates an inverted hammer and drives the price towards the South. Look at the pace of that bearish move. It has been sluggish, and it suggests that the sellers are not interested in going short in this chart. The price has been roaming around the last swing low for quite a while. In a word, the H4 traders must wait for the price to give them the next direction. Meanwhile, it is a chart not to invest money and time in.