
In today’s lesson, we are going to demonstrate an example of an H4 chart, which seems to be offering several entries. However, a trader has to be very calculative before taking an entry. Some entries are there to be taken, and some are there not to be taken. We would try to find out why we shall skip taking some entries. Let us get started.

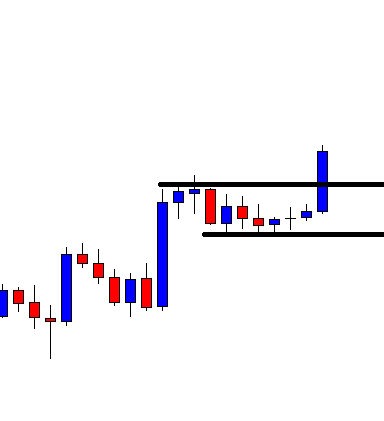
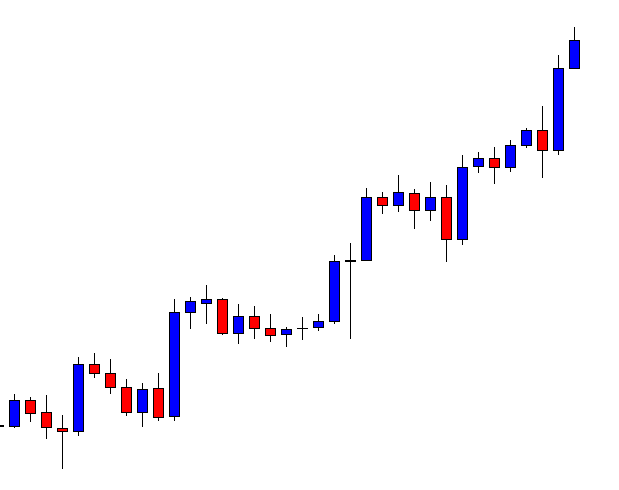
This is an H4 chart. The chart shows that the price makes a strong bullish move and consolidates for a long time. The last candle comes out as a bullish candle breaching consolidation resistance. It usually a scenario of taking a long entry. Before taking an entry, we must calculate whether the price consolidates for more than a day or not. Over here, the price consolidates more than a day. It means the level of resistance becomes daily resistance. The breakout is not for the H4-daily combination traders to trigger a long entry.
The chart shows that the price heads towards the North. The buyers may wait for the price to consolidate and get a bullish reversal candle to go long in the pair. They must keep their eyes on the pair.
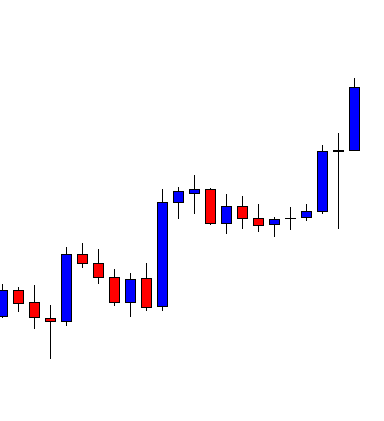
The chart produces a bearish inside bar. It may consolidate more and make a deeper consolidation. This is what the buyers are to hope for. Let us find out what the price does here.
The chart shows that the price consolidates for five candles altogether. The last bullish candle is the last H4 candle of that day. It means if the chart produces the next candle as a bullish engulfing candle, the buyers will have an opportunity to go long in the pair. Otherwise, they are to wait longer.
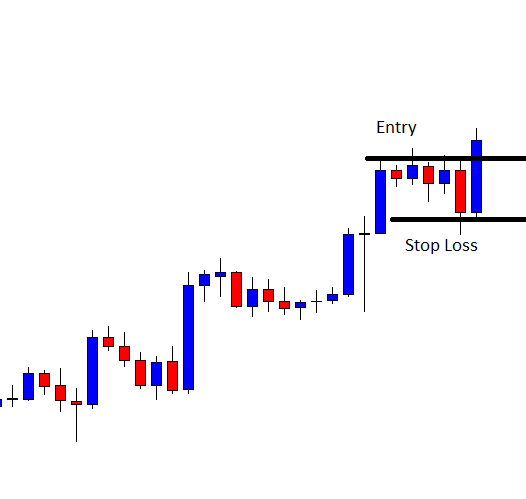
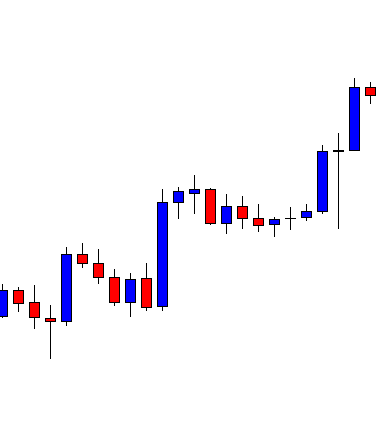
The last candle comes out as a bullish engulfing candle breaching consolidation resistance. The buyers may trigger a long entry right after the last candle closes by setting stop loss below consolidation support and by setting take profit with 1R.

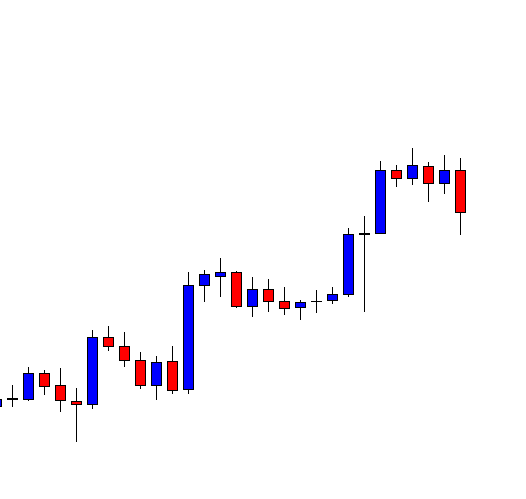
The price consolidates again and produces a bullish engulfing candle. It seems the bull is going to dominate in the pair for a long time since it finds another level of support. When price trends like that, traders add more positions, and the price keeps trending relatively for a longer time.
Here it is. The price hits the target of 1R. They buyers grab some green pips. Yes, they wait for the price to hit the target. Some traders may take a partial profit out of it and let the rest of the trade run to grab more pips.
In this lesson, we have demonstrated that traders may take the second entry and skip the first one because of the daily resistance factor. Traders must calculate these things before taking entry.