Introduction
The Bollinger Bands is a technical analysis tool that uses a statistical measure of the standard deviation to establish levels of highs and lows in a trend. The upper band shows a level that is statistically high, and the lower band shows a statistically low level. The width correlates to the volatility of the market. This means, in volatile markets, Bollinger bands widen while in less volatile markets, the bands narrow.
In today’s strategy, we utilize this feature of the Bollinger band to anticipate a reversal in the market. But Bollinger bands alone are not sufficient in generating reliable signals. Along with the Bollinger bands, we use the Awesome Oscillator to confirm the reversal of a trend. Let us understand how both indicators can be combined to generate reversal signals.
Time Frame
Time frames suitable for trading this strategy are 1 minute, 5 minutes, and 15 minutes. Therefore, this a perfect strategy for ‘Scalpers.’
Indicators
Three indicators are applied to the chart listed below.
- Bollinger bands (20,2)
- Bill Williams’ Awesome Indicator
- Exponential Moving Average (EMA)
Currency Pairs
The ‘Awesome’ strategy should ideally be traded with major forex currency pairs only. Liquidity and volatility are especially necessary for the strategy to work at its best, which is provided only by major pairs. Some preferred ones are EUR/USD, USD/JPY, AUD/USD, GBP/USD, GBP/JPY, EUR/JPY, CAD/JPY, and NZD/USD.
Strategy Concept
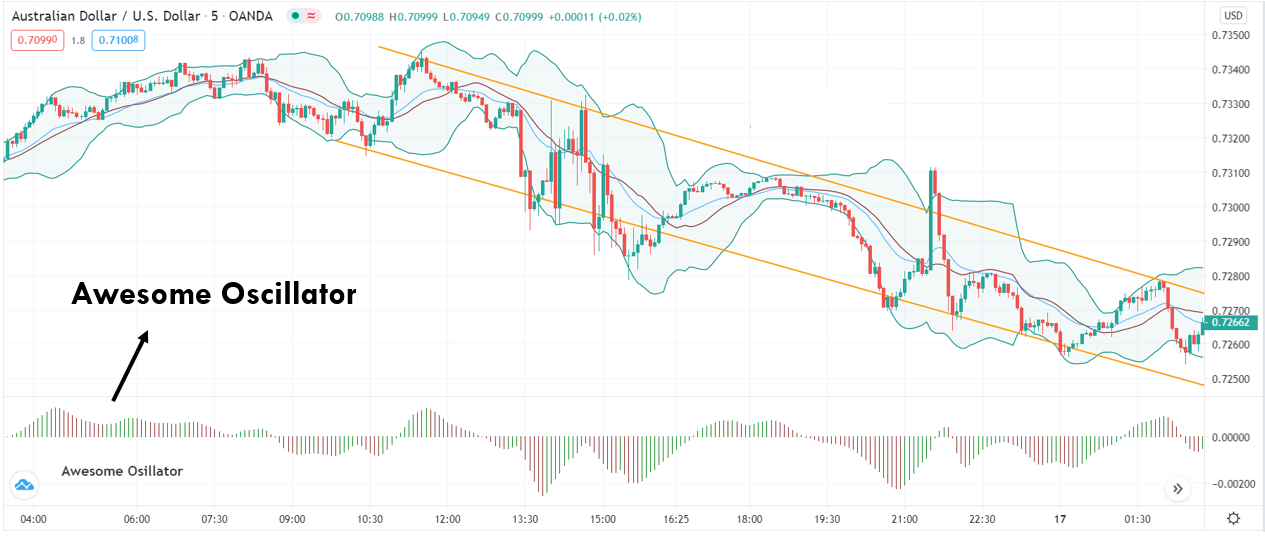
Apart from the Bollinger band, we use the awesome oscillator indicator that attempts to gauge whether bearish or bullish forces are driving the market. It market momentum indicator, which compares recent market movements to historical movements. It uses a line in the center, either side of which price movements are plotted according to a comparison between two different moving averages. We use this awesome oscillator to forecast a shift in market momentum and whether the prevailing trend will continue or reverse.
We look for ‘buy’ opportunities when EMA crosses up through the middle Bollinger band. At the same time, the Awesome Oscillator should be crossing above the zero levels. This is the first part of the reversal. We execute a ‘long’ trade at the ‘test’ of the previous ‘lower high’ that is a part of the earlier trend.
For ‘sell’ trades, we are looking for the opposite conditions of buy trades. The first condition being that the EMA crosses below the middle Bollinger band. At the same time, Awesome Oscillator also crosses below the zero-line. Finally, we enter at the ‘test’ of the ‘higher low’ of the previous trend.
A stop-loss a placed below the lowest point of the downtrend in an upward reversal while it will be above the highest point of the uptrend in a downward reversal.
Trade Setup
In order to execute the strategy, we have considered the 5-minute chart of AUD/USD, where we will be illustrating a ‘long’ trade. Here are the steps to execute the strategy.
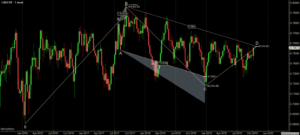
Step 1: The first step is to identify the direction of the market. We can do this in two ways. If the price is making higher highs and higher lows, the market is said to be in an uptrend. While if the price is making lower lows and lower highs, the market is in a downtrend. The trend becomes clearer when price moves in a channel and plot the same on the chart.
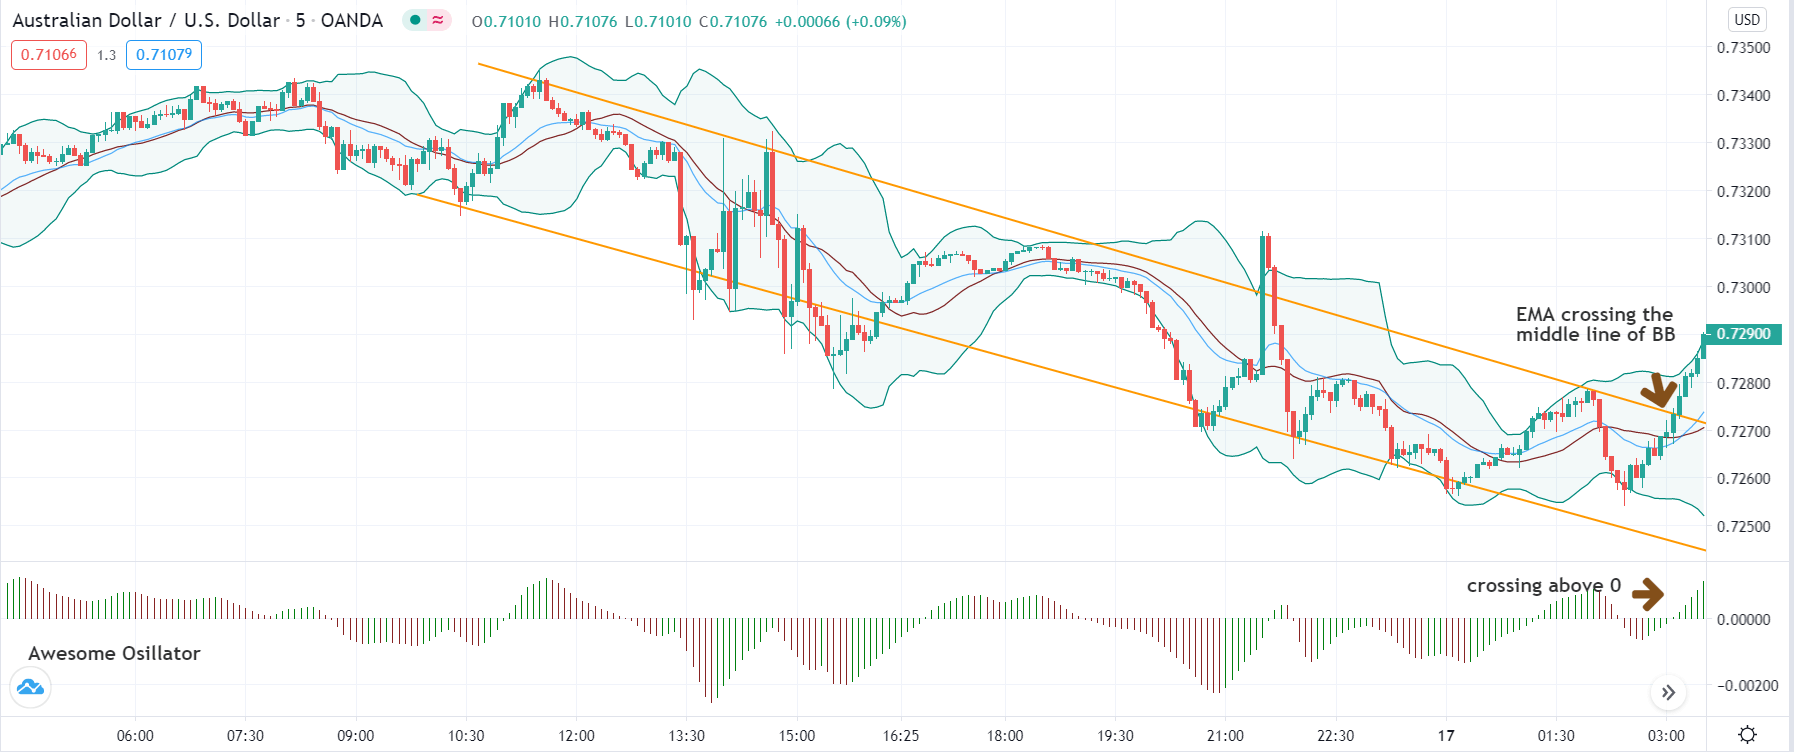
In the case of AUD/USD, we have identified a downward channel, as shown in the below image.
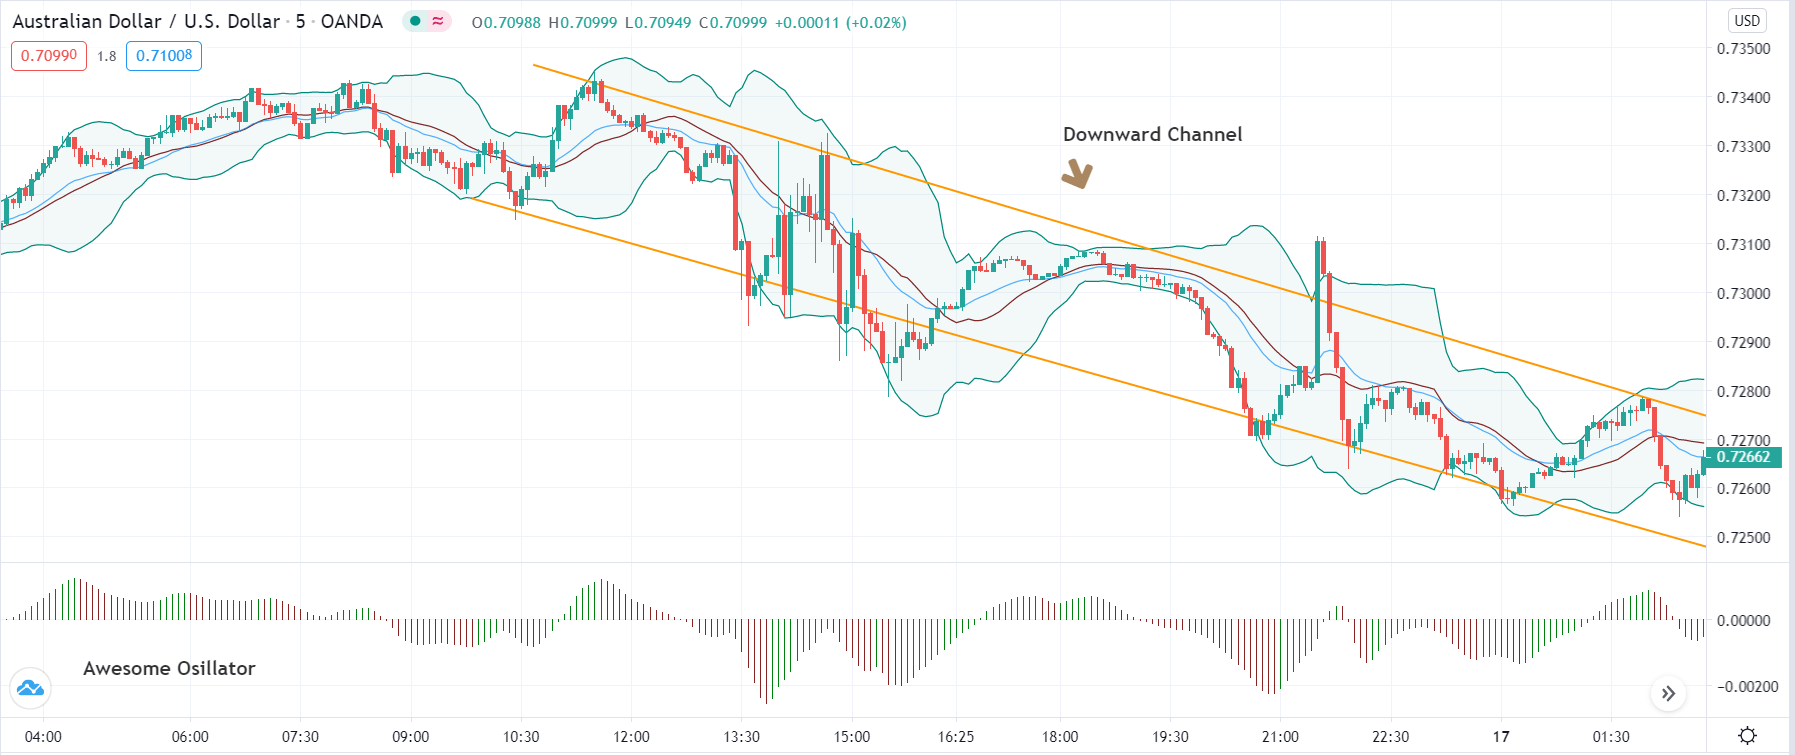
Step 2: After identifying the direction, we need to wait for a reversal in the market. We can say that a reversal is taking place in the market when price breaks the trendline and starts moving in the same direction. Trendline break is not enough. Here’s where the indicators Bollinger band, EMA, and Awesome Oscillator come handy.
In case of a downtrend, the reversal is confirmed when EMA crosses above the middle line of the Bollinger band, and the Awesome Oscillator moves from negative to positive zone. While in an uptrend, the reversal is confirmed when EMA crosses below the middle line of the Bollinger band and Awesome Oscillator goes below the ‘zero’ level. However, we do not enter the market soon after this, where we need one last thing before that.
The below image shows that when the price is not able to make another ‘lower low,’ it reverses to the upside and breaks out of the channel. At the same, price EMA crosses above the middle line of BB, and Awesome Oscillator becomes ‘positive.’
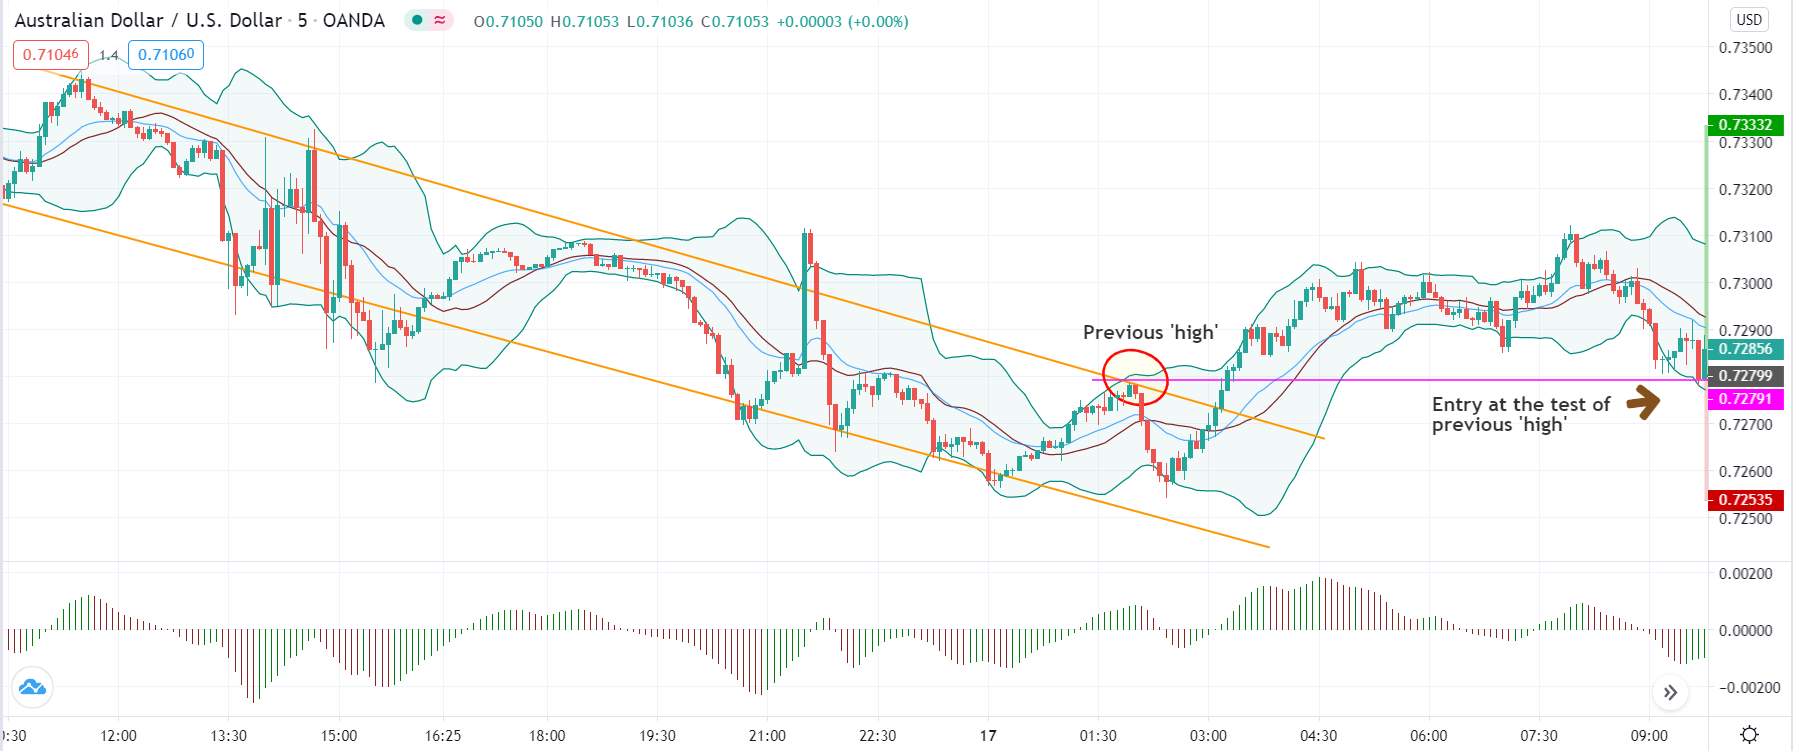
Step 3: Now, let us discuss how to enter a trade. In a downtrend reversal, we enter the market for a ‘buy’ when the price tests the ‘lower high’ of the earlier trend and puts up a bullish candle. This is when we enter with an appropriate stop-loss and take-profit. Similarly, in an uptrend reversal, we enter for a ‘sell’ when price tests the ‘higher low’ of the previous trend and puts up a bearish candle.
As shown in the below image, we enter ‘long’ only when the price reacts from the ‘lower high’ of the previous downtrend and moves higher.
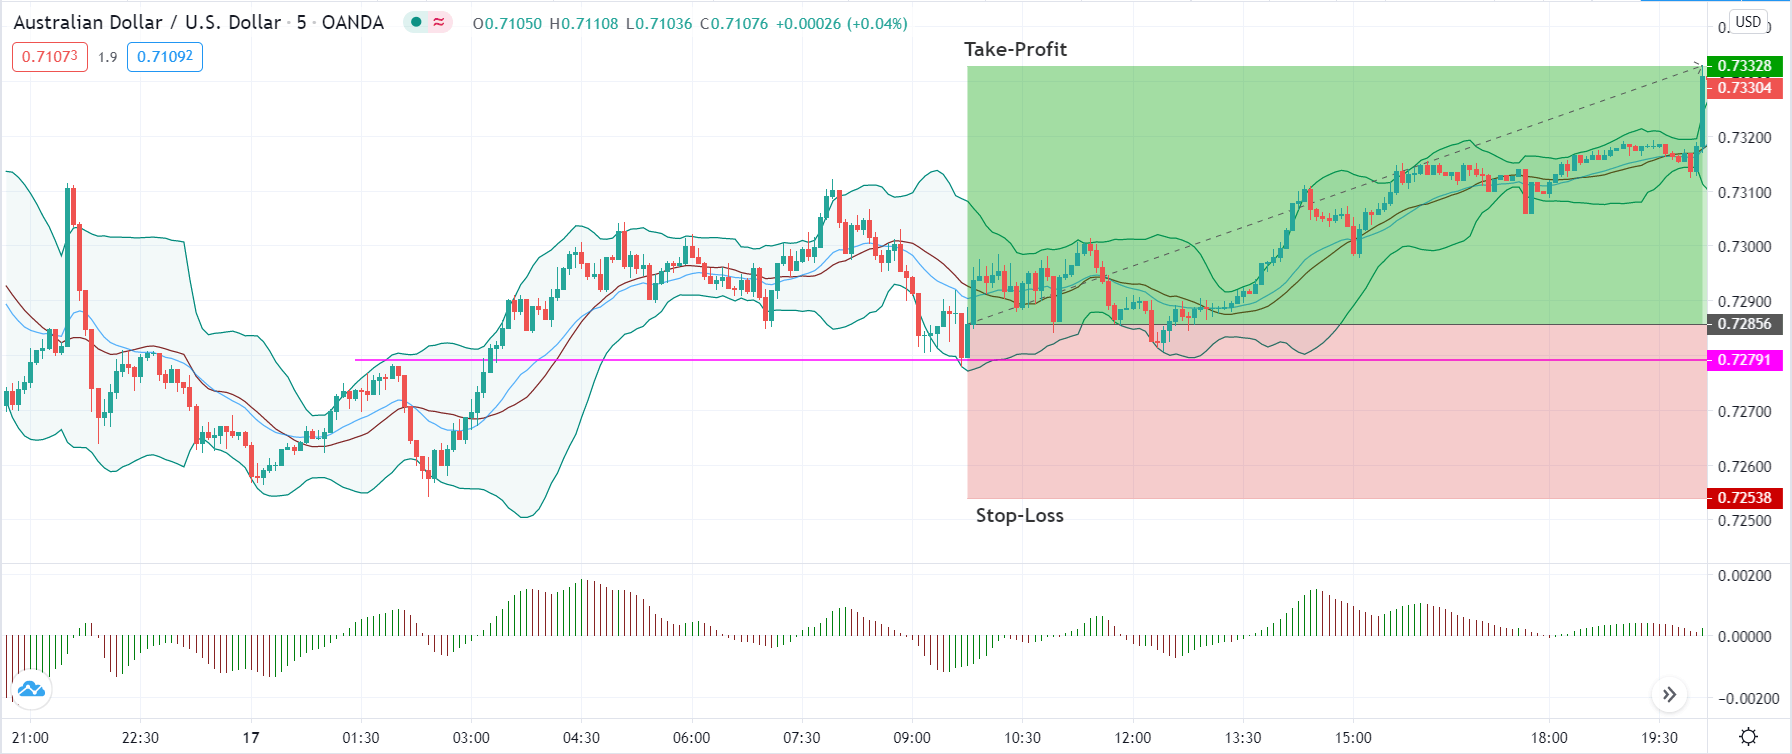
Step 4: Lastly, we determine the stop-loss and take-profit levels for the strategy. In a ‘buy’ trade, the stop-loss is placed below the lowest point of the previous trend, nothing but the lower low. While in a ‘short’ trade, it is placed at the highest point of the previous trend, nothing but the higher high. The take-profit is set in a manner where the risk-to-reward of the trade is at least 1:1. But since we are trying to grab a major reversal of the market, we move our stop-loss to break even once the market gets closer to the take-profit area.
Strategy Roundup
While it can get take a lot of effort to apply all the rules of strategy, it gets easier after little practice. Pay attention to the Awesome Oscillator, where it clearly indicates the shift in momentum in the market. Aggressive traders can also enter the market without waiting for additional confirmation from the ‘lower high’ or ‘higher low.’ All the best.