Categories
Forex Elliott Wave Forex Technical Analysis

EURJPY Consolidates Expecting Further Upsides

Technical Overview

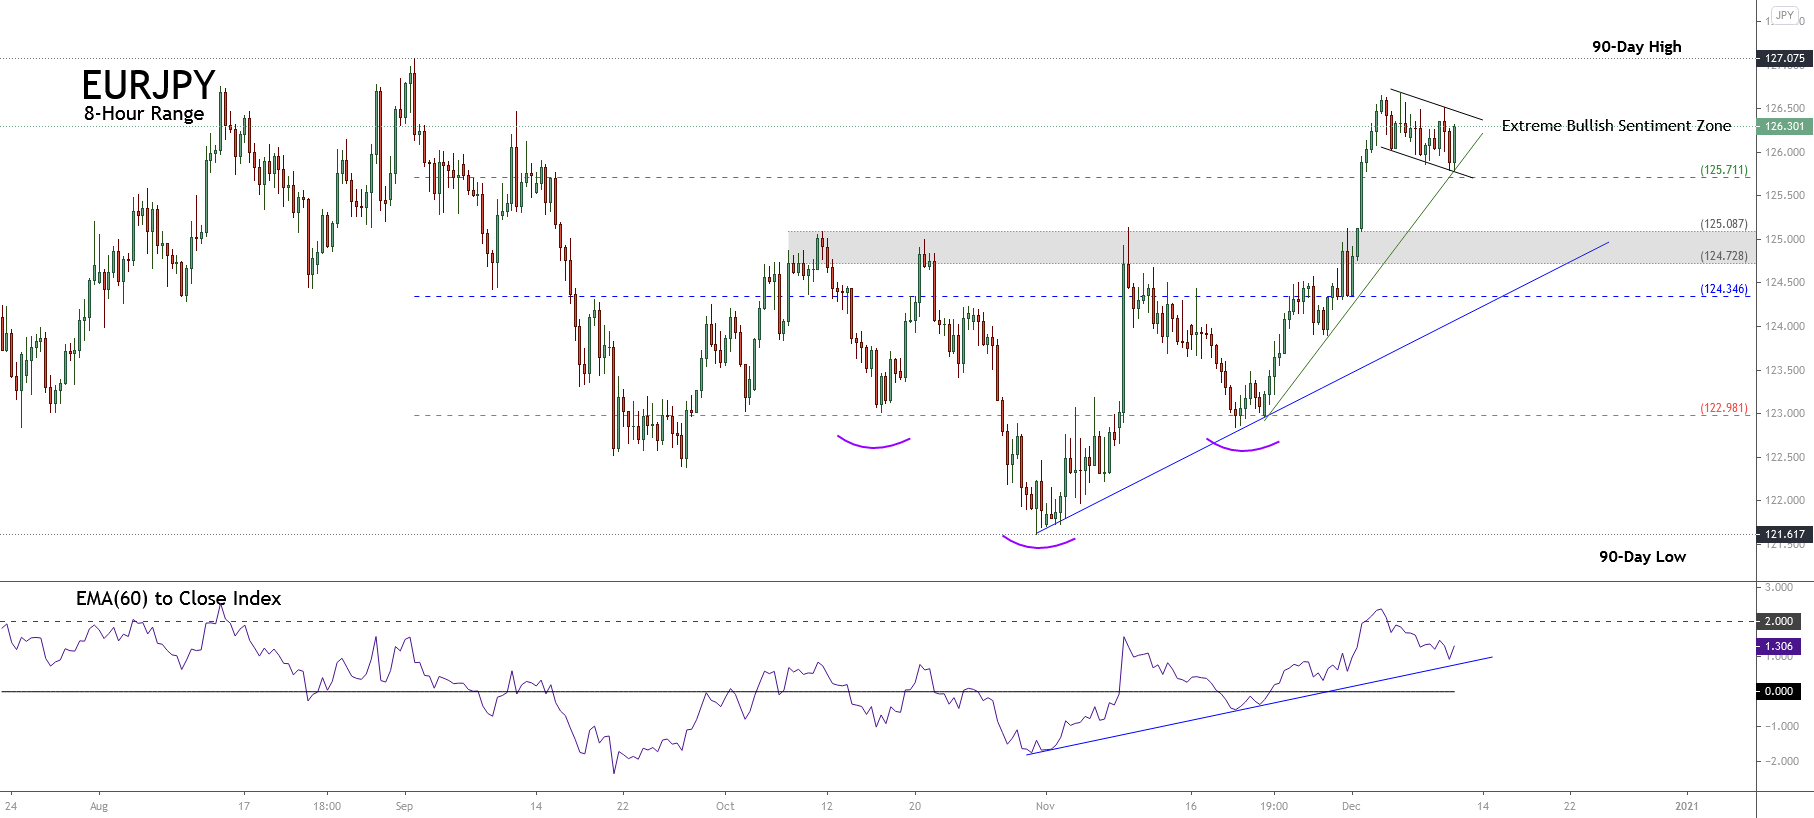
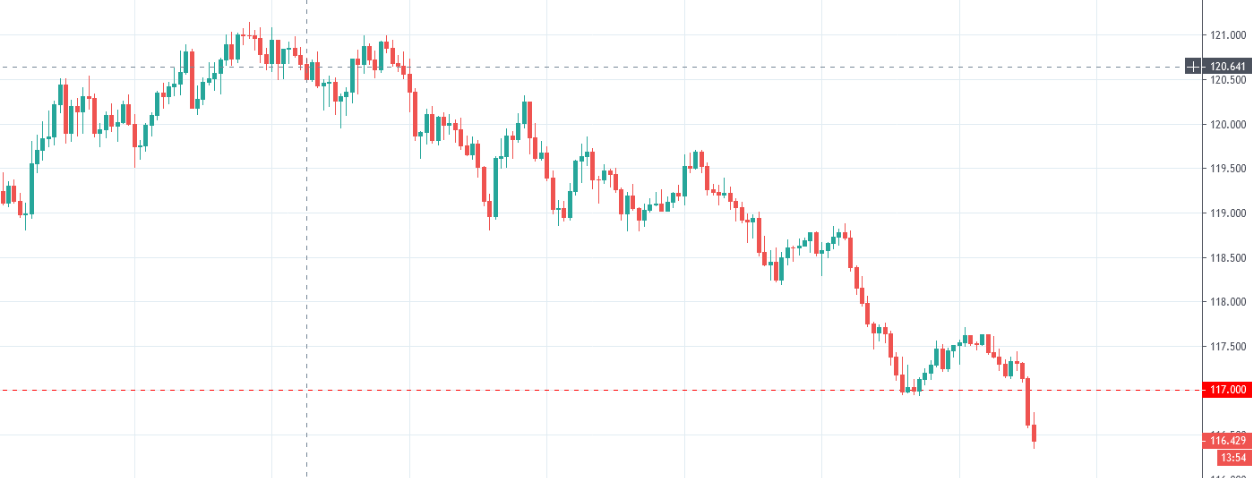
The EURJPY cross consolidates in the extreme bullish sentiment zone, suggesting a bullish continuation of the strong upward movement developed in early December.

The following daily chart exposes the EURJPY cross developing a consolidation pattern, which looks like a flag pattern bounded between 125.77 and 126.70. According to the chartist analysis, the formation suggests the continuation of the previous movement. In this case, the cross could extend its gains surpassing the next resistance corresponding to the 52-week high located at 127.075.

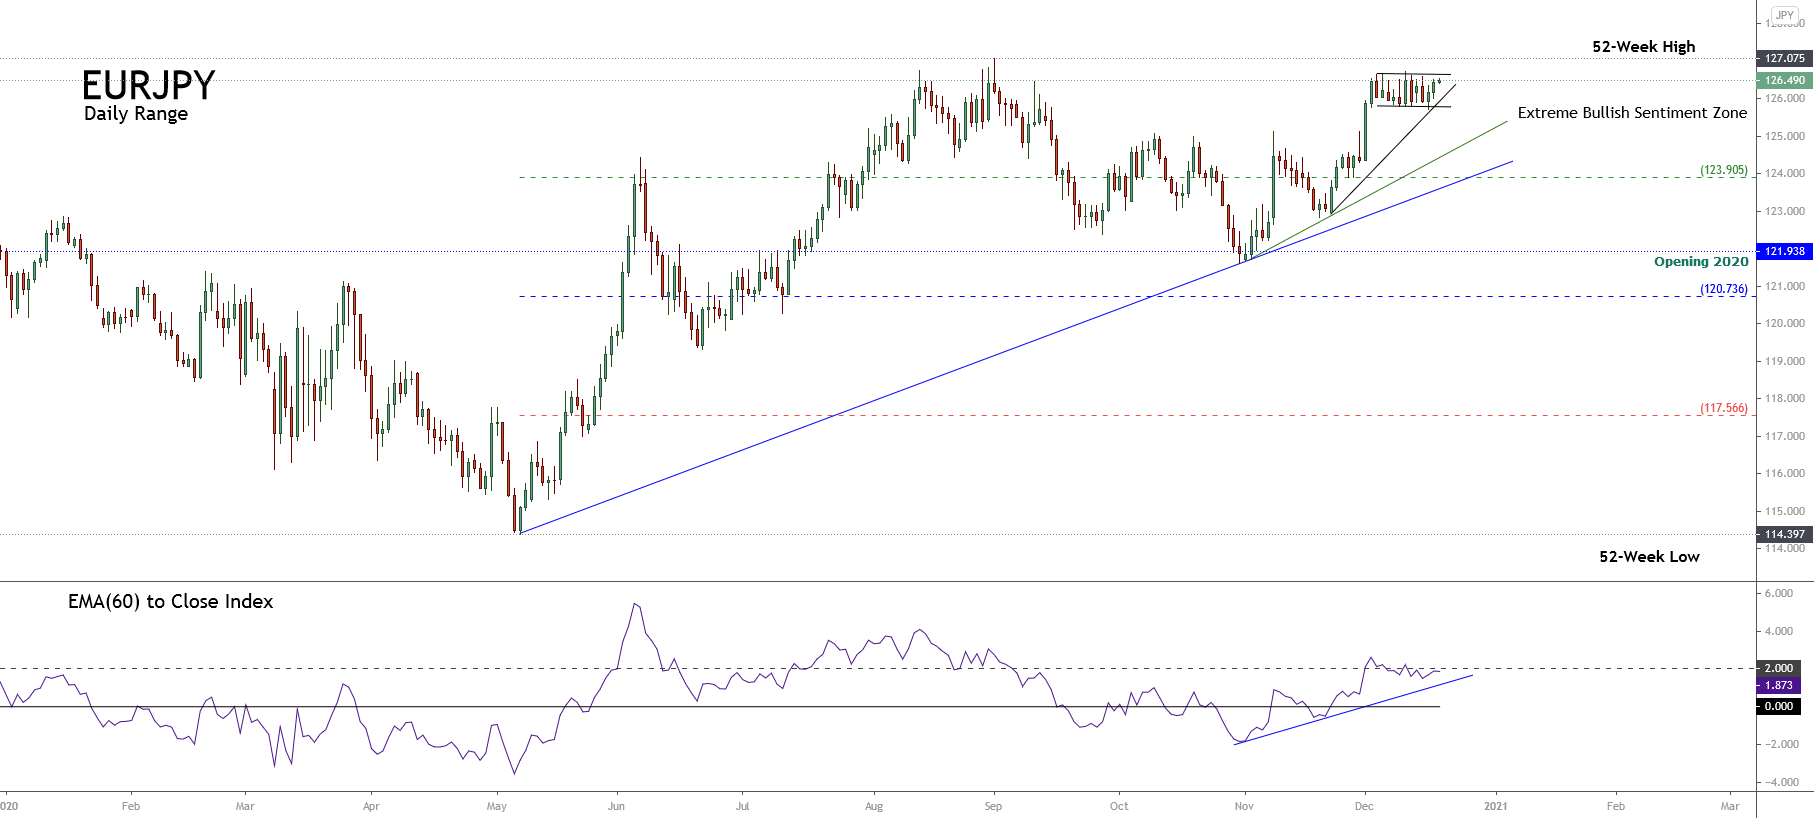
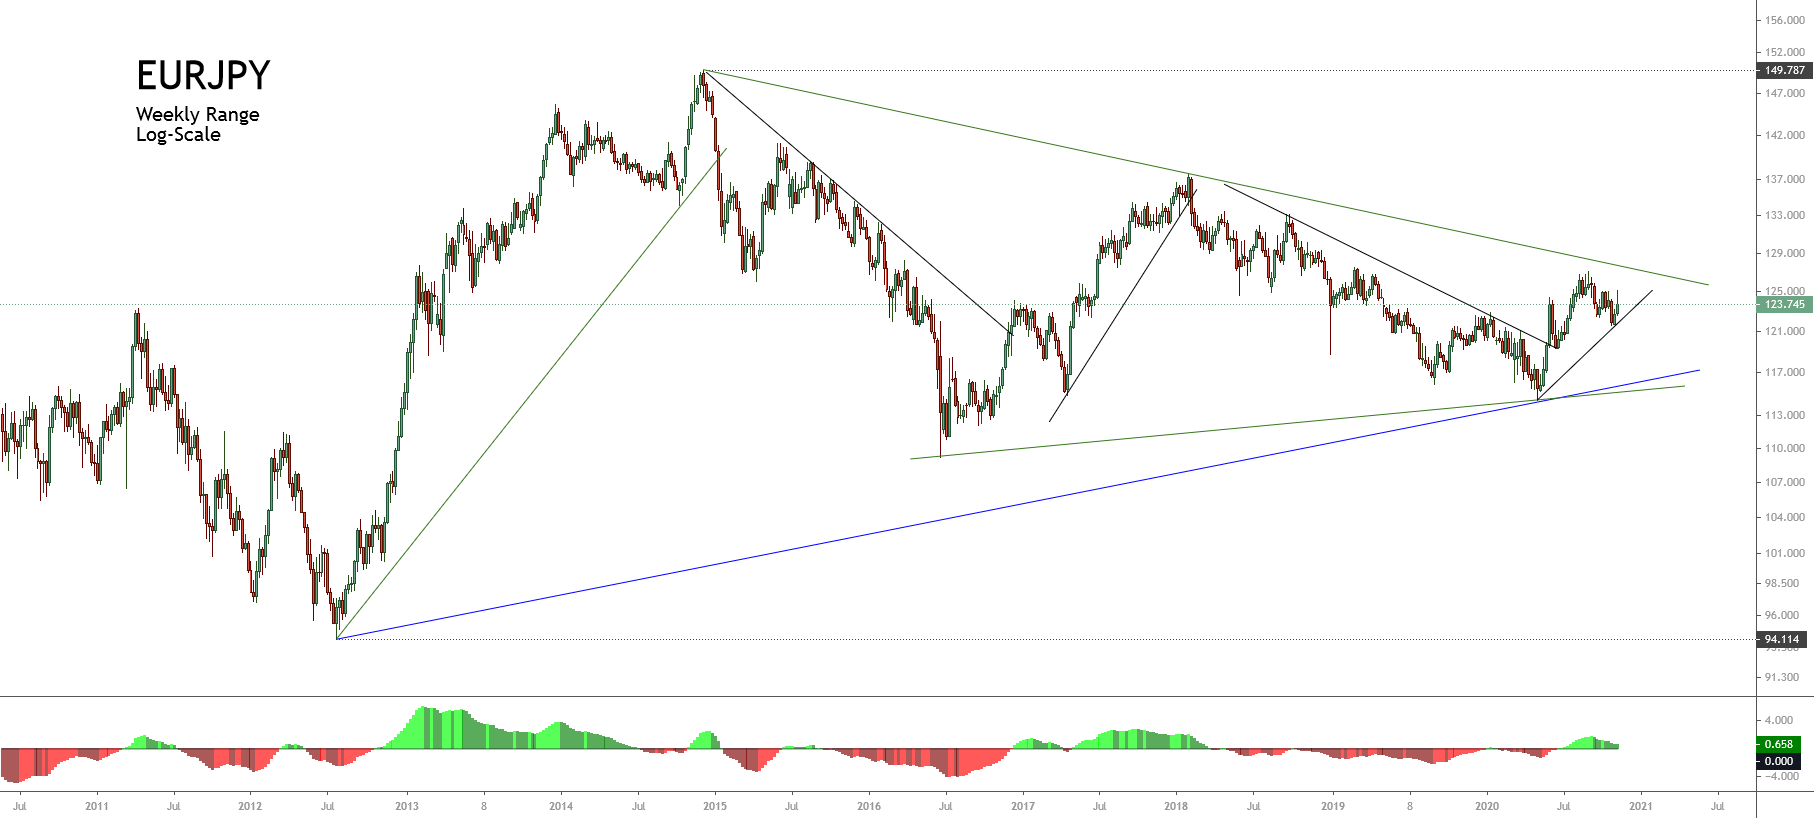
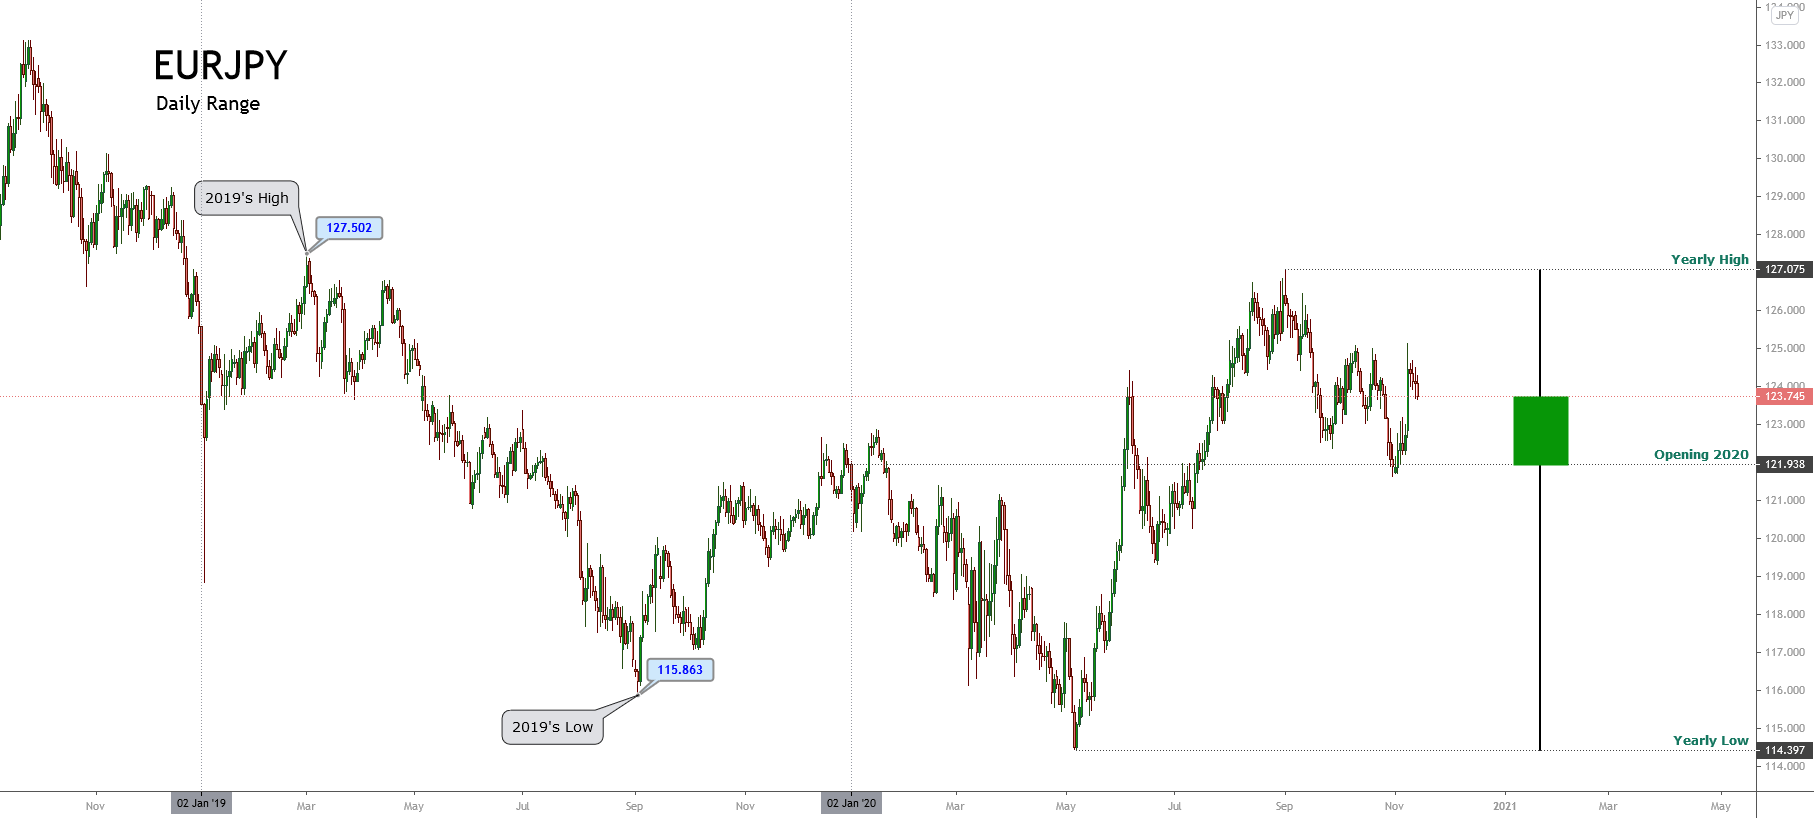
The mid-term overview for the EURJPY cross reveals its primary trend plotted in blue, supporting a rally that remains in progress since the price confirmed its bottom at 114.397 touched on last May 07th. The secondary trend traced in green and minor trend drawn in black supports the price acceleration, which currently consolidates carrying to expect the bullish continuation for the following trading sessions.

Technical Outlook

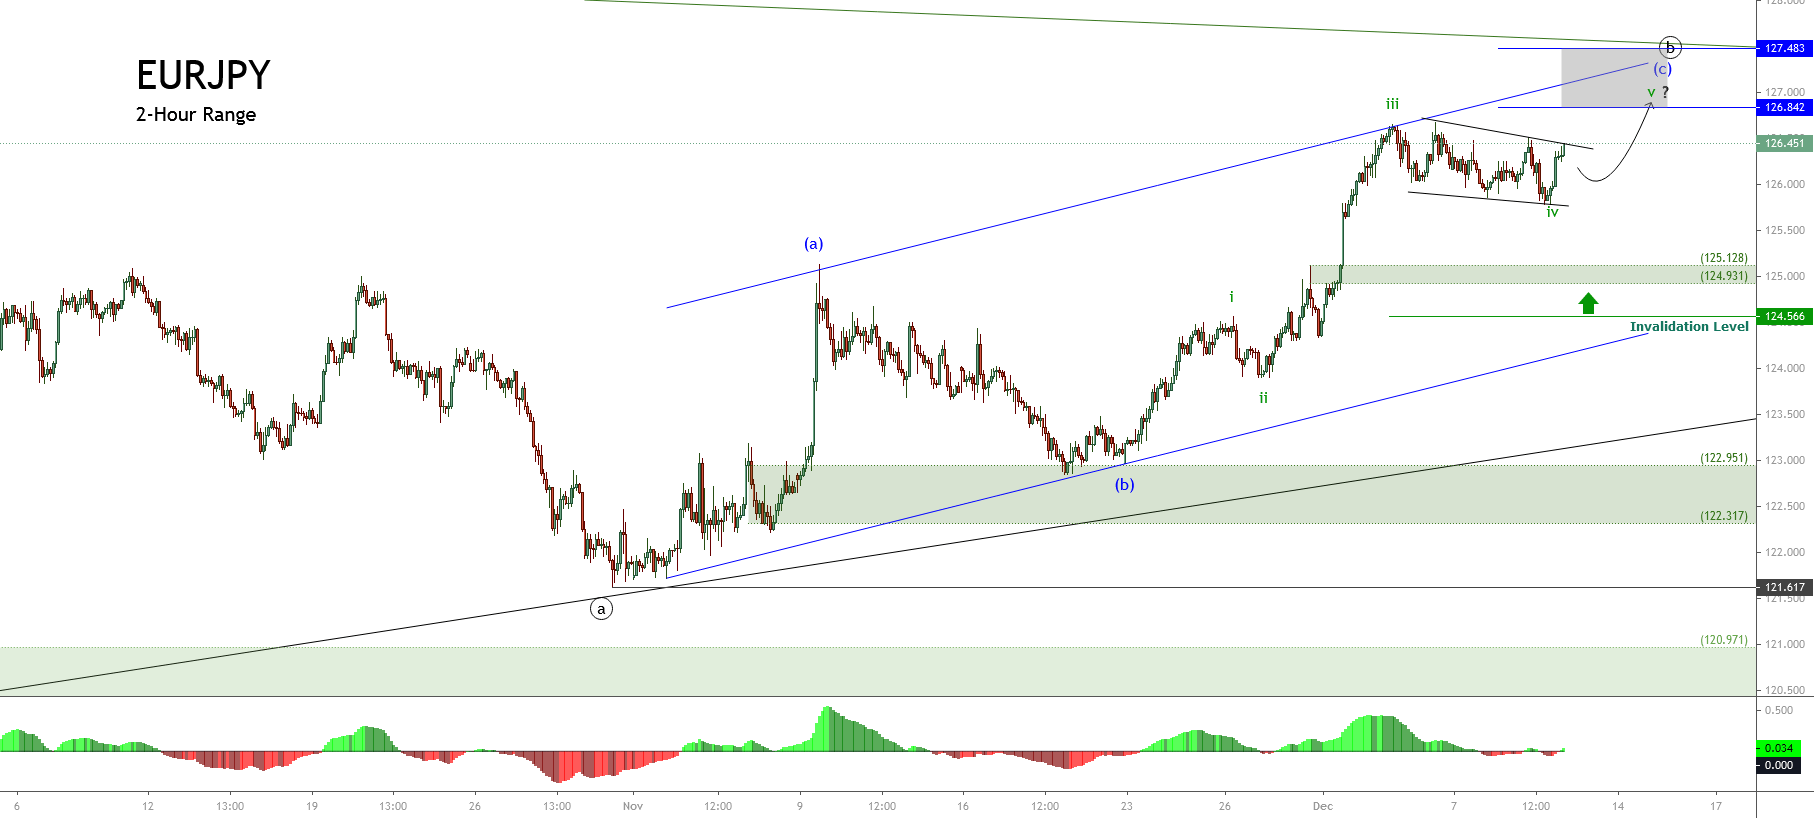
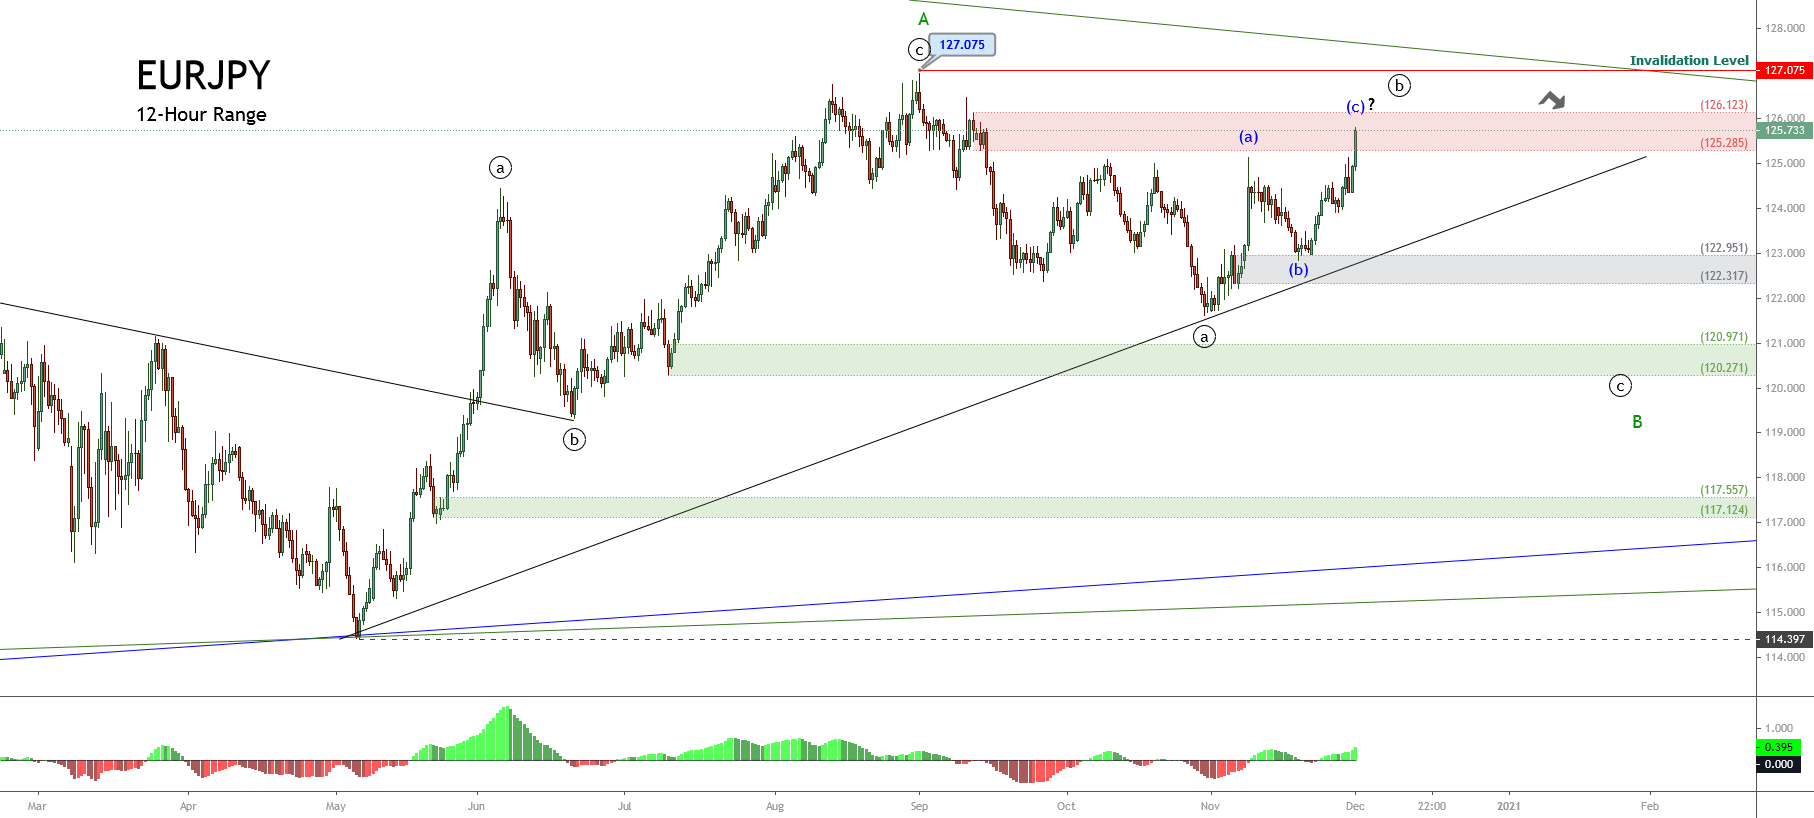
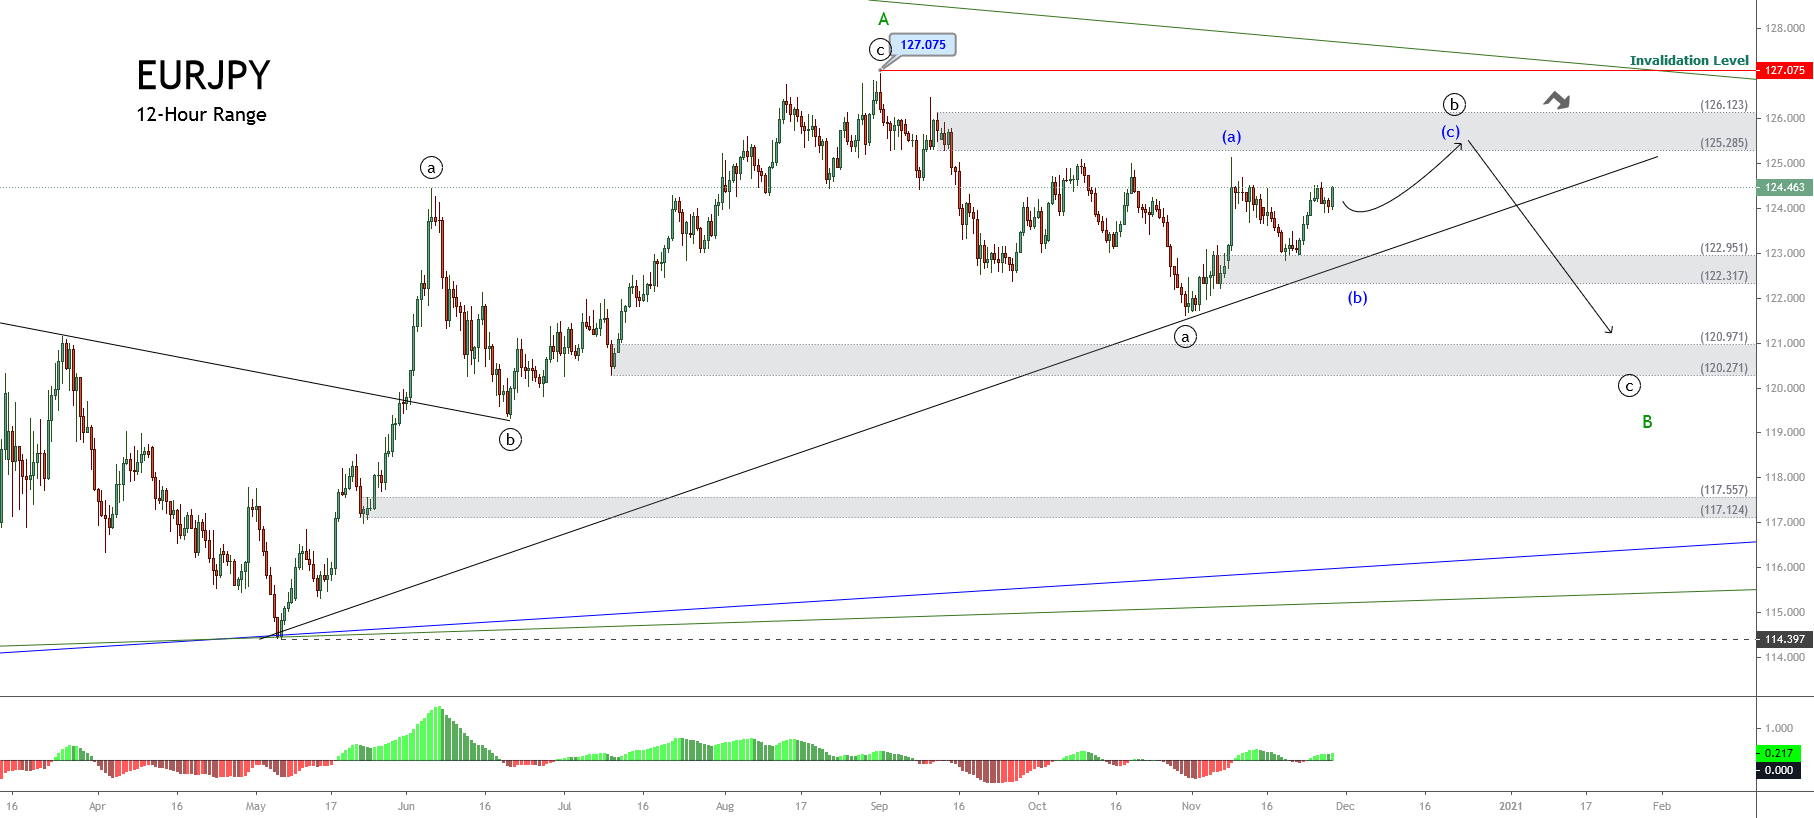
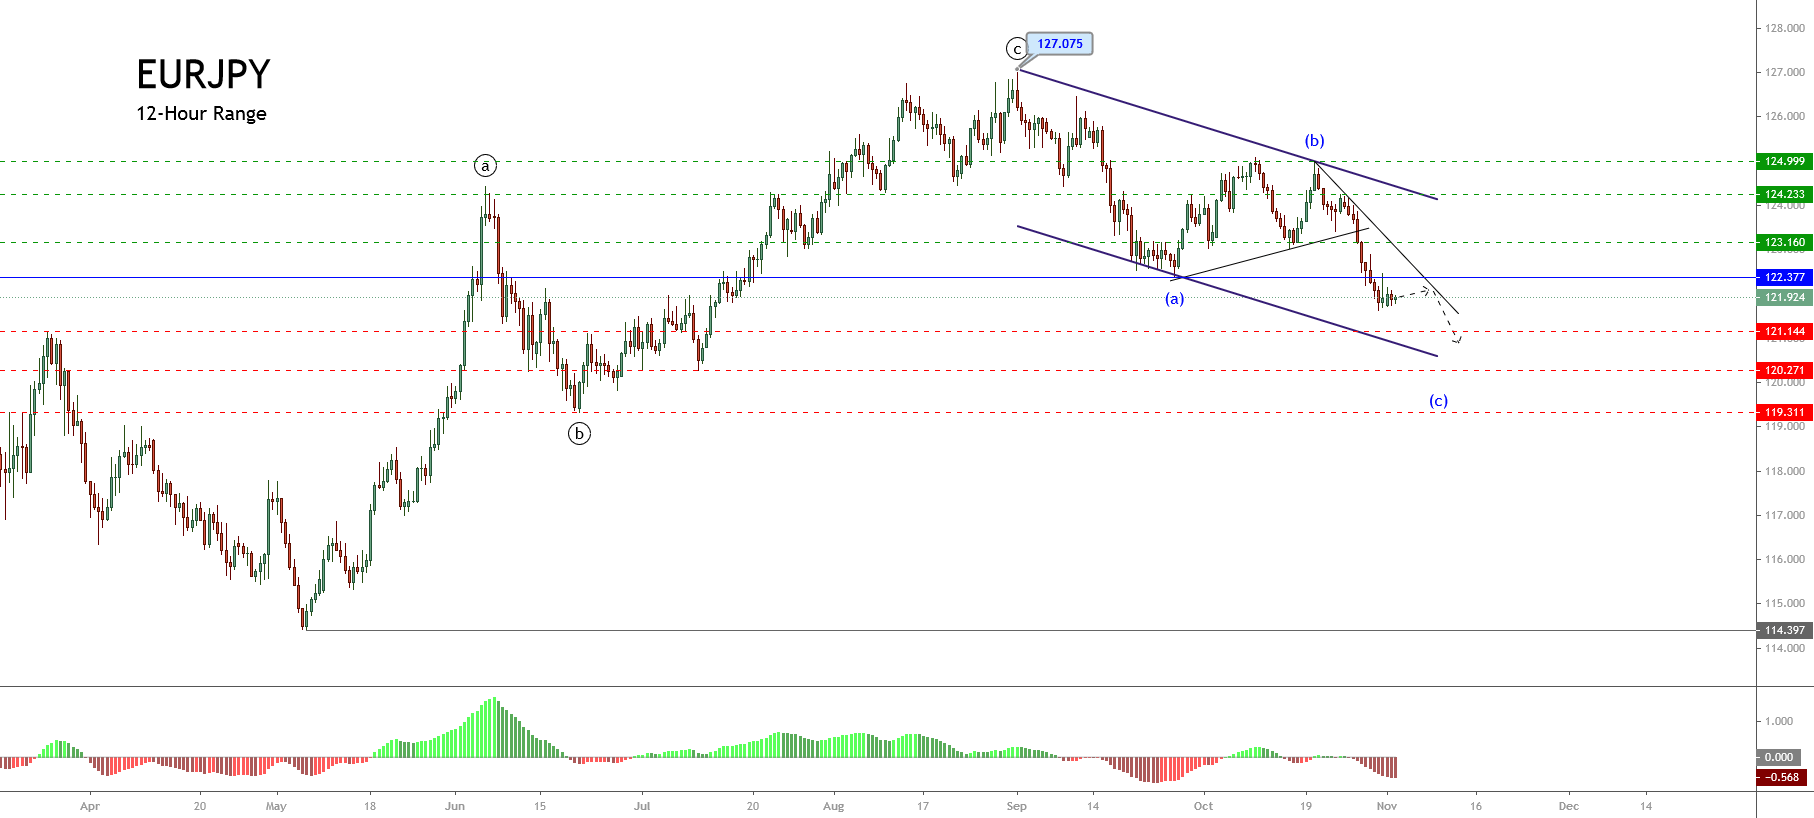
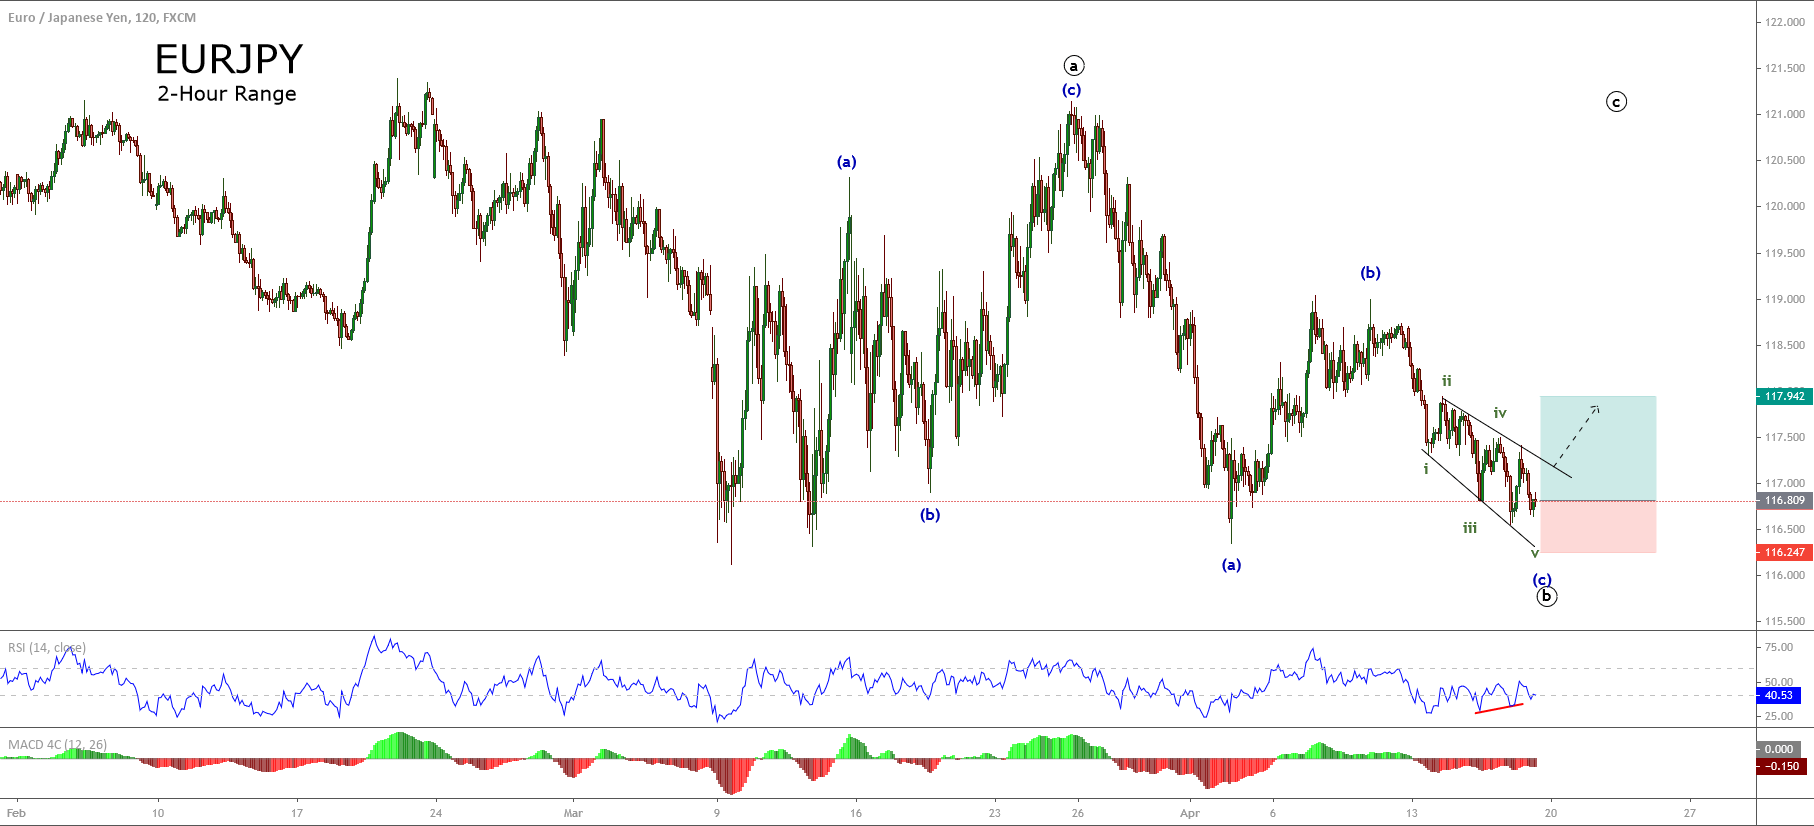
The big picture for the EURJPY cross under the Elliott wave perspective unfolded in the next 12-hour chart shows the incomplete corrective rally corresponding to wave ((b)) of Minute degree labeled in black. This corrective rally remains in progress since the price found fresh buyers at 121.617 on last October 29th and could reach new yearly highs.

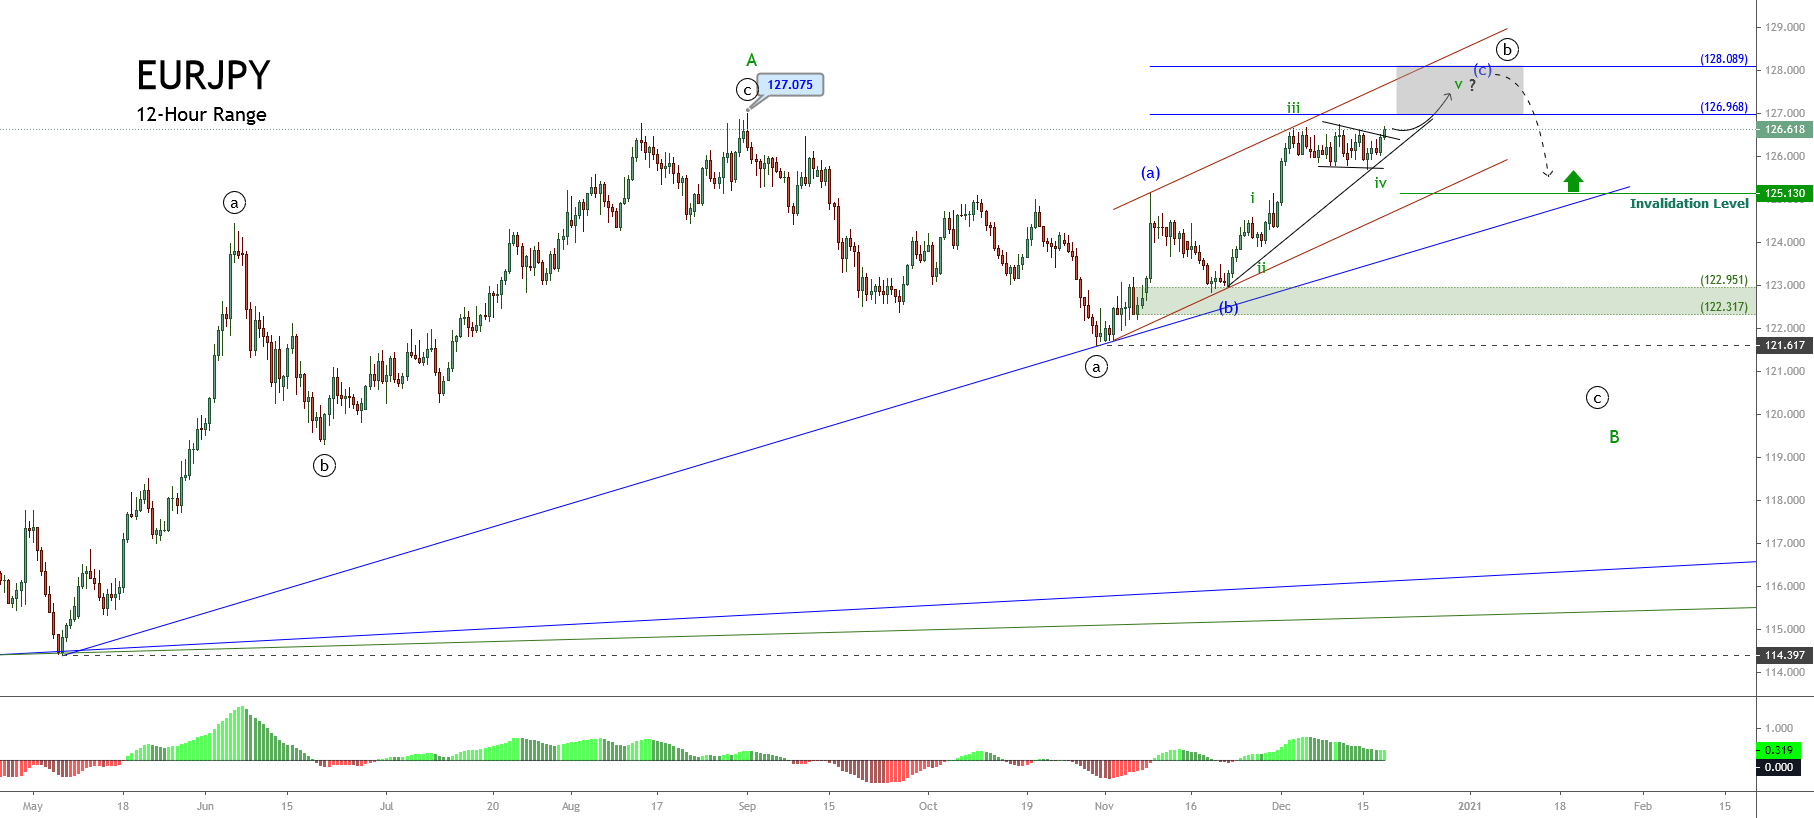
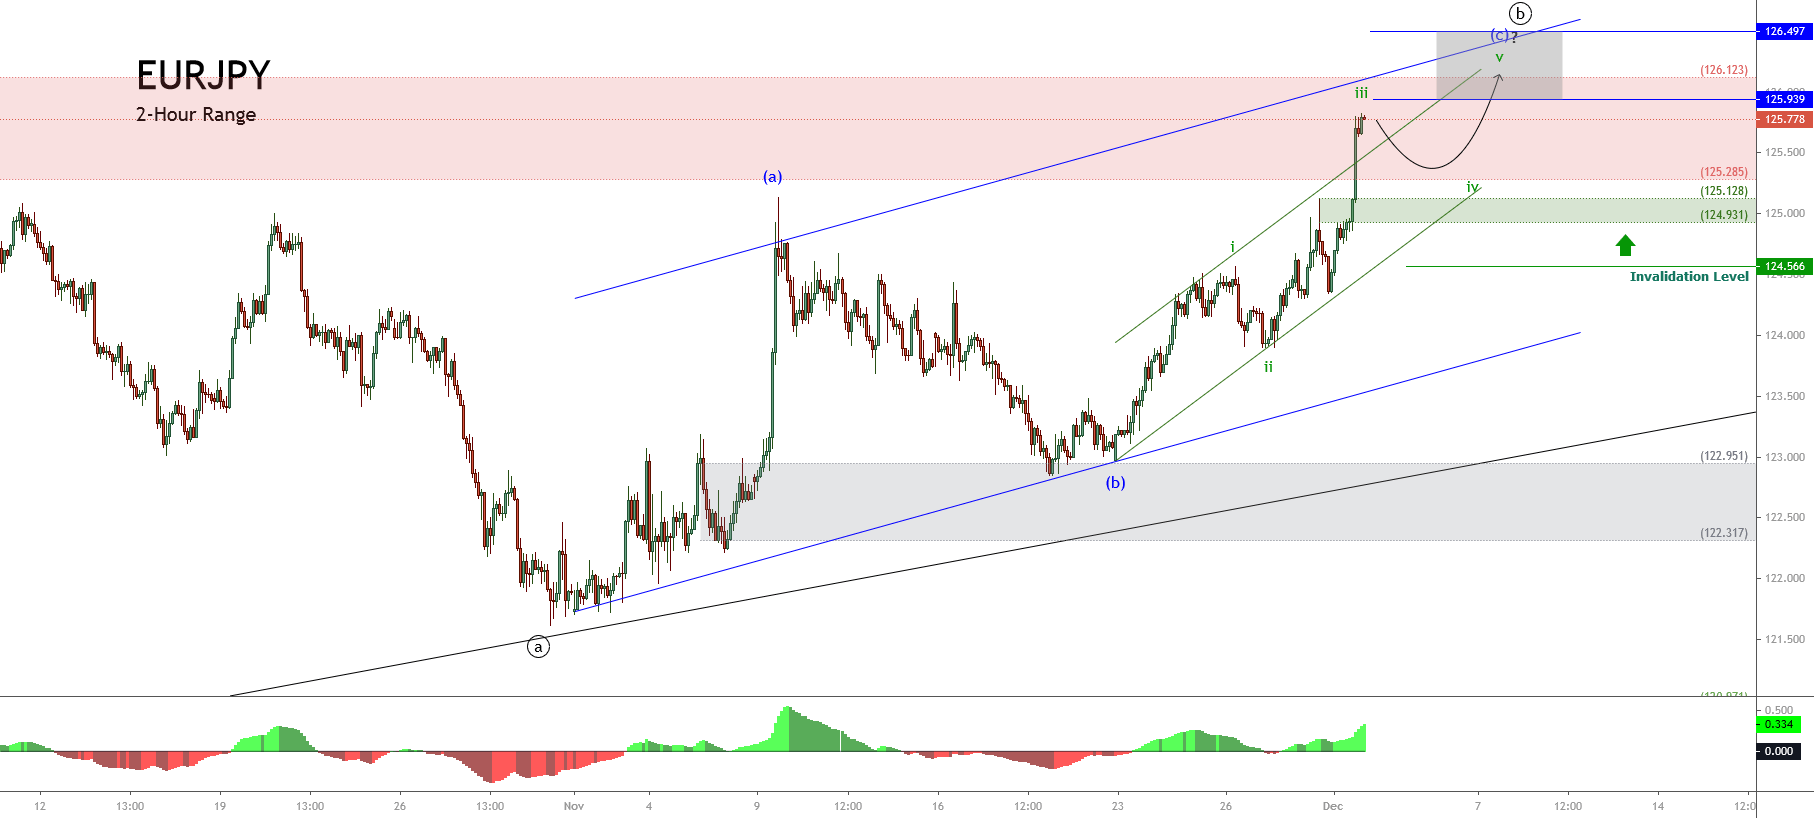
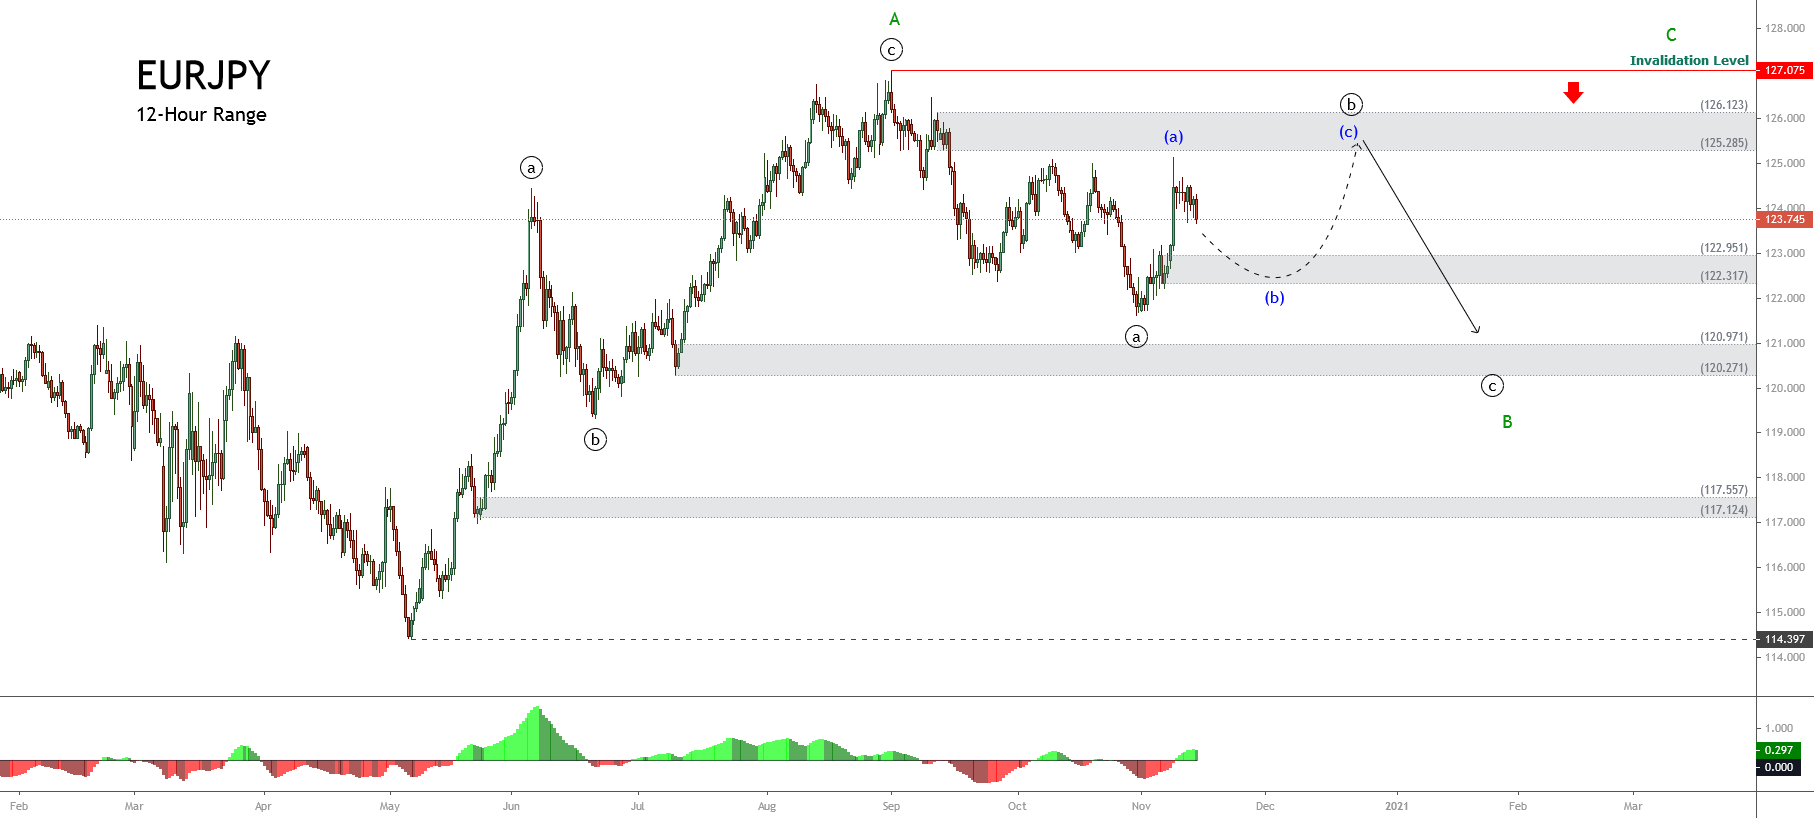
The upper degree structure of the EURJPY cross illustrated in the previous chart exposes the progress in wave B of Minor degree labeled in green, which began when the cross completed its wave A at 127.075 on last September 01st. Currently, the price advances in its wave ((b)) in black. Likewise, its internal structural series shows the development in the wave (c) of Minuette degree labeled in blue, which at the same time, looks starting to develop the wave v of Suminuette degree identified in green.

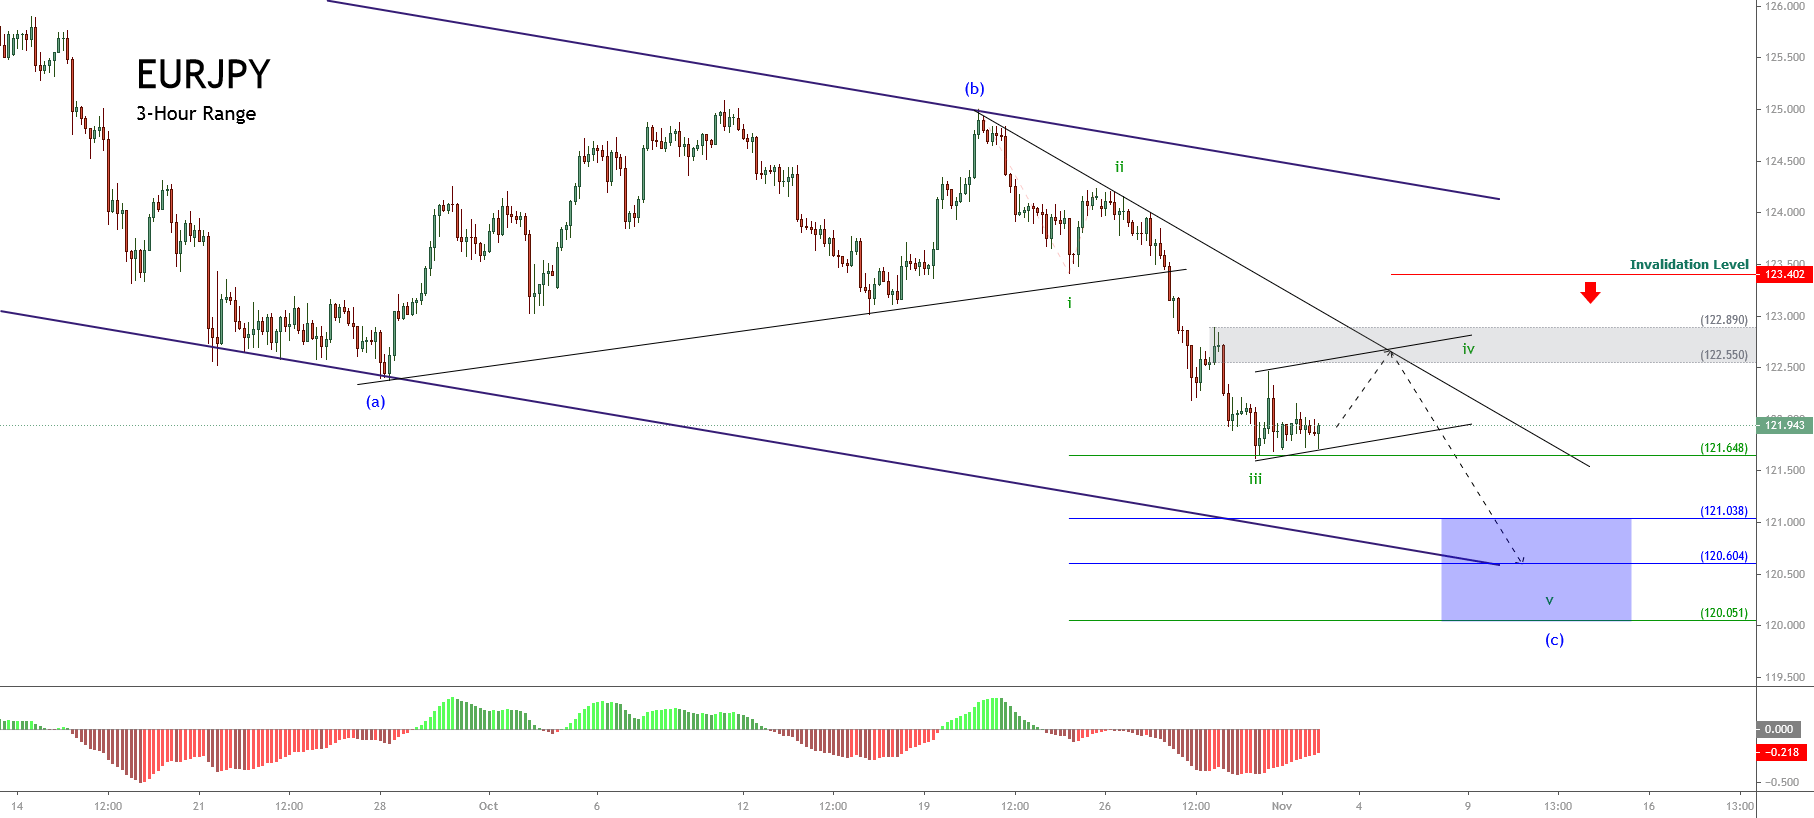
In this context, the EURJPY cross could extend its gains toward the potential target zone bounded between 126.96 until 128.08, where the cross could find fresh sellers expecting to drag the price to new lows developing the wave ((c)) in black. 

In this regard, if the price confirms its new bearish leg, the cross could complete the third segment of wave B in green. On the other hand, considering both the alternation principle and the wave ((a)) and ((b)) looks extended in terms of time, the wave ((c)) could be a sharp decline.

In conclusion, the EURJPY cross moves mostly upward in a corrective rally that belongs to wave ((b)), corresponding to the second segment of the upper degree wave B. If the price breaks the sideways consolidation structure developed since early December, the cross could strike the potential target zone between 126.96 and 128.08. Likewise, the invalidation level of the bullish scenario locates at 125.130.

Categories
Forex Elliott Wave Forex Technical Analysis

EURJPY Consolidates Expecting the ECB Decision Ahead

The EURJPY cross consolidates in the overnight trading session expecting the ECB interest rate decision statement that will take place before the U.S. opening bell. The analysts’ consensus doesn’t expect changes both in the interest rate that remains at 0.0% and in the deposit facility rate that keeps at -0.50%.

Source: TradingEconomics.com

Technical Overview

The following 8-hour chart shows the EURJPY market participants’ sentiment, where the cross looks consolidating in the extreme bullish zone, developing a flag pattern. This chartist pattern suggests the continuation of the previous movement. In this case, the technical formation could be indicative of further upsides for the following trading sessions.

Moreover, the primary trend identified with the upward trend-line in blue remains on the bullish side. Also, the secondary trendline plotted in green reveals the bullish acceleration of the price action. This market context is confirmed by the EMA(60) to Close Index, with a reading above the level 2.000 that suggests the overbought levels and the potential correction or consolidation of the previous rally.

Short-term Technical Outlook

The EURJPY under the intraday Elliott wave perspective unfolded in its 2-hour chart illustrates the advance in an incomplete corrective rally corresponding to wave ((b)) of Minute degree labeled in black. The internal structure shows the cross advancing in its incomplete wave (c) of Minuette degree marked in blue, suggesting a further upside in the following trading sessions.

At the same time, the previous chart reveals the internal five-wave sequence of wave (c) in blue, which exposes the sideways progress of its fourth wave of Subminuette degree identified in green, which belongs to the wave (c) of Minuette degree. 

In this context, considering that the price action could develop a new upward movement, the cross could advance in its fifth wave in green to the potential target zone between 126.84 and 127.48, where the EURJPY cross could complete the wave (c) in blue, and the wave ((b)) in black. Likewise, once this corrective rally completes, the price could start to develop a downward movement identified as wave ((c)) in black.

In this regard, according to the Elliott Wave theory and considering that the mid-term structure corresponds to an incomplete corrective formation constituted by a three-wave sequence, after the completion of the wave ((b)) in black, the price should start to decline in its wave ((c)) with an internal structure subdivided into a five-wave sequence.

Summarizing, the EURJPY cross currently develops a consolidation pattern, which leads to expect a new upward movement with a potential target between 126.84 and 127.48. Once the price completed its target, the cross may start to decline in a five-wave sequence corresponding to wave ((c)) of Minute degree.

Finally, the invalidation level of the current bullish scenario can be found at 124.566.

Categories
Forex Elliott Wave Forex Market Analysis

EURJPY Advances Toward Key Supply Zone

In our latest EURJPY analysis, we commented on its advance in an incomplete corrective structure identified as a triangle pattern, which remains in development since mid-2014.

Technical Overview

Also, we saw that the mid-term trend looks like an incomplete corrective structure, which seems to advance in a wave B of Minor degree, labeled in green. Moreover, the structure observed previously unveiled the progress in an incomplete wave ((b)), identified in black, which should develop a bounce toward the supply zone between 125.285 and 126.123.

The price action is currently seen advancing in its wave (c) of Minuette degree, labeled in blue, which has now reached the supply zone between 125.285 and 126.123 forecasted in our previous analysis.

On the other hand, the current wave (c), in blue, that remains in development could extend its gains toward the psychological barrier of 126, where the cross could start to decline to the wave ((c)), in black. This bearish sequence, possibly developed with five internal segments, should complete the wave B of Minor degree, in green.

Short- term Technical Outlook

The EURJPY in its 2-hour chart reveals the internal structure created by the wave (c), in blue, which shows the intraday ascending channel plotted in green. The price action that has surpassed the ascending channel’s upper line suggests the rise of the third wave of Subminuette degree labeled in green that is in progress.

In this context, according to the Elliott Wave theory, once the EURJPY completes the advance of the third wave, in green, the cross should experience a limited decline corresponding to the fourth wave in green. This drop could reach the demand zone between 124.931 and 125.128, where the price could find fresh buyers expecting the price to head toward new highs.

The fifth wave’s potential target zone, in green, is located between 125.939 and 126.497. In this area, the cross could complete the wave ((b)) of Minute degree in black. 

Finally, the invalidation level of this intraday bullish scenario is found at 124.566, which corresponds to the top of the first wave of Minute degree.

Categories
Forex Elliott Wave Forex Market Analysis

EURJPY Advances from Demand Zone Forecasted

In mid-November, we commented about the technical market context of the EURJPY cross, as its big picture displayed in its weekly chart revealed a technical formation identified as a triangle pattern, which continues progressing since mid-2014.

Moreover, our previous mid-term Elliott wave analysis in its 12-hour chart revealed the advance of an incomplete corrective structure of Minor degree, which currently advances in wave B in green.

In this regard, our main outlook anticipated the progress in its wave ((b)) of Minute degree identified in black. The internal structure also suggested a limited decline toward the demand zone between 122.951 and 122.317. Once reached, the price could have completed the internal wave (b) of Minuette degree labeled in blue. 

Once the cross completed its wave (b), in blue, the cross should begin its wave (c), in blue, with a potential target in the supply zone between 125.285 and 126.123.

Technical Outlook

Currently, the EURJPY cross in its 12-hour chart reveals the bounce from the previous demand zone forecasted, where the price began to advance in its wave (c) in blue.

In the previous chart, we distinguish wave (c)‘s upward progress, which should evolve in a five-wave sequence according to the Elliott Wave theory. The figure also shows the potential target zone between 125.285 and the psychological barrier of 126.

This price landscape brings us three potential scenarios for the current upward movement:

  • First scenario: The EURJPY cross reaches the supply zone between 125.285 and 126.123, completing its wave ((b)) in black, and the price starts to decline in an internal five-wave sequence corresponding to wave ((c)).
  • Second scenario: The cross’ short-term rally fails to surpass the end of wave (a), in blue, and begins to decline. This scenario should be indicative of strong bearish pressure.
  • Third scenario: EURJY price action surpasses the invalidation level located on 127.075. In this case, the cross could be creating a bullish breakout of the long-term triangle, suggesting the continuation of the long-term bullish trend.

Nevertheless, before placing any position on the bearish side or continue on the bullish side, the price action must confirm the end of wave ((b)) in black.

Categories
Forex Elliott Wave Forex Market Analysis

Is the EURJPY Ready to Develop a New Decline?

The EURJPY cross advances in a long-term consolidation structure, which began in early December 2016. The short-term Elliott wave view predicts a limited decline in the following trading sessions.

Market Sentiment

The EURJPY cross closed the last trading week, cutting Monday’s session gains when the cross jumped from 122.835 until 125.136, mainly supported by the stock market’s post-election rally.

The following figure shows the EURJPY in its daily timeframe, revealing the mid-term big-market participants’ sentiment exposed by the 90-day high and low range. In this context, the cross is entering into the bearish sentiment zone. However, the 60-day weighted moving average still doesn’t confirm the short-term bearish bias.

After a rally that carried the cross to advance over 11% since May 07th (when the EURJPY bottomed on 114.397 and then soared, reaching the highest level of the year at 127.075 on September 01st), the cross began to retrace, turning its mid-term market sentiment from extremely bullish to bearish.

Nevertheless, the price action still doesn’t confirm the bearish sentiment. In this regard, the short-term sentiment remains neutral until the price confirms the bias.

Technical Overview

The big picture of EURJPY illustrated in the following daily chart exposes a long-tailed yearly candlestick mostly bullish. However, the upper shadow hints at a bearish pressure near the psychological barrier of 127. Moreover, the next resistance is placed at 127.502, which corresponds to the high of 2019.

The EUJPY long-term trend under the Dow Theory perspective and exposed in the next log scale weekly chart reveals the primary trend identified in blue that remains slightly bullish.

At the same time, the secondary trend exposes the sideways movement developing as a pennant pattern, which began in early December 2016 when the price found resistance at 149.787 and could break soon.

According to the classic chartist theory, the pennant pattern is a technical figure that calls for the continuation of the previous movement. In this case, the pennant could resume the rally developed since late July 2012 at 94.114 ended at 149.787 in early December 2014.

Short-term Technical Outlook

The short-term Elliott wave view for EURJPY shows in its 12-hour chart advancing in an incomplete corrective sequence that began on May 06th at 114.397, where it completed its wave A of Minor degree labeled in green.

Once the price found fresh sellers at the highest level of the year, the cross started to advance in its wave B, still in progress. In this context, the previous chart unveils the intraday upward sequence corresponding to the incomplete wave ((b)) of Minute degree identified in black.

The price action could boost the cross until the next supply zone, located between 125.285 and 126.123, where the EURJPY could start to decline in an internal five-wave sequence corresponding to wave ((c)), in black, that may drop to 120.271, though, the price could extend its drops until 117.124.

The short-term bearish scenario’s invalidation level locates above the end of wave A in green at 127.075.

Categories
Forex Elliott Wave Forex Market Analysis

EURJPY: Can we Profit Short-Term?

Overview

The EURJPY cross advances in a corrective sequence that began on September 01st; this corrective movement looks incomplete. The short-term Elliott wave outlook foresees a limited recovery prior to its a coming decline corresponding to its fifth wave.

Technical Big Picture

The EURJPY cross, in its 12-hour chart, illustrates an incomplete downward sequence that began on September 01st when the price found fresh sellers at level 127.075. 

The previous figure exposes an upwards structural series subdivided into three-wave identified in Minute degree and labeled in black, which began on the May 06th low located at 114.397 and ended on the September 01st high when the price topped 127.075. 

Once the price found fresh sellers at 127.075, the cross started to retrace, developing a three-wave sequence identified in the Minuette degree labeled in blue. Until now, wave (c) doesn’t show bullish reversal signals, which lead us to expect further declines.

The short-term key supports and resistance levels are as follows:

  • Resistance 1: 123.160
  • Resistance 2: 124.233
  • Resistance 3: 124.999
  • Pivot Level: 122.377
  • Support 1: 121.144
  • Support 2: 120.271
  • Support 3: 119.311

Technical Outlook

The short-term outlook for EURJPY illustrated in its 3-hour chart reveals the intraday consolidation, which coincides with the progress of its fourth wave of Subminuette degree labeled in green.

In this regard, the market participants could mostly drive the price toward the supply zone between 122.550 and 122.890, from where the EURJPY cross could start developing the next decline corresponding to its fifth wave identified in green.

The potential target zone of the next decline locates between 121.038 and 120.051, which coincides with the base-line of the descending channel that extends from the September 01st high to date. 

Finally, the invalidation level of the downward scenario locates at 123.402.

Categories
Forex Signals

EUR/JPY Breaks Below Descending Triangle – Brace for Selling! 

The EUR/JPY failed to extend its early-day bearish moves and rose well above 119.820 support levels, mainly due to bullish correction. It seems like a sharp rise in the coronavirus cases in Europe and on-going tensions between the EU-US undermined the shared currency and kept a lid on any additional gains in the pair, at least for now. Currently, the EUR/JPY trading at 120, holding right below an immediate resistance level of 120.193. However, the hopes of the European Union (E.U.) Recovery Fund deal kept the positive tone around EUR/JPY pair high.

The mounting concerns about the second wave of coronavirus outbreak sent investors into the safe-haven assets. The warning of the World Health Organization that indicated the second wave of the virus was picking up the pace once again, with an average of 20,000 new cases per day and 700 daily deaths in the Old Continent. In the meantime, the U.K. reported 149 further coronavirus-related deaths in the past 24 hours, as U.K. health experts warned about an imminent second wave of the virus due to the government early- lifting of lockdown measures.

Moving on, the directionless sentiment surrounding the currency pair could be long-term as the US-EU trade war continues to increase and could see the E.U. and Washington move forward with more tariffs through the rest of the year. Besides this, the shared currency Euro gained further support upon the reports from the President of the European Commission that the European Union (E.U.) Recovery Fund that the deal should be agreed before the summer holidays. 

Looking forward, the market participants will keep their eyes on the broader market sentiment on Friday. The European Central Bank President Lagarde will be under the close eye during her speech at 07:00 GMT, as she will likely reiterate willingness to provide additional stimulus and stress the requirement for more work on the fiscal front.


Despite positive fundamentals, the reason for opening a sell trade was to capture a quick sell in the EUR/JPY. As you can see on the hourly timeframe, the EUR/JPY has closed shooting star right below downward trendline and 50 periods EMA which suggests bearish sentiment amount investors. Thus, we entered a sell position below 119.934 to target 119.534 today. 

Entry Price – Sell 119.934  

Stop Loss – 120.334    

Take Profit – 119.534

Risk to Reward – 1

Profit & Loss Per Standard Lot = -$374/ +$374

Profit & Loss Per Micro Lot = -$37.4/ +$37.4

Categories
Forex Signals

EUR/JPY Downward Channel Drives Green Pips – Qucik Update on Signal!

The EUR/JPY extended its previous session losing streak and dropped below 119.785 level, mainly due to increased safe-haven demand of Japanese yen. The reason for the EUR/JPY pair declines could also be attributed to the risk-off market sentiment underpinning the safe-haven Japanese yen and contributing to the currency pair gains. 

At this particular time, the EUR/JPY pair is trading at 119.795 and consolidating in the range between 120 – 119.700. However, the risk-off market sentiment was bolstered by the concerns over the second wave of coronavirus infections and geopolitical tensions, which exerted some downside pressure on the risk sentiment, which benefitted the Japanese yen’s perceived safe-haven status.

Besides, there are still no results from any vaccine trials that could stop the deadly disease from spreading as Texas showed a record high jump in the hospitalization likewise, Florida, Arizona, and Oklahoma also showed further cases. Apart from this, Japan’s virus figures rose to the highest since May 30. Whereas, the tension between the US-China was further bolstered by the fresh report that the Group of Seven (G7) leaders, including the U.K., urged China to reconsider their security law to Hong Kong.

Today’s talk between US-China, the top diplomat Jiechi showed aggressive reactions to U.S. Secretary State Mike Pompeo for the U.S. interference in Hong Kong issues, which initially exerted some downside pressure on the risk-tone and contributed to the losses of EUR/JPY. 

The EUR/JPY pair edged lower near one-month lows set last week, albeit lacked any strong follow-through selling and staged a modest intraday bounce of around 20-25 pips from the 119.70 regions.


Daily Support and Resistance    

S1 106.32

S2 106.81

S3 107.12

Pivot Point 107.31

R1 107.61

R2 107.8

R3 108.29

Technically, the EUR/JPY is trading with a bearish bias, having violated the next support level of 120.500 level, which is now working as a resistance. Downward trendline also supports selling bias, and this opens further room for selling until 119.180 level. The RSI and MACD levels are staying in a selling zone, which may further lower the EUR/JPY prices. Thus, we opened a quick sell trade below 120 level during the early U.S. session, which hit the take profit, closing us a nice amount of pips today. Good luck! 

Categories
Forex Signals

Three White Soldiers and 50 EMA – Should We go Long on EUR/JPY? 

The Japanese cross EUR/JPY is on a bullish run, having crossed over 50 periods EMA at 115.551. As for the Japanese economic data is concerned, the Monetary Base for the year from Japan showed a decline to 2.3% against the expectations of 4.5% and weighed on JPY, which resulted in the upward movement of the EUR/JPY pair.

On the other hand, the uptick move from the major US equity indexes also made it difficult for JPY to gather any strength. On the last day of the week, the traders keeping their eyes on Non-Farm Payrolls from the United States to further take hints about the US economy. Better than expected labor market is weakening the demand for safe-haven assets such as JPY itself. 


Technically, the EUR/JPY pair has closed three white soldiers pattern on the two-hourly timeframes at 115.650. Besides, the crossover above 50 EMA is also supporting the bullish bias among traders and typically drives an upward trend in the market. Lastly, the MACD is also forming strong histograms over 0, supporting bullish bias. Closing of the candle above 115.550 can drive more buying in the EUR/JPY pair. Thus, we have taken a buying trade. Let’s see how it goes. 

  • Entry Price: Buy at 115.727    
  • Take Profit .116.427    
  • Stop Loss 115.027    
  • Risk/Reward 1

Profit & Loss Per Standard Lot = -$658/ +$658

Profit & Loss Per Micro Lot = -$65.8/ +$65.8

Categories
Forex Signals

EUR/JPY Triple Top Pattern Hold’s – Quick Update on Trading Signal! 

The EUR/JPY is trading bearish at 116.850, falling below the triple top resistance level of 117.500. The broad-based selling pressure of the Euro made it difficult for the EUR/JPY pair to come out of the negative territory. The 10 Year US Treasury bond yield added in the downfall of USD/JPY when it fell more than 2% on Friday.

On the other hand, the strategy to blame China for the outbreak of COVID-19 started weeks ago, and on Thursday, when Trump officially accused China of this and said that he would punish China for mishandling the outbreak by imposing tariffs, many other countries showed their support to him as well.


Technically, the EUR/JPY is holding above 116.580, having closed a Doji candle above 50 EMA support level of 116.600. Below this, selling bias remains strong, and it can lead the EUR/JPY pair until 115.450. On the 4 hour timeframe, EUR/JPY seems to violate the descending triangle support level of 116.600, and this can lead the pair towards an initial target level of 115.450. The MACD is holding above 0, suggesting bullish bias among traders. While the 50 periods, EMA continues to support the selling trend in the pair. 

Entry Price: Sell at 116.962    

Take Profit 116.462    

Stop Loss 117.462    

Risk/Reward 1.00

Profit & Loss Per Standard Lot = -$467.5‬‬/ +$467.5‬

Profit & Loss Per Micro Lot = -$‭‭46.7/+$46.7

Categories
Forex Signals

EURJPY Advances in an Ending Diagonal Pattern

Description

EURJPY, in its 2-hour chart, shows the completion of second bearish move corresponding to a wave ((b)) of Minute degree identified in black.

The short-term Elliott wave structure calls for the completion of a wave (c) labeled in blue, which corresponds to an Ending Diagonal pattern. At the same time, its internal sequence shows that the EURJPY cross moves in its fifth inner segment.

On the other hand, the expected weakness in the Japanese currency could be accompanied by the current risk-on sentiment in the stock market.

The next path after the bearish sequence completion, the cross should begin an upward sequence corresponding to wave ((c)) in black, which in our conservative scenario could reach the end of the second wave of Subminuette degree in green at level 117.942. 

The level that invalidates our bullish scenario locates at 116.247.

Chart

Trading Plan Summary

Categories
Forex Signals

EUR/JPY Violates Descending Triangle Pattern – An Update on Signal! 

The EUR/JPY is trading with a bearish bias around 117.150, holding below strong support to become a resistance level of 117.350, which is extended by the descending triangle pattern.  

The COVID 19 updates are consistently impacting the exchange rate of the EUR/JPY pair. French Prime Minister Edouard Philippe said on Wednesday, healthcare staff in France’s most stricken regions by the new coronavirus would receive a bonus of 1,500 euros ($1,637). 

Alongside this, they will receive higher interest than normal for their extra hours, which is positive news for the Euro, but at the same time, it’s increasing cautions of traders about the future of the Eurozone. Eventually, this drives selling bais in the pair, as investors move their investments in the safe-haven currencies such as Japanese yen


Technically, the EUR/JPY is following a narrow range, which can extend selling bias until 116.450. On the 4 hour timeframe, EUR/JPY has violated the EUR/JPY support level of 117.350, and this can lead the pair towards an initial target level of 116.765 and 116.380. The MACD is holding below 0, suggesting bearish bias among traders. While the 50 periods, EMA continues to support the selling trend in the pair. 

Entry Price: Sell at 117.179    

Take Profit 116.479    

Stop Loss 117.779    

Risk/Reward 1.17

Profit & Loss Per Standard Lot = -$‭560.4/ +$653.8‬

Profit & Loss Per Micro Lot = -$‭56/ +$65.38

Categories
Forex Signals

Bear Continues its Domination

Chart EUR/JPY H1 Chart

EUR/JPY made a strong bearish move on the H1 chart yesterday. The chart shows that it made a breakout at yesterday’s lowest low today. As of writing, the last candle closed well above the breakout candle. A short entry is triggered at 116.370. The price may head towards the South and find its next support at around the level of 115.255 area.

Let us have a look at the trade summary

Entry: Sell at 116.370

Stop Loss: Above 117.640

Take Profit: 115.255

Categories
Forex Assets

Understanding The EUR/JPY Asset Class

Introduction

The Euro area’s euro against the Japanese yen, in short, is termed as EURJPY. This pair, too, like the EURCHF, EURNZD, EURCAD, EURGBP, etc. is a minor or cross currency pair. It is one of the most traded currency pairs in the forex market. Here, the EUR is the base currency, and JPY is the quote currency. The value of this pair is quoted in terms of the quote currency.

Understanding EUR/JPY

This currency pair is precisely quoted as 1 EUR per X JPY. In simple terms, the value determines the units of the quote currency (JPY) required to buy one unit of the base currency (EUR). For example, if the market value of EURJPY is 121.00, it basically means that these many yen are required to purchase one euro.

EUR/JPY Specification

Spread

Spread is the difference between the bid price and the ask price set by the broker. This value is not constant and varies from broker to broker. It also varies on the type of account model.

Spread on ECN model: 0.6

Spread on STP model: 1.5

Fees

Spread is not the only way through which brokers generate their revenue. They charge some fee (commission) on each trade as well. Fees again vary from broker to broker and account model. Typically, there is no fee on an STP account. However, there are a few pips or fees on an ECN account as their spread is lesser than an STP account.

Slippage

Slippage is the difference between the trader’s asked price and the actual price given to him. Two factors majorly affect slippage on a trade; one, the volatility of the market, and two, broker’s execution speed. The slippage is usually within 0.5 to 5 pips. For major currencies, the slippage is much lower.

Trading Range in EUR/JPY

The trading range is the illustration of the minimum, average, and the maximum number of the pips the currency pair has moved in a given time frame. These values help assess the profit/loss potential of a trade. For instance, if the max volatility on the 1H is 10 pips, then one can expect to win or lose a maximum of $92 (10 pip x 9.20 value per pip) in an hour or two.

Procedure to assess Pip Ranges

  1. Add the ATR indicator to your chart
  2. Set the period to 1
  3. Add a 200-period SMA to this indicator
  4. Shrink the chart so you can determine an extensive period
  5. Select your desired timeframe
  6. Measure the floor level and set this value as the min
  7. Measure the level of the 200-period SMA and set this as the average
  8. Measure the peak levels and set this as Max.

EUR/JPY Cost as a Percent of the Trading Range

In addition to assessing the profit/loss in a timeframe ahead of time, we can use these values in determining the cost variation in different timeframes and volatility as well. The cost as a percent of the trading range tells the min, average, max costs by considering the timeframes and volatility as its variables.

ECN Model Account 

Spread = 0.6 | Slippage = 2 | Trading fee = 1

Total cost = Slippage + Spread + Trading Fee = 2 + 0.6 + 1 = 3.6

STP Model Account

Spread = 1.5 | Slippage = 2 | Trading fee = 0

Total cost = Slippage + Spread + Trading Fee = 2 + 1.5 + 0 = 3.5

The Ideal way to trade the EUR/JPY

Above are the costs of each trade in terms of percentages. Note that they do not represent the actual cost on trade in terms of dollars, but are magnitude values which can be used for comparing with other values. The higher the magnitude of the percentage, the higher is the cost on the trade for that particular timeframe and volatility. From the tables, it can be ascertained that the values are highest on the min column and lowest on the max column. This, in turn, implies that the costs are higher when the volatility is low and vice versa. Talking about the timeframe, the costs are high on the lower timeframes and low on the higher timeframes. So, a day trader may preferably trade on the 2H/4H when the volatility is around the average values. And long-term traders may trade the 1W/1M whatsoever be the volatility of the market.

Furthermore, a trader may reduce their costs by entering and exiting trades using limit order instead of market orders. This will completely erase the slippage on the trade. An example of the same is given below.

Total cost = Spread + trading fee = 0.6 +1 = 1.6

Categories
Forex Market Analysis

European Union and Japan Sign a Trade Deal – Forex and Indices – Daily Update – 17.07.18


Fundamental Overview


European Union and Japan sign a trade deal

Financial Market Updates: Japan and the European Union signed a trade deal amid uncertainty generated by the protectionist policy led by the Trump Administration. The trade deal creates the largest open economic area. The agreement promises to eliminate 99 per cent of tariffs.


Technical Analysis


EURUSD

Today the EURUSD pair failed the bullish continuation, remaining in the consolidation range, it suggests that the pair should continue with the previous bearish cycle. In consequence, we update our bias from a bullish to a bearish move. The potential sell zone (PSZ) is between 1.1760 and 1.1807 with a bearish target placed at 1.1293. Invalidation level is 1.1852.


GBPUSD

As noticed in previous Daily Updates, the GBPUSD pair in a 2-hour chart is moving sideways, the short-term pivot level at 1.3275 has failed, in consequence, GBPUSD should make a new lower low. The Pound could fall to the area between 1.3024 and 1.2885, completing a major degree bearish cycle. Invalidation level is at 1.3472.


USDCHF

The complex corrective structure that is developing the USDCHF pair in the 2-hour chart shows a signal more for a bullish continuation than a downward reversal move. In the last session, the Swiss currency tested and bounced from the potential buy zone. We foresee USDCHF making a new higher high with the target placed in the area between 1.0112 and 1.0141. Invalidation level is at 0.9857.


EURJPY

The EURJPY cross in the 2-hour chart is moving bullish in an ascending wedge; the price tested the exhaustion zone between 132.01 and 133.05, from where we expect a bearish reversal move as a bull trap. We foresee drops to the area between 129.87 to 129.28. Consider that if the price makes a bull trap after this, it is highly likely that the price will make a bullish failure pattern.


GBPJPY

The GBPJPY cross in the 2-hour chart is making a consolidation pattern after a bullish impulsive move, which could make fresh highs to the area between 150 and 150.70. Our vision for the cross is that the price could make a limited low to the 146.2 level before it continues its previous bullish trend. Invalidation level is 143.799.


FTSE 100

As commented in previous Daily Update, FTSE 100 in the 2-hour chart continues consolidating between 7,720 pts and 7,550 pts. We maintain our bias as neutral in FTSE 100 index.


DAX 30

DAX 30 in the 2-hour chart soared above the 12,600 pts and is near to reaching the exhaustion zone at 12,695 pts. The next control level is 12,807 pts which could drive to 13,020 pts, completing an internal bullish cycle. Invalidation level of the bullish cycle is 12,104 pts.


Categories
Forex Market Analysis

Forex and Indices Daily Update 25.06.18


Fundamental Overview


Understanding the Conference Board (CB) Consumer Confidence Index (CCI).

Tomorrow, the U.S. CB Consumer Confidence Index will be released. This reflects the business conditions and likely developments for the months ahead. The report is issued monthly and is a barometer of the health of the U.S. economy from the perspective of the consumer.

The current CCI level reported in May is 128 pts, and the analysts’ consensus for June is a decrease to 127.6 points. The decreasing could be attributed to the protectionist policy which the Trump Administration is boosting. Despite this decline, consumer confidence keeps having record highs. The highest level reached in the year is 130 pts, the record high since December 2000.

CCI level -forex daily chart trading strategy

Forex Daily Chart Trading Strategy


Technical Analysis


FOREX DAILY CHART TRADING STRATEGY

EURUSD

Since June 22nd, the EURUSD has made an impulsive move reaching the short-term target area between 1.17043 and 1.17617. Our vision is that the common currency could strike the 1.1853 level before it starts a brief retracement to the area between 1.1679 and 1.15892, from there, the price should make a new rally with a target placed at 1.19467. Invalidation level is at 1.1508.


GBPUSD

GBPUSD bounced on June 21st aided by the Bank of England monetary policy decision. Now the price is consolidating the previous impulsive move. We should see a limited fall in three waves to the area between 1.3237 and 1.3165, from where we foresee fresh highs with the target at 1.3443. Invalidation level is at 1.31020.


USDCHF

The USDCHF pair is testing the long-term ascending trendline. Our forecast for USDCHF is that it could make a flag pattern reaching the 0.99277 level before we see the continuation of the previous move with a target placed on the area between 0.97225 and 0.96495. Invalidation level of this scenario is at 0.99909.


EURJPY

The EURJPY cross is moving in a corrective structure as an A-B-C Pattern, which could make a new lower low. RSI Oscillator is running supported by an ascending trendline refecting the corrective structure of the principal trend. We foresee a new bearish move to 124.94 and 126.62; this area converges with the ascending long-term trendline from where EURJPY could start a new rally. Invalidation level of the bearish cycle is 130.347.


GBPJPY

The GBPJPY cross is building a consolidation pattern as a flag pattern, which could make fresh highs to the area between 149.34 and 150.70. Our vision for the cross is that the price could reach the bearish mid-term trendline before it collapses to the lower line of the ascending channel completing a bearish flag pattern of major degree. The next key support is 143.209, invalidation level of the main bearish cycle is at 152.775.


FTSE 100

The FTSE 100 index started the week by falling for the sixth consecutive week. In this session the British index broke down the key support at 7,548, the low reached on June 18th. As we forecasted, FTSE continues their selloff approaching the Potential Reversal Zone in the 7,400 area, from where FTSE could build a new bullish connector. If the index breaks down, the Control Level is likely, that reaches from 7,182 level to 7,073 area. Invalidation level of the bearish scenario is 7,793.5.


DAX 30

DAX  30 is moving bearish in the same way that FTSE 100 is developing a Dead Cat Bounce Pattern. Today, the German index has fallen to the Potential Reversal Zone forecasted, from now we are cautious because the index could start to bounce. The price action, and RSI Oscillator and Awesome Oscillator do not show divergences or reversal signals. To summarise, the short-term bias is bearish. Invalidation level of the bearish cycle is at 13,170 pts.


Categories
Forex Market Analysis

An Interest Rate War is Coming? – 13.06.18 Daily Update


Fundamental Overview


An Interest Rate War is Coming?

Financial Market Latest Updates: In today’s session, the Federal Reserve has decided to increase the interest rate by 0.25%, hiking it from 1.75% to 2%. Beyond commenting the Dollar Index movements or the FED Chairman Jerome Powell’s remarks at the press conference; this interest rate increase the United States is carrying out will mean a change in the course of the monetary policy for the rest of the principal Central Banks.

On the one hand, the ECB has been starting to raise the discourse of the end of the bond purchase program in June and a potential increase in the interest rate that would start from 2019. On the other hand, the Bank of Canada Governor, Stephen Poloz, has commented that there will possibly be a new increase in the interest rate in July (currently at 1.25%). The Reserve Bank of Australia is not far behind in this discourse of rate increases and considers that given the level of inflation in Australia, sooner than later there should be an interest rate hike (the current interest rate is 1.5%.)


Technical Analysis


EURUSD

EURUSD continues moving sideways in the pennant pattern expecting the ECB interest rate decision where we foresee that the pair makes new highs above the 1.19 level.


GBPUSD

GBPUSD continues testing the blue box and bouncing. We expect significant moves in this pair in the next week with the BoE Monetary Policy Meeting scheduled on Thursday 21st. As long as the price does not make a 2B Pattern, a new cycle will not initiate.


USDCHF

USDCHF as forecasted in our previous Daily Update, made a bullish false breakout and then a bearish move. We still expect fresh lows at least to the blue box between 0.9831 and 0.9809.


EURGBP

EURGBP is moving sideways. In terms of the traditional Technical Analysis, we could consider the structure as an inverse head and shoulders pattern and a continuation pattern. Our main scenario is that the cross could strike the 0.8921 level mid-term.


EURJPY

EURJPY is testing the 130.27 resistance, forming an ascending triangle as a continuation pattern of the previous bullish move. We expect that the price reaches the 132.5 level, from where the cross should make a new bearish connector.


FTSE 100

FTSE 100 still is moving in the lateral channel. Remember that the next BoE interest rate decision meeting will take place on June 21st. Despite none of 63 economists polled by Reuters expect any move from the current 0.5%, a surprise effect of the rate hike could move the British Index considerably.


DAX30

DAX 30 still is moving in the sideways corrective structure, it’s probably waiting for the ECB interest rate decision and the Mario Draghi discourse before it continues the bearish bias.


Categories
Forex Market Analysis

Forex and Indices – Daily Update – June 07th, 2018

Forex and indices trading signals for the end of the trading session of June 07th, 2018 and short-term forecast for the coming sessions. In this issue, we make a follow-up of the price cycles of: EURUSD, GBPUSD, USDCHF, EURAUD, EURJPY, FTSE100 and DAX 30.


Hot Topics:


  • Pairs against the Greenback in key levels
  • Euro crosses close to make a second leg
  • European indices trading signals remain with bearish bias but are not activated.

Pairs Against The Greenback In Key Levels

EURUSD reached the 100% of equal waves in the 1.1831 level; this suggests is that the common currency should make a corrective move, probably to the area between 1.172 to 1.166 levels. The bullish target long-term is the area between 1.1889 to 1.194 levels. Invalidation zone is below 1.1616 level.


USDCHF reached the blue box zone from where we anticipate that the Swiss currency should start a bounce. For this pair, our position has changed from bearish to neutral.


GBPUSD, as expected in the previous daily update, is making a corrective move as a bearish connector, where we expect more rises to the pound. Short-term bullish target is between 1.3485 and 1.36 levels. Invalidation level is below 1.3254.


Euro Crosses Close To Make a Second Leg

EURJPY has reached our target area for the first cycle. By the Alternation Principle from the Elliott Wave Theory, we foresee a complex correction, probably a sideways structure. In principle, the correction could end near 128.6 level. From this zone, the price should pay its bearish divergence. As our readers could see in the chart, the corrective sequence is not tradeable (dashed line.) Invalidation level is 126.330.


For EURAUD we have two scenarios. The first scenario consists of the completion of the internal bullish cycle with the price reaching the 1.5547 level, where it could begin a corrective move. The second scenario is for the price to make a corrective sequence in three waves to the 1.5382 area, where the cross could start a rally to the 1.5547 level. If it soars above the Control Level at 1.5621, it is likely that the price would complete its internal bullish cycle in the zone between 1.57025 to 1.57612 level. Invalidation level is at 1.5282.


European Indices Remain With Bearish Bias But Are Not Activated

The FTSE closed the session in the blue box, the potential bearish move with the target in the area between 7,468 to 7,390.5 is active. If the British index breaks down and closes under the 7680, the bearish targets will be activated. The invalidation level remains above 7,803 pts.


In the same way, the DAX remains with a bearish bias short term, selling positions will activate only if the price breaks down and closes below 12,700 pts, with a profit target at 12,500 pts, and the potential extensions to deeper falls to 12,300 and 11,900 pts. Invalidation level remains above 13,102 pts.


Categories
Forex Market Analysis

Forex and Indices – Daily Update – June 06th, 2018

Hot Topics:

  • US Trade Balance Falls.
  • Euro raises supported by ending bonds debate.
  • European Indices Move Sideways.

US Trade Balance Falls

The US Trade Balance deficit falls in April to the lowest level for seven months, boosted by the shipments of industrial materials and soybeans.

GBPUSD continues moving higher, aided by the weakness in the Dollar Index. For the coming sessions, we expect that the price makes a bearish connector, probably in the 1.348 zone before it sees new higher highs. Invalidation level is at 1.3254.

Today Forex Market Analysis


The USDCHF pair still moves sideways above the bullish long-term trendline. If the price breaks down the trendline, we expect more dips. In the first instance to the target should be 0.9783; in the second instance, the next support is 0.9725. Invalidation Level is 0.9983.


Euro Raises Supported by Ending Bonds Debate

In the next week, the ECB could start to debate the end of their bonds buying said Peter Praet, the ECB chief economist. This is not the first signal of the QE ending, on May 29th, the ECB member Sabine Lautenschlaeger noted that “June might be the month to decide once and for all to gradually end net asset purchases by the end of this year.”

EURUSD continued rising after the flag breakout and supported by the macroeconomic data. The next resistance levels are 1.1889, 1.19635 and 1.2102. Invalidation level is updated to 1.1616.


EURJPY continues its rally that started on May 29th when it tested the support 124.621. The first corrective structure it developed was brief, this move makes us suspect that the rally continuation could lead to the 132 to 133 area. In the short-term, the cross could see the 130.270 level for bringing steps to a consolidation structure before it continues the bullish cycle. Invalidation level is 126.330.


EURNZD is making a bullish connector inside a bearish major degree structure. Our vision is that the price could visit the area between the 38.2% to 50% of Fibonacci Retracement before it continues its downtrend. In the short-term, the price made a breakout of the 1.6713 level; this move could lead the price to areas between 1.6866 as first resistance and 1.6947 as the second resistance. Invalidation level is below 1.66.


European Indices Move Sideways

The FTSE 100 is moving in a range between 7,680 and 7,720, expecting more volatility. The price could make a limited high completing an A-B-C pattern before it continues the bearish cycle.


The DAX 30 is running sidelong but could complete three waves move in the zone between 12,946 to 13,014 pts before it continues the bearish sequence started on May 23rd, with the bearish target in the 12,528 pts area. If the price plunges below 12,386, the DAX could complete the bearish cycle near to the 12,000 pts. Invalidation level is updated to 13,102.7 pts. In case that price breaks above this level, the next bullish target is 13,250 pts.


Categories
Forex Market Analysis

Forex and Indices – Daily Update – May 31st, 2018


Update On Forex Market Hot Topics:


  • The U.S. Commerce Department announces tariffs to EU.
  • Euro currency shows bullish signals against crosses.
  • European Indices Continue the Selloff.

The U.S. Commerce Department announces tariffs to EU.

The U.S. Commerce Secretary Wilbur Ross announced that it would impose tariffs on European Union steel and aluminium imports as shortly as Thursday. The European Commision President Jean-Claude Junker considered this measure to be “totally unacceptable” and will introduce a settlement dispute with the WTO, and will announce counterbalancing measures in the coming hours, he said.

In this session, EURUSD is correcting the bullish move showed in the last trading session where it climbed above the Invalidation level placed at 1.16317. We foresee that the price could make a corrective structure as a flag pattern, as a continuation of the previous move. The invalidation level is at 1.15205, the next targets levels are 1.1811 and 1.1975.

Update On Forex Market


GBPUSD is consolidating the bearish trend, short-term. In the last trading session, the cable has corrected the strike to the invalidation level of the bearish cycle located at the 1.33231 level. Our vision is that the Pound still has space for more declines, likely to be the area between 1.31095 and 1.29365.


USDCHF is moving close to the bullish long-term trend-line, where the first target area is placed between 0.9815 and 0.9783. If the price continues its movement down, the next support levels are 0.9725 and 0.9641. Invalidation level remains at 0.99831.


Euro currency shows bullish signals against crosses.

EURJPY has made a bear trap (or 2B Pattern) testing the 124.621 level, from where the price made a bullish impulsive move advancing above the 127 level. Now we anticipate that the price could make a consolidation pattern as a flag and then from its breakout, the price could see new highs in the 131 zone. Invalidation level is below 124.998.

Update On Forex Market


EURGBP is moving inside a consolidation structure where the last internal cycle shows an impulsive bullish bias. Oscillators confirm the bullish bias of the cross. The breakout of the upper line of the channel could boost the price to the 0.89 area. Invalidation level is 0.8997.


European Indices Continue the Selloff.

The FTSE 100 closed the session slightly bearish. The British index could make a new high as an A-B-C pattern to 7,800 pts, from where the price could create a new lower low with 7,573 pts as a target. Invalidation level of the bearish cycle is 7,803.5.

Update On Forex Market


DAX dipped more than 1%, dragged like other Euro-zone indices; EURO STOXX 50 felt 1.00%, IBEX 35 drop 1.05% in a session driven by the U.S. tariffs to the EU. The DAX could find support at 12,528 pts, but if it breaks down the 12,386 level, the plunge could be more deep finding support at the 12,000 pts. Invalidation level of the bearish cycle is 13,040 pts.