Categories
Forex Basic Strategies

Forex Momentum Trading With The Help of RSI & MA Indicators

Introduction

If you are a trader, you should have some good ideas about the forex market. After having the basic knowledge and related stuff, you, as a trader, need to find a profitable forex strategy. After that, you need to find a proven track record of your strategy.

Therefore, you can easily implement it and start earning through your trades within a short time. However, it would help if you kept in mind that the forex is an uncertain and unstable trading market. Therefore, you must have a profitable and excellent trading strategy if you want to sustain here.

If you search on the internet, you will find thousands of proven strategies out there. The good thing is that experienced traders or mathematicians have created most of the strategies. You have to choose the best one for you.

However, the momentum-based strategy is profitable and famous too. Lots of traders are using this one as their primary trading strategy. However, if you find another suitable strategy, you can go for it besides the momentum trading strategy to boost your probability.

What is The Momentum Trading Strategy?

Momentum is a term that refers to buying a currency pair when it goes up and selling when it goes down. It is a very popular trading strategy among most professional traders.

When a big volume starts a movement, it creates a reliable market trend. Therefore, market momentum will be towards the trend that we can identify by reading the chart. In a strong bullish momentum, the price will aggressively create higher highs with a constant speed.

Similarly, in a strong bearish momentum, the price will create lower lows. After identifying the market momentum, we will move to one timeframe lower to take the trade.

However, forex trading always has an uncertain environment. No one can guarantee a 100% movement of price. However, when the market is in a trend, we can make a decent profit by using the momentum-based trading strategy.

Momentum Trading Strategy

Here is the most important part that you are looking for passionately. You will find the best momentum trading strategy for both the newbie and experienced traders. This guideline will answer all your queries.

Let’s have a look at the step by step approach of the momentum trading strategy.

Select the Currency Pair

First, you need to determine the price change from the last three months of some selected currency pairs. Also, don’t forget to do this calculation for the weekend. Once you find the last three months’ price changes, you need to research the last 13 weeks’ price movement.

In terms of currency pair, there is no clear indication of how much pair you should choose. Nevertheless, the ideal and wise option is to go through seven major currency pairs and cross pairs. It is better to put less importance on exotic pairs as they are risky because of their volatility.

After calculating the last three months’ price changes, it’s time to select the currency pair that moved much more than the others. As it is a proven profitable trading strategy, a currency pair can provide a 17% average annual profit. As per the last seven years of market observation, three months’ price has become a reliable factor while selecting the momentum-based strategy.

Entry

As we have a predetermined trend, you need to implement a trend continuation trading strategy to improve your overall trading result better. Moreover, many trend continuation strategies are there for you; you need to select a suitable one. In this trading strategy, we will use 20 Dynamic Exponential Moving Average (EMA) as a trend continuation indicator.

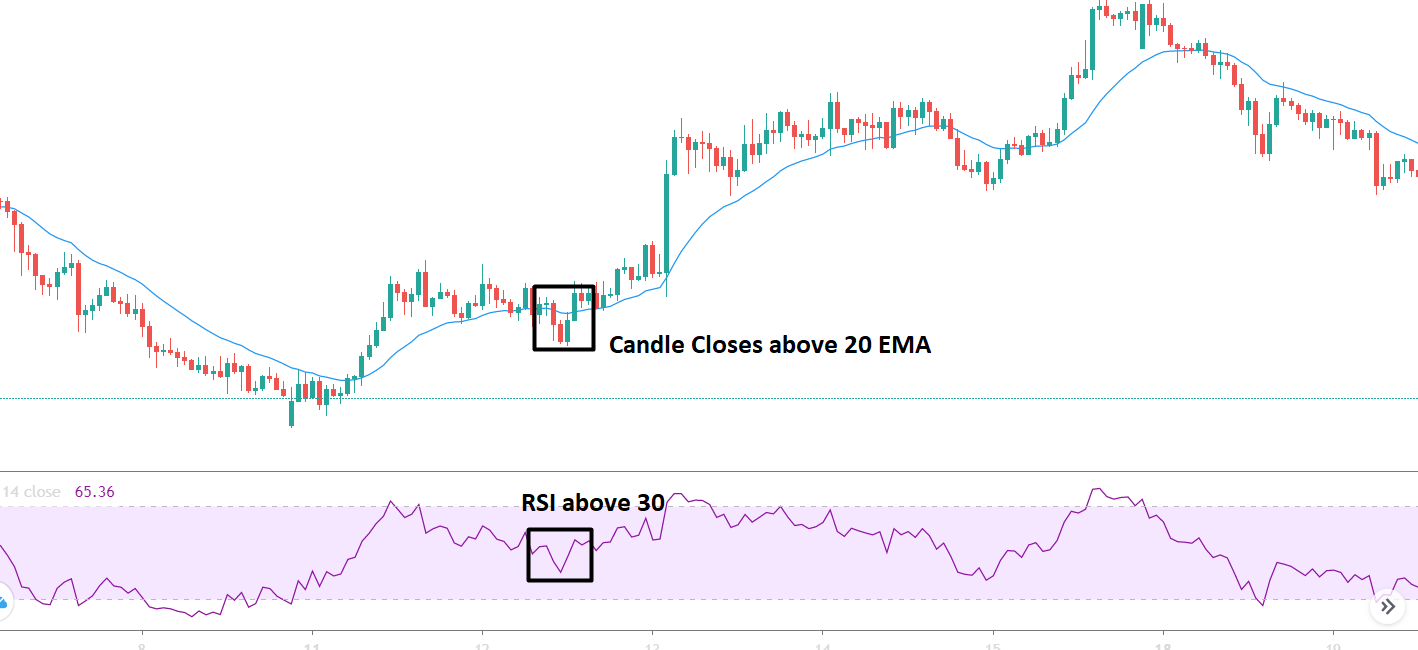
You should enter the trade towards the direction based on market momentum once the price rejects the 20 EMA with its body. Moreover, there is a good and effective solution for determining the trends’ strength: RSI. RSI is a good indicator, as well.

RSI stands for the Relative Strength Index. It has a 0-100 levels indicator. If the price goes below 30 levels, the price is likely to reverse towards the upside. On the other hand, if the price moves above the 70 RSI, it is likely to move down.

For a sell trade follow the following condition:

  • The price is moving towards the direction set in the market momentum.
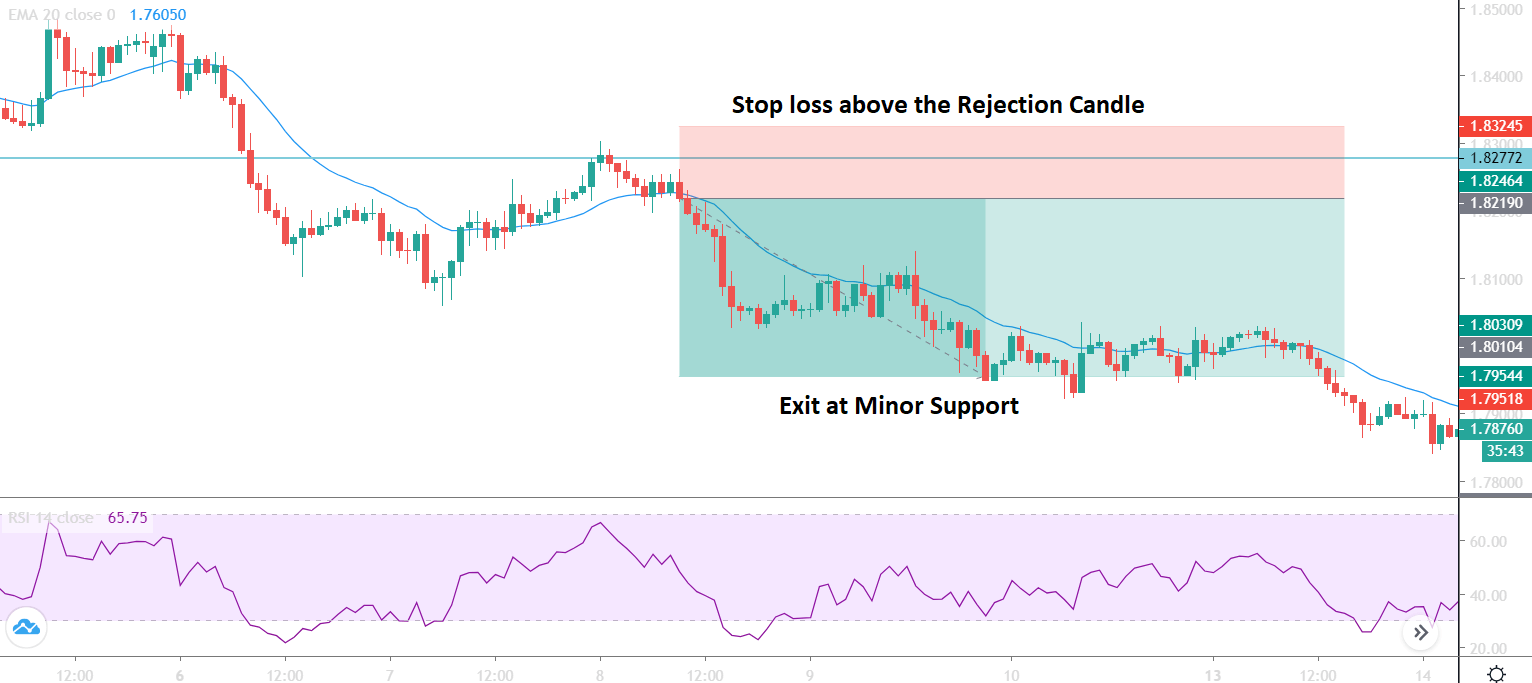
  • The RSI is moving down from the 70 or 80 levels.
  • Price rejects the 20 EMA with a reversal candlestick formation.

Similarly, for a buy trade follow the following condition:

  • The price is moving towards the direction set in the market momentum.
  • The RSI is moving up from the 20 to 30 levels.
  • Price rejects the 20 EMA with a reversal candlestick formation.

Later on, enter the trade as soon as the candle closes above or below the dynamic level.

Stop Loss and Take Profit

After taking a trade, you need to determine the strength of the trend. You can set the stop loss 15 pips above or below the reversal candle or 20 days Average True Range (ATR).

To set the take profit, you need to determine how strong the running trend is. Moreover, impulsive pressure will indicate that the price may break the near-term support or resistance level. In that case, you can increase your take profit level. Alternatively, you can book some profit once you see the price stalling at the support or resistance levels.

Summary

In a nutshell, the summary of the entire guideline is here-

  • Find out the direction by calculating the last 13 weeks of market momentum.
  • Follow the market direction using a dynamic and hourly candle level of 20 EMA with a proper candlestick pattern.
  • According to the price action or ATR, set your stop-loss.
  • Following the market movement, you can set your take profit.

In this momentum trading strategy, trade management is the most challenging part as it requires to follow the market trend strongly. Since we know the forex market is uncertain, we should follow the market trend robustly. Moreover, you should follow an appropriate money management system that goes with your personality, and for each trade, it is wise to take less than 2% risk.

Categories
Forex Course

102. Brief Introduction To Momentum Indicators

Introduction

Leading and lagging indicators are not the only categorizations of technical indicators. If we dig deeper, we can find more classifications and momentum indicators are one such classification in leading indicators. Before getting into momentum indicators, let’s first define the term momentum. Momentum, in general (physics), is the product of mass and velocity. The meaning of momentum is not different in trading too.

What are the Momentum Indicators?

Momentum indicators are a type of indicator that determines the velocity or the rate at which the price changes in security. Unlike moving averages, they don’t depict the direction of the market, only the rate of price change in any timeframe.

Calculating Momentum

The formula for the momentum indicators compares the most recent close price with the close price of a user-specified time frame. These indicators are displayed as a separate line and not on the price line or bar. Calculating momentum is simple. There are two variations to it but are quite similar. In both, momentum is obtained by the comparison between the latest closing price and a closing price ‘n’ periods from the past. The ‘n’ value must be set by the user.

1) Momentum = Current close price – ‘n’ period close price

2) Momentum = (Current close price / ‘n’ period close price) x 100

The first formula simply takes the difference between the closing prices while the second version calculates the rate of change in price and is expressed as a percentage.

When the market is moving upside or downside, the momentum indicator determines how strongly the move is happening. A positive number in the first version determines strength in the market towards the upside, while a negative number signifies bearish strength.

How are Momentum Indicators useful?

As mentioned, momentum indicators show/predict the strength of the movement in prices, regardless of the direction, be it up or down. Reversals are trades where one can make a massive killing with it. And momentum indicators help traders find spots where there is a possibility of the market to reverse. This is determined using a concept called divergence, which is discussed in the subsequent section.

Momentum indicators are specifically designed to show the relative strength of the buyers and sellers. If these indicators are combined with indicators that determine the direction of the market, it could turn out to be a complete strategy.

Concept of Divergence

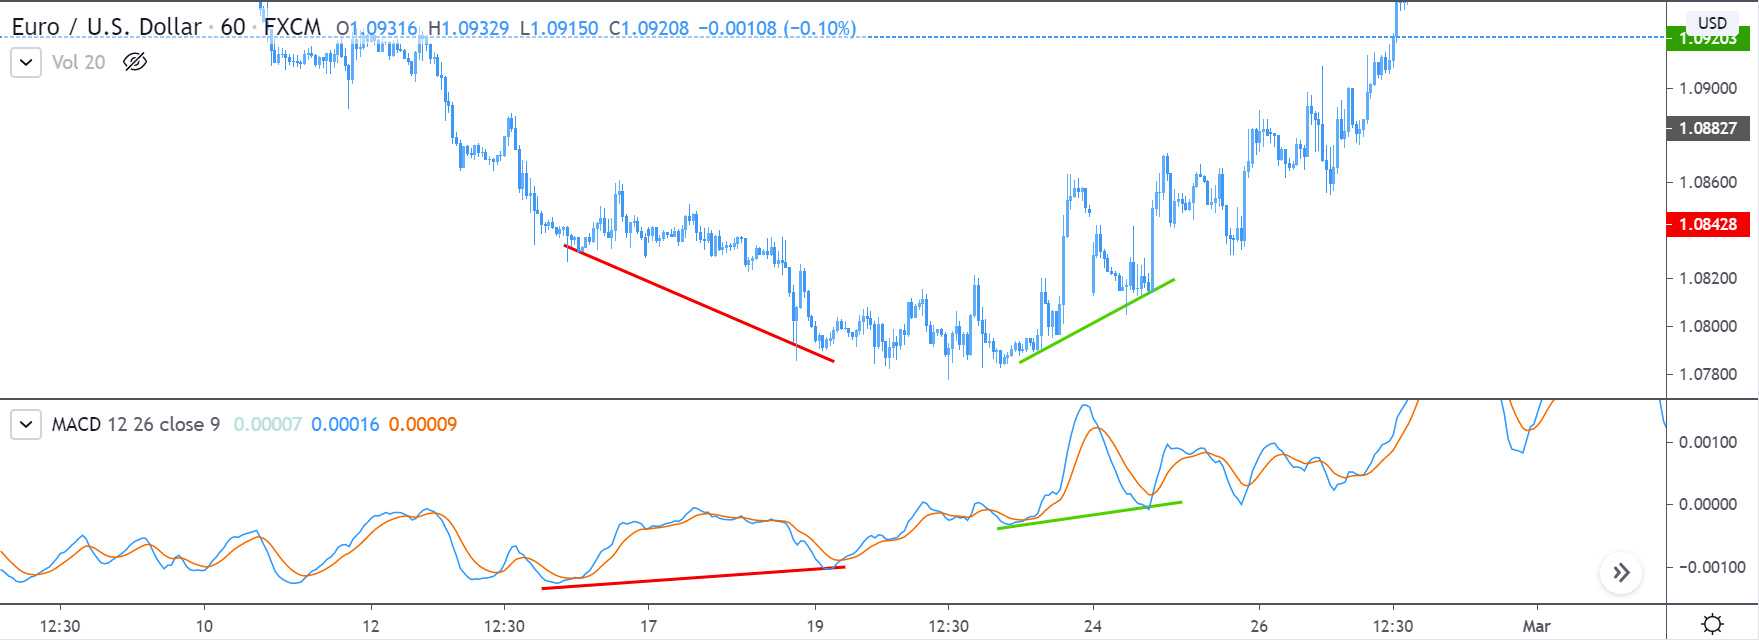
Consider the chart of EUR/USD given below. The MACD indicator (momentum indicator) is plotted as well. From the price chart, the market was in a downtrend, but the divergence was moving upward. It means that the indicator has diverged from the price chart and is indicating that the sellers are losing strength.

In hindsight, the market reversed its direction and started to move upwards. Hence, the MACD predicted the reversal in the market. Moving forward, when the market laid its first higher low, the MACD too was inclined upwards, indicating that the buyers are strong, and the uptrend is real. And yet again, the MACD proved itself right.

This concludes the lesson on momentum indicators. In the coming lessons, let’s get more insights over this topic. Don’t forget to take the below quiz before you go.

[wp_quiz id=”70612″]
Categories
Forex Price-Action Strategies

A Classic Example of the H4 Breakout Trading

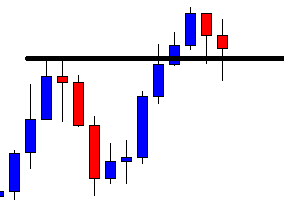
In our trading lesson, we have been demonstrating H1 breakout strategies in our last five lessons. Today, we are going to demonstrate an H4 breakout trade setup, which is a classic example of price action breakout trading. The price makes a bullish breakout at the last highest high; comes back at the breakout level and produces a beautiful bullish engulfing candle closing well above consolidation resistance to offer a long entry. Let us proceed and see how it occurs.

The chart shows that the price heads towards the North with good bullish momentum. On its way towards the North, it does not produce even a single bearish reversal. It suggests that the buyers have been very confident. It makes a breakout at the last swing high. The breakout is not explicit though. However, the price continues to go towards the North after the breakout. Then, it finds its resistance and produces two bearish reversal candles. Look at the last candle. It closes within the last highest high (breakout level), which is a flipped support now. This is one of the most important factors in price action trading. The price reacts to such levels and produces reversal candles.

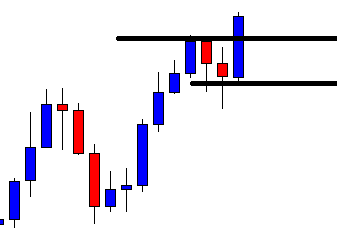
As mentioned, the level produces a bullish engulfing candle closing well above consolidation resistance. The buyers may trigger a long entry right after the candle closes by setting stop loss below the level of support and by take profit with 1R. Let us proceed to the next chart how the trade goes.

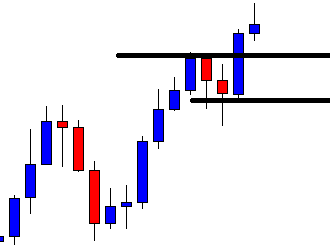
The last candle comes out as a spinning top. Not a good start for the buyers, but the buyers must keep patience here. Trading on the H4 chart allows traders to manage their trade and take early exit. However, they must not think taking an early exit here. The last candle is not a strong bullish candle, but it is not a strong bearish reversal either. Let us proceed to the next chart. It may take one good candle to hit the target.

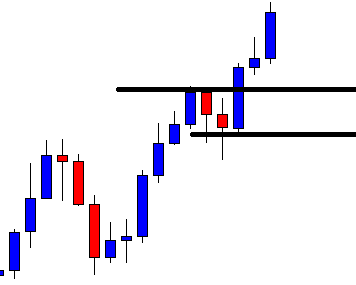
The price does not take too long to hit the target. It hits the target with the last candle. This is a classic example of trading on the H4 breakout trading. After the breakout, the price comes back at the breakout level. It produces a bullish reversal candle right at the breakout level. The bullish reversal candle comes out as an engulfing candle closing well above consolidation resistance. Price actions traders wait for the price to behave like this to take an entry.


Categories
Forex Daily Topic Forex Price-Action Strategies

Don’t Lose Patience if a Chart Does not Produce the Signal

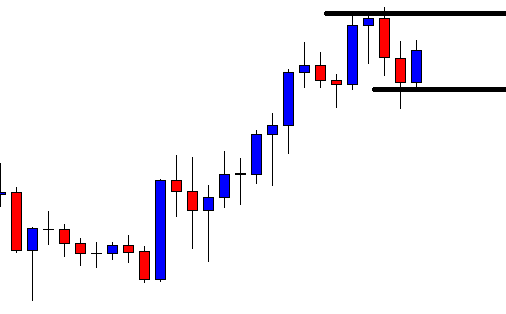
Breakout strategy traders wait for a breakout followed by a breakout confirmation candle. If the next candle does not close with a new higher high/lower low from the breakout candle, traders must not trigger entry. The price may go towards the trend sometimes, but it often goes another way. In today’s lesson, we are going to demonstrate an example of this where everything looks good, but it ends up without producing a signal candle.

The chart shows that the price heads towards the North with good bullish momentum. It finds its resistance and makes a correction. Upon finding its support, the chart produces a bullish engulfing candle. The candle suggests that the price may head towards the North. The buyers are to wait for the breakout followed by a breakout confirmation candle to trigger a long entry.

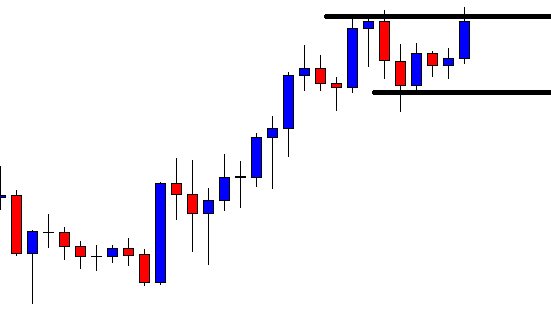
The price heads towards the North but does not make a breakout candle yet. The last candle closes within the level of resistance. The buyers must wait and keep their eyes on the chart since the breakout may take place anytime soon.

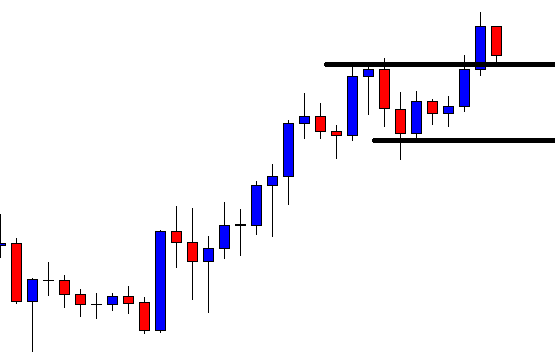
Here it comes. The last candle on the chart breaches through the level of resistance closing well above it. This is one good breakout candle. This must attract the buyers to stick with the chart and hope for the next candle to close above the breakout candle to trigger the entry. It looks extremely good. The entry is knocking at the door. Let us proceed to the next chart.

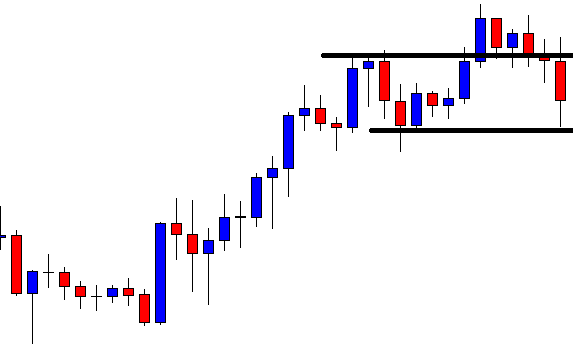
The breakout strategy buyers must be disappointed. After all the hours of waiting, the chart produces a bearish inside bar. Pullback buyers may wait for a bullish engulfing candle to go long in the pair. However, this chart does not have anything to offer for the breakout strategy traders at the moment. Let us proceed to the next chart to find out what happens.

The chart produces a bullish inside bar. However, the price heads towards the South with good bearish momentum. The last candle seems to hit the level of support as well. This means it does not produce any signal for the pullback buyers as well. It is disappointing when traders do not get the signal they wait for a long time. However, it does not hurt as much as a losing trade does. After a long wait, if a chart does not produce the signal, it often leads us towards taking bad entry in other pairs. Let us make sure we never do that. Patience is a great virtue as far as Forex trading is concerned. Traders must make sure that they have this virtue.