Categories
Forex Daily Topic Forex Price-Action Strategies

Don’t Lose Patience if a Chart Does not Produce the Signal

Breakout strategy traders wait for a breakout followed by a breakout confirmation candle. If the next candle does not close with a new higher high/lower low from the breakout candle, traders must not trigger entry. The price may go towards the trend sometimes, but it often goes another way. In today’s lesson, we are going to demonstrate an example of this where everything looks good, but it ends up without producing a signal candle.

The chart shows that the price heads towards the North with good bullish momentum. It finds its resistance and makes a correction. Upon finding its support, the chart produces a bullish engulfing candle. The candle suggests that the price may head towards the North. The buyers are to wait for the breakout followed by a breakout confirmation candle to trigger a long entry.

The price heads towards the North but does not make a breakout candle yet. The last candle closes within the level of resistance. The buyers must wait and keep their eyes on the chart since the breakout may take place anytime soon.

Here it comes. The last candle on the chart breaches through the level of resistance closing well above it. This is one good breakout candle. This must attract the buyers to stick with the chart and hope for the next candle to close above the breakout candle to trigger the entry. It looks extremely good. The entry is knocking at the door. Let us proceed to the next chart.

The breakout strategy buyers must be disappointed. After all the hours of waiting, the chart produces a bearish inside bar. Pullback buyers may wait for a bullish engulfing candle to go long in the pair. However, this chart does not have anything to offer for the breakout strategy traders at the moment. Let us proceed to the next chart to find out what happens.

The chart produces a bullish inside bar. However, the price heads towards the South with good bearish momentum. The last candle seems to hit the level of support as well. This means it does not produce any signal for the pullback buyers as well. It is disappointing when traders do not get the signal they wait for a long time. However, it does not hurt as much as a losing trade does. After a long wait, if a chart does not produce the signal, it often leads us towards taking bad entry in other pairs. Let us make sure we never do that. Patience is a great virtue as far as Forex trading is concerned. Traders must make sure that they have this virtue.

Categories
Forex Price-Action Strategies

The Benefit of Checking Minor Chart before Taking Entry

In one of our lessons, we have learned that when a breakout confirmation candle comes out with a long upper or lower shadow needs to be checked on the 15-min chart. The last 15 M candle plays a significant role to drive the price towards the breakout direction. A breakout confirmation candle with a long upper or lower shadow does not mean that the last 15M candle comes out as a reversal candle. We are going to demonstrate an example of this in today’s lesson.

The price after being bearish finds its support. The chart produces two bullish candles consecutively. A level of resistance produces a bearish reversal candle. The correction length looks good. Let us proceed to the next chart.

The next candle comes out as a bearish candle as well. However, it closes within the consolidation support. The sellers are to wait for a candle to breach the level closing well below it. It is waiting time for the sellers.

The last candle breaches through the consolidation support. The breakout does not look an explicit breakout. However, it closes below the level. If the next candle closes below the breakout level, that would confirm the breakout. The breakout confirmation candle holds the key for the sellers.

The last candle closes below the breakout candle. This confirms the breakout. However, look at the long lower spike. This looks ominous for the sellers. In naked eyes, it does not look to be a good confirmation candle for the sellers to trigger a short entry. Let us now flip over to the 15 M chart and find out how the last candle comes out.

This is the 15 M chart. The last candle is a strong bearish candle despite having a long lower spike. We do not need to flip over to any minor chart here. This means the pair is having a strong bearish momentum in the 15 M chart, which is a signal for the sellers to trigger a short entry.

As expected, the next candle comes out as a bearish candle. It seems that the price is going to hit 1R in a hurry. Let us proceed to the next chart to find out how the trade goes.

The price heads towards the South with one more candle. It hits the take profit level (1R) with ease. The price may make a more bearish move as well. The trade setup with a less promising breakout confirmation candle works wonderfully well for the traders. Do not forget to check the 15 M chart if the confirmation candle has a long upper/lower shadow. It may help you decide which entry to take and which one not to.

Categories
Forex Daily Topic Forex Price-Action Strategies

Long Shadow in Breakout Confirmation Candle

In price action trading, breakout, as well as confirmation candle’s attributes, plays a significant role. In today’s lesson, we are going to demonstrate an example of how the upper/lower shadow of a breakout confirmation candle plays a role in offering us an entry. Let us get started.

This is an H1 chart. The chart shows that the price makes a strong bearish move. It finds its support. Having a bounce, it goes towards the North. The last candle suggests that the price may have found its resistance too. If it makes a breakout at the level of support, upon getting breakout confirmation, the sellers may go short in the pair.

The price heads towards the South but not with good momentum. It takes only one candle to make a breakout. The sellers must wait. Let us find out what happens next.

Here it comes. The last candle breaches through the level of support. It has a lower shadow, but it closes well below the level. The sellers are to wait for the second important factor, which is breakout confirmation.

The next candle comes out as a bearish candle closing well below the breakout candle’s lowest low. In naked eyes, the sellers may trigger a short entry right after the last candle closes. However, the confirmation candle has a long lower shadow. To be sure about it, we may flip over to the 15 M chart. Let us have a look at the 15 M chart.

Look at the last 15M candle. This is a bullish pin bar, which is a strong bullish reversal candle. The 15 M traders may push the price towards the North. It means the H1 sellers may have to wait to reach the target. That may even end up being a losing trade. Let us flip over to the H1 again.

The last candle comes out as a bullish corrective candle. Usually, the price goes down after a breakout confirmation in such a setup. It this case, it does not. It may keep pushing towards the North even further. Let us find out what happens next.

The last candle comes out as a bullish corrective candle. Usually, the price goes down after a breakout confirmation in such a setup. It this case, it does not. It may keep pushing towards the North even further. Let us find out what happens next.

Yes, the price heads towards the North further. The last candle breaches through the breakout level as well. This does not look good for the H1 sellers. It all starts with a long lower shadow (in a selling market).

Whenever we see a long lower/upper shadow in an H1 chart, we may check it with the 15 M chart. If the last 15 M candle is a strong reversal candle (for opposite trend), we may skip taking the entry.

Categories
Forex Daily Topic Forex Price-Action Strategies

Price Action Trading: Entries to Take and Entries to Skip

In today’s price action trading lesson, we are going to demonstrate an example of a chart that offers multiple entries. We try to spot out entry/entries that we may skip and the entry/entries we may take. We try to find out the reasons behind that as well. Let us get started.

The price after being bullish for a long time produces a bearish reversal candle and heads towards the South. Look at the last candle. It comes out as a bullish inside bar. Price action traders start eyeing on such a chart to go short. However, the sellers would love to see the price have deeper consolidation.

The chart does not make a deep consolidation. It produces a bearish engulfing candle closing well below consolidation support. The trend and the reversal candle get 10 on 10, but the consolidation is not deep enough. It is not an A+ entry. It is best if we restrain ourselves from taking such entry. Let us proceed to the next chart.

Many of us may think an opportunity missed. Here is one added lesson on ‘ do not cry over spilled milk.’ Forex traders must obey this. Let us concentrate on the chart again. The last candle comes out as a very strong bearish candle. The pair may offer more short entries.

The chart produces a bullish inside bar again. The equation is simple for the sellers based on price action. The chart is to produce a bearish engulfing candle closing well below consolidation support. Let us proceed to the next chart.

Here it comes. This is one good-looking bearish engulfing candle closing well below consolidation support. The trend, consolidation length, and the bearish reversal candle all get 10 on 10. As far as price action breakout trading strategy is concerned, this is an A+ entry. Let us now find out how the entry goes.

It does not go according to our expectations. It rather produces a bullish inside bar again. It is an inside bar. Thus the sellers still hold the key here. The fact remains at the first consolidation, despite having shallow consolidation, the price heads towards the South with extreme bearish momentum. On the contrary, despite being an A+ entry, the price does not move according to the sellers’ expectations. It may even go towards the North and hits the stop loss. Then again, we must stick with our trading rules and be extremely disciplined. Let us proceed to the next chart to find out what happens next.

Ah! What a move this is! The sellers make some green pips here. The chart makes them wait, but it pays them back. As mentioned, it could go another way. That does not mean we start thinking to change our strategies or start taking random entries. We must make sure we only take entries that get A+ after considering all the segments.

Categories
Forex Price-Action Strategies

A Thing You May Notice in the H1 Breakout Strategy

We are going to demonstrate an example of the H1 breakout strategy in today’s lesson. Usually, the H1 breakout strategy does not make traders wait too long to hit the target. However, if the breakout level is a double top or a double bottom level on the H4 chart, the price gets even more momentum to hit the target. Today’s breakout level is a double bottom level on the H4 chart. Let us now find out what happens after the breakout.

After making a bearish move, the price makes a correction. The last candle on the chart comes out as a bearish engulfing candle. This means the price finds its resistance. If it heads towards the swing low and makes a breakout, price action sellers may jump into this chart to make some green pips by going short in the pair.

The last candle makes a breakout at the level of support. This is an explicit breakout. Please note that the price bounces at the same level earlier. This means this is a double bottom support level on the bigger chart. This is an H1 chart. Thus, this must be a double bottom support level of the H4 chart.

The next candle closes below the breakout candle. It confirms the breakout. The sellers may trigger a short entry right after the last candle closes by setting stop-loss above the level where the trend starts and setting the take profit with 1R.

The price heads towards the South with extreme pressure. The price is about to hit the target on the next candle after triggering the entry. It does not, but the sellers get their message. A strong bearish candle like this suggests that the pair would remain bearish at least for two more candles. That would be enough to hit the target.

The chart produces a bullish inside bar before hitting the target. If we count, it takes only three candles to hit take profit level. As mentioned, the H1 breakout strategy hits take profit level in a hurry. So does this one. If we calculate the next candle after the signal candle, we see that the candle comes out as a very strong bearish candle and generates strong bearish momentum. This is often seen when the H1 chart makes a breakout at a level, which is a double top or double bottom level on the H4 chart too. We do not need to concentrate on this if we aim to trade on the H1 breakout strategy. However, noticing such things help us be better traders to some extent.


Categories
Forex Daily Topic Forex Price-Action Strategies

Manage Your Trade Differently on Different Charts

In today’s lesson, we are going to demonstrate an example of an H1 breakout strategy. Before hitting the target, at some point, the price gets sluggish. Nevertheless, it hits the target in the end. Let us now proceed to find out the lesson it has to offer us.

This is an H1 chart. The price gets choppy within these two horizontal lines. It has a rejection and makes a bearish move upon producing a bearish inside bar. The chart is yet to make a breakout. Until it makes a breakout, it does not have anything to offer to the buyers or the sellers. However, as it stands, the buyers may have an upper hand here. Let us proceed to the next chart.

Here it comes. After a long while, a candle breaches through the level of support closing well below it. The candle has a long lower shadow, but the breakout is explicit. The sellers are to wait for the next candle to close its lowest low to trigger a short entry.

The next candle comes out as a strong bearish candle. This is one perfect looking bearish candle to attract the sellers to trigger an entry. The sellers may trigger a short entry right after the candle closes, setting stop-loss above the level where the trend starts with 1R.

As expected, the price heads towards the South with good bearish momentum. However, look at the last candle. It comes out as a spinning top. In a strong bearish trend, it is not considered as a strong bullish reversal candle. Moreover, it is an H1 chart, and the entry is triggered based on the H1 breakout strategy. Thus, the sellers must hold their position and wait. To be precise, they should not even look at this chart anymore by following the rule of ‘Set and Forget.’

The price hits the target. The next candle, after the spinning top comes out as a bearish candle. However, it closes within consolidation support. If it were an H4 or the daily chart, the sellers would have to close the trade manually. This is the difference between trading on the minor chart and major chart.

If we have a plan to take trading as our fulltime business, we may have to trade on different charts from the 15M to Weekly. Trade management varies from chart to chart. This is what we must remember. In the beginning, we shall master on a particular chart that we are comfortable with. Then, we may start trading on the other charts, preferably on the demo first. Once we are confident, we may trade on that chart in our live account. We must not apply a strategy or manage the trade the same way on the weekly chart that we are successful on the H1 or the 15 Chart.

Categories
Forex Psychology

Trading Psychology: Learn the Art of Getting Over a Floating Losing Trade

In today’s lesson, we are going to show an example of a trade setup, which tests our psychology and ask us a big question. This situation is something that often happens with traders trading on the major pairs. We try to find out the answer to what we shall do in such a situation.

This is a daily chart. The price finds its support after being bearish for a long time. It produces a bullish engulfing pattern followed by another bullish candle. Using the daily-H4 combination, traders shall flip over to the H4 chart to get consolidation and a bullish reversal candle to go long above the last swing high. Let us flip over to the H4 chart.

The H4 chart suggests that the buyers may take control soon. A massive bullish engulfing candle followed by an inside bar bearish candle may attract the buyers to go long upon getting another bullish engulfing candle. The buyers are to keep their eyes on this chart since the chart may produce the signal candle anytime.

It does not produce the signal candle immediately. However, after a while, it produces a bullish engulfing candle closing above the last swing high. This is an A+ trade setup as far as the daily-H4 chart combination trading is concerned. The price makes a deep consolidation and produces the signal candle afterwards. This is what breakout traders love to see. A long entry may be triggered right after the last candle closes. Let us proceed to the next chart to find out what happens afterwards.

This must be painful for the buyers. The trade setup looks very good, but things have not been going as expected. The price comes back within the consolidation zone. This looks ominous for the buyers. Since this is an H4 chart, the buyers have the opportunity to look after their trade. They may ask themselves whether they should keep the entry or close it manually? I let you think about it for a minute.

If your answer is the buyers shall close the trade manually, you may not be right. The reason behind this is, once a trade is floating on a loss, traders shall leave it and let it finds its own way. If it hits the stop loss, let it hit it. Traders are to calculate this risk well before they take entry. If a trade is running on profit but acts unusual or gets sluggish at a significant level of support/resistance, that might be a different case. Although the chart suggests that most probably, the price is going to hit stop loss, the buyers shall hold the entry and concentrate on other pairs. If a trader wants to survive in this market for a long time, he must acquire this skill of getting over on a floating losing entry and concentrating on a new trade setup.

Categories
Forex Price Action

Never Know What is around the Corner

In today’s lesson, we are going to demonstrate an example of trend riding along with the H4 breakout trading strategy. We often see that the market is in a strong direction, but it does not offer many entries. It is frustrating, but we must take it easy. We must not be impatient but keep our eyes on the chart. We never know what is around the corner.

This is an H4 chart. The chart shows that the price has been heading towards the South with strong bearish momentum. However, it has not offered any A+ entry yet. It produces some strong bearish engulfing candle breaching through consolidation support. However, consolidations have been shallow. Thus, the sellers on this chart have not been able to make the most of it. Look at the last candle. It comes out as a strong bearish candle as well. It suggests that the bearish trend is strong enough, and it may drive the price towards the South further. Let us proceed to the next chart.

The chart produces a bullish inside bar. This time it looks better since the inside bar candle is a long one. This means if the chart produces a bearish engulfing candle again, it would be after a deep consolidation. The deeper consolidation, the better it is as far as reward is concerned.

The chart produces two more bullish candles. It looks like it has been searching for its support. Deeper consolidation/correction is good, but if it goes too far by making a bullish breakout, equation changes. Let us proceed to the next chart.

Here it comes. An A+ bearish engulfing signal candle this is. The sellers may trigger a short entry right after the candle closes by setting stop-loss above the candle’s high. Take profit may be set with 1:1 risk-reward.

The chart produces another bullish corrective candle after such a nice-looking bearish reversal candle. However, it heads towards the South and hits the target. We learn two lessons here.

  1. A chart may not offer as many entries as we anticipate, even it is on a strong trend.
  2. We never know what is around the corner in the Forex market.

At one point, it seems that the chart may not offer any short entry for the H4 sellers. The price keeps heading towards the North. Deep consolidation is about to get into too deep. At last, the signal candle comes and offers an excellent short entry. While trading, we are always to be on our toes since we do not know what is around the corner in the Forex market.


Categories
Forex Daily Topic Forex Price-Action Strategies

ABC Pattern Trading: A Little Adjustment Needed According to the Charts

The ABC pattern is one of the traders’ favorite trading patterns for its lucrative risk-reward. It usually offers at least 1:2 risk-reward. In many cases, it offers even more. However, the price may sometimes find it hard to make a breakout at point B. That is where the ABC pattern traders must be patient and hold their nerves while trading on the minor charts. However, with major charts, it is a bit different. In today’s lesson, we are going to demonstrate an example of the ABC pattern trading on a minor chart.

This is an H1 chart. The price heads towards the North with good bullish momentum after having consolidation for a long time. The ABC pattern traders are to wait for the price to make a downside correction and produce a bullish reversal candle at C point.

The price has been on a downside correction. It produces three consecutive bearish candles. The ABC pattern buyers shall keep their close eyes on the chart to get a bullish reversal candle.

The chart produces a bullish engulfing candle. This is an A+ bullish reversal candle. The ABC pattern traders have some drawing work to do before the price produces a reversal candle. We find this out in a minute. Can you guess where the chart produces the bullish reversal candle? Have a look at the chart below.

Do you notice that the price had a massive rejection at the same level earlier? The chart produces the bullish reversal candle at the flipped support. This is an ideal C point. The buyers may trigger a long entry right after the candle closes by setting stop loss below the signal candle. As mentioned, take profit may be set at least with 1:2 risk-reward.

After triggering the entry, the price heads towards the North with good bullish momentum for three more candles. It then starts having consolidation around the last swing high (at point B). It often happens. The buyers must wait and hold their positions since the trade setup in on the H1 chart. The intraday ABC pattern traders must follow the rule “Set and Forget”. With the H4, the Daily, it is different though. Let us proceed to the next chart.

The chart produces another bullish candle and hits the target. The buyers’ have achieved their 2 R target. We must remember that when we trade on the ABC pattern, we adjust our target according to the chart. Intraday charts (5M, 15M, H1) usually makes a breakout at Point B. Thus, we let the trade run and decide its route. On the other hand, if an entry is taken on the charts such as the H4 and the daily based on the ABC pattern, we may consider taking at least 50% profit at Point B. This is where a little adjustment is needed if we trade based on the ABC pattern.

Categories
Forex Price-Action Strategies

To Maintain Better Winning Ratio, Go with A+ Entry

In today’s lesson, we are going to demonstrate an example of H1 breakout trading. In this example, the breakout candle, as well as the confirmation candle, is not the best one the price action traders like to have. Nevertheless, the price heads towards the trend’s direction nicely. In most cases, it does not happen though.

The price after being bullish gets choppy. It then makes a bearish move but upon finding its support, it produces a bullish engulfing candle. This is the strongest bullish reversal candle, which shall attract the buyers to keep an eye on this chart. Let us proceed to the next chart.

The price does not get bullish as expected. However, an inside bar means that the buyers still hold the key. The chart may produce bullish candle and end up making a breakout at the swing high. The H1-breakout traders must be waiting for a breakout here.

The next candle comes out as a bullish engulfing candle closing above the level of resistance. It is a breakout but the breakout is not explicit. If the candle closes well above the level of resistance, it would attract more buyers. Let us now wait for the confirmation candle. If the next candle comes out as a bullish candle closing well above the breakout candle, it may attract more buyers in the end.

The confirmation candle does not look very promising either. As far as H1 breakout price action trading is concerned, the buyers may trigger a long entry. Considering candles’ attributes, it is not an A+ entry though. Let us proceed to the next chart and find out what the price does.

The price heads towards the North with good bullish momentum. It takes only two candles to hit the target. As mentioned, it is not an A+ entry but the trade gets the buyers some profit. In some cases, we see that even an A+ entry gets us a loss instead.

This is how the market works. We must not lose our patience but stick with our plan. If we take such entry, we may have to encounter less momentum after triggering entry, and more losing trades. We have to have the mental strength to face such losses then. Otherwise, we may skip taking such entry. Such an entry does not always get us profit. We have demonstrated this in today’s lesson.

Another equation we should remember, if we want to take A+ entry, we get less number of entries but more consistency. On the other hand, if we take a signal as long as it meets our trading strategy requirement, we get more entries but less consistency.

Categories
Forex Daily Topic Forex Price-Action Strategies

A Weak Breakout Candle Makes Things Different

In H1 breakout trading, the signal candle’s attributes are as important as the breakout candle. We know that a breakout candle means a lot. So is the breakout confirmation or signal candle. In today’s article, we are going to demonstrate an example of this. Let us get started.

The price after being bearish gets caught within a horizontal channel. However, the last candle comes out as a bearish engulfing candle. It seems that the sellers may take control soon. It all depends on the breakout at the level of support followed by breakout confirmation.

The next candle comes out as a bearish candle as well closing within the level of support. The sellers are to wait longer. On the other hand, the buyers would love to get a bullish reversal right here. The battle is on.

The bear wins. The last candle comes out as a bearish engulfing candle closing well below the level of support. This is what H1 breakout traders want. If the next candle closes well below the breakout candle, the sellers may trigger a short entry.

The next candle comes out as a bearish doji candle. It closes below the breakout candle. The sellers may trigger a short entry. However, this is not an ideal candle showing strong bearish momentum. If a candle like this confirms a breakout, the price may not go towards the take profit level that we would love to see.

After triggering the entry, the chart produces two bullish candles. It looks extremely ominous. Most probably, the entry is going to get us a loss. Taking a loss is a usual thing in the Forex trading. However, the last two candles may be produced because of the fragile confirmation candle. This is where H1 breakout traders shall be a bit careful. If the confirmation candle does not come out as a strong candle, the price may go another way round. Let us find out from the next chart what the price does here.

Oh! It is about to hit the stop loss. It produces a bearish engulfing candle again. The price may head towards the downside and hit take profit level. It is still 50-50 since the price is trading within the level of last swing low. Let us find out how it ends.

Yes, it hits the target at last. However, this is what the price does not usually do when the H1 chart makes a breakout and confirms it. As mentioned, it often happens when the breakout and confirmation candle come out as weak candles. Thus, we may consider this when trading H1 breakout strategy next time.

Categories
Forex Daily Topic Forex Price-Action Strategies

‘Set and Forget’ Tailor Made for H1 Breakout Trading

In today’s article, we are going to demonstrate an example of H1 breakout strategy. It is a typical example of the rule ‘Set and Forget’. To trade on the H1 chart, we must be patient and let the price do its job once we have taken entry. Let us proceed.

The chart shows that the last candle breaches closing below the level of support. As far as the H1 breakout strategy is concerned, traders must wait for the next candle to be bearish closing well below the breakout candle.

The last candle comes out as a bearish candle closing well below the breakout candle. The sellers wait for such candle to confirm a breakout. The sellers may trigger a short entry right after the last candle closes. Stop loss is to be set above where the trend starts and Take Profit is to be set with a 1:1 risk-reward.

The next candle comes out as a bearish candle as well. The sellers must let the price to hit the target. To be precise, they shall not even look at the chart. Stop Loss and Take Profit are set. All they can do is let the price do its job.

Where does that one come from? The chart produces a bullish engulfing candle. It is a strong bullish reversal candle, which may change the trend. To be honest, a candle like this may intimidate any price action trader. Do not forget this is an H1 chart and the entry is taken on H1 breakout strategy. Set and Forget rule comes very handy in this trade setup. Let us assume, we do not even know that the chart produces such a candle. We let the market do its own job.

The next candle comes out as a bearish inside bar. It looks more ominous. If the next candle comes as a bullish engulfing candle, the sellers will be in serious trouble. Let us proceed to the next chart.

The next candle comes out as a doji candle followed by another doji candle. However, the price heads towards Take Profit level and hits the target at last. If we keep looking at such chart, would we be able to hold ourselves back from closing the entry manually? It may get very tough for the traders to hold their nerves with such price action when a trade is running. If a trader trades on the daily or the H4 chart, he may consider closing the entry manually. With the H1 chart trading, traders may not do this. In other words, set and forget when you are trading on the H1 chart.

Categories
Forex Price-Action Strategies

A Different Kind of Breakout Does Its Job Well

In today’s lesson, we are going to demonstrate an H1 breakout trade setup. Usually, the breakout candle makes a breakout by breaching through a level of support/resistance. Today, we are going to study about a breakout that takes place right at the level of resistance, which becomes support after the breakout. We need to be familiar with such a breakout since it happens quite a lot.

The price produces a bullish engulfing candle. The buyers wait for such a good-looking bullish reversal candle. They shall wait for the price to go towards the level of resistance and makes a breakout later. Let us proceed to the next chart.

The price heads towards the North but not right after the reversal candle. However, the bullish momentum looks good. Look at the last candle. It closes right at the level of resistance. It seems the price may make a breakout here soon.

The next candle closes well above the level of resistance. However, the candle is formed right at the level of resistance. Typically, a bullish breakout candle’s 25% of its lower body shall remain below the level of resistance. In this case, candle’s 100% (almost, ignore that very tiny lower body) body is above the level of flipped support. Such a breakout takes place in the Forex market very frequently.

The next candle closes well above the breakout candle. This means the breakout is confirmed. The buyers may trigger a long entry right after the last candle closes.

After triggering the entry, the price heads towards the upside with good bullish momentum. The chart produces two consecutive bullish candles after breakout confirmation. The buyers shall wait for the price to hit the target. For that, the price still has some space to travel towards the North.

The price hits the target and comes back down a little. It goes towards the level again. In this trade setup, the breakout candle’s breakout is not a good one that price action traders look for. In many cases, we may see that the chart does not confirm a breakout but goes another way around. It happens because such a breakout consumes some extra space. Thus, the majority of such breakouts are not confirmed and may not end up offering entry. However, once the breakout is confirmed, and there is enough space for the price to travel, most likely trade setup would work in traders’ favor. In the beginning, we may get puzzled with such a breakout. The fact is if the next candle after a breakout closes above (bullish market) the breakout candle, it is a valid breakout and works as well as the typical breakout candle does.

Categories
Forex Daily Topic Forex Price-Action Strategies

Look for Such Price Action to Trade on the ABC Pattern

In today’s lesson, we are going to demonstrate an example of the ABC pattern trading. The trend-initiating candle comes out as a bullish engulfing candle followed by a bullish breakout. The price then makes a bearish correction and makes a bullish move upon producing a bullish reversal candle at a flipped support. Let us demonstrate with the charts how it happens.

The price has been bearish, but it has produced a bullish engulfing candle at the support zone. The buyers are to wait for the price to head towards the North and make a bullish breakout at the last swing high. Let us proceed to the next chart.

The price makes a breakout at the nearest swing high. The buyers are to wait for consolidation or correction and a bullish breakout. The last candle comes out as a strong bullish candle as well. It may keep going towards the North. Let us wait and find out what it does next.

It starts having a correction. Then, it produces a bearish inside bar followed by two more bearish candles. The price is at the flipped support. The buyers are to keep their eyes on this chart very closely.

Here it comes. The chart produces a bullish reversal candle. Do not miss the point that the level is the breakout level when the price heads towards the North. Such level is very significant as far as the ABC pattern trading is concerned.

The price makes a bullish breakout again and produces a new higher high. Traders may trigger a long entry right after the last candle closes by setting stop loss below the level of flipped support. It usually provides at least 1:1 risk-reward, which is the safest option. Let us proceed to the next chart to find out how it goes.

The price heads towards the North as expected. It hits the target (1R) with ease. The chart suggests that it may go towards the North further. Anyway, the ABC pattern traders shall enjoy their profit and hunt for the next one somewhere else.

In this example, we have seen that four aspects of the ABC pattern trading such trend initiating candle, breakout, reversal candle at the breakout level, and the signal candle get 10 on 10. Consequently, the price heads towards the desired direction with good momentum. If any of them fails to get 10 on 10, the trade may not go, exactly we would love to see it go. To keep excellent trading consistency, try your best to trade the ABC pattern on such price action that we have demonstrated today.

Categories
Forex Daily Topic Forex Price-Action Strategies

Remember the Rule ‘Set and Forget’

In today’s lesson, we are going to demonstrate an example of H1 breakout trading. Usually, in this strategy, the price goes towards the direction with good momentum if things go accordingly. In this example, the breakout candle, breakout confirmation candle are immaculate, but it takes a long pause before it hits the target. It has a lesson to give us. Let us dig into this.

The price after being bearish finds its support. It consolidates for a while and produces a bearish pin bar followed by a bearish engulfing candle. Traders are to wait for a breakout at the level of support to get them prepared to go short on the pair.

The last candle breaches the level of support and closes well below the level. The candle is having a tiny lower spike. Ideally, H1 breakout strategy traders wait for such a breakout candle.  They are to wait for the next H1 candle to close below the breakout candle. If that happens, the game is on. Let us proceed to the following chart.

As expected, the next candle closes below the breakout candle. The candle looks very bearish, being an ideal candle to confirm the breakout. The sellers may trigger a short entry right after the last candle closes. Let us have a look at the same chart with some calculations in it.

The sellers may set the level of stop-loss above the level where the trend is initiated. They may set the take-profit level with 1:1 risk-reward. It means

Entry- Stop Loss= Take Profit-Entry.

The price consolidates after the signal candle. It bounces at the level, where it bounced some hours earlier. This is the first sign of a double bottom. It looks the buyers may take over the control, which may make the price hit the stop loss. You may remember, in one of our lessons, it has been recommended that a trader may have to close his entry manually. It was an example of the Friday market. Today’s market is not the Friday market. Thus, we must not close it manually, as it may get us a loss, but we must let it run. Let us wait and see how it ends.

It looks much better now. The price heads towards the South with good bearish momentum. It may not take much time to hit the target.

It does not go according to your calculation. It takes much longer than our expectations. However, it hits the target at last. The lesson that we have learned here is we must let a trade run to do its bit. Once we take entry after measuring the risk-reward, we must be patient. In a word, we must remember the rule ‘set and forget.’

Categories
Forex Price-Action Strategies

When Things Go Like This

In today’s lesson, we are going to demonstrate an example of H1 breakout trading. We have come to know that it is an excellent trading strategy. It offers 1:1 risk-reward but maintains a tremendous winning consistency. However, the H1 chart is to maintain some attributes to offer us entry with the strategy. Today’s example is one of the ideal charts with those attributes. Let us have a look.

The chart shows that the price gets caught within two horizontal lines. The last candle comes out as a bearish Marubozu candle. Thus, It may be the beginning of a new bearish trend. Traders must wait for the price to continue its bearish move and make a breakout at the level of support.

The price continues its bearish move. The last candle comes out as a strong bearish candle closing below the level of support. It is an explicit breakout. Here comes the trickiest part of this strategy. Traders must wait for the next candle to close below the breakout candle. Let us find out what the price does in the next chart.

Look at the confirmation candle. This is one good-looking bearish candle. Traders shall look for such candle for the breakout and breakout confirmation to trade with H1 breakout trading. A short entry may be triggered right after the last candle closes. Let us find out the level of Stop Loss and Take Profit.

Measure the difference between Stop Loss to Entry and set the Take Profit at the level with the same distance. In a word, it gives us 1:1 risk-reward. It often travels more, but usually, the price consolidates after hitting the target with 1:1 risk-reward. Let us proceed and find out how the trade goes.

The price heads towards the Take Profit level with extreme bearish momentum. The level where we set Take Profit, the price seems to be making another breakout. It looks the sellers still have the controls. However, as far as H1 breakout trading is concerned, the sellers are out with the profit.

You might have noticed that after the breakout confirmation, how the price heads towards the South. It does not take any pauses. We must not be certain about the reasons since it is the Forex market. However, if we consider

  1. The trend initiating candle
  2. The breakout candle
  3. The breakout confirmation candle

We see that three of these candles have all the attributes that the sellers look for in an ideal bearish market. In a bullish market, it is vice versa. If things go like this, H1 breakout trading is one of the most consistent winning strategies. In most cases, the price hits the target as we have demonstrated the example in today’s lesson.

Categories
Forex Daily Topic Forex Price-Action Strategies

Friday Trading May Need More Attention

The Forex market is open from Monday to Friday. Since Friday is the last day of the week, traders may need to look after their trade more. To be precise, they may need to close their intraday trades manually. In today’s lesson, we are going to demonstrate an example of this.

This is an H1 chart. The price after being bearish has been trapped within a rectangle. It could make a breakout either side. However, the last candle suggests that the price is bearish biased. It closes within the level of previous swing low. If the price makes a bearish breakout, the sellers may trigger a short entry upon the breakout confirmation. Let us proceed to the next chart.

The price action produces an inside bar. As we know, an inside bar is a relatively weak reversal candle. It may push the price towards the North; however, if a bearish candle breaches the level of support, the sellers may get ready to go short on the pair.

The last candle breaches the level of support. It is not an explicit breakout. Nevertheless, the candle closes below the level. If the next candle closes well below the breakout candle, the sellers may trigger a short entry by setting the Stop Loss above the trend-initiating candle.

Yes, the next candle closes well below the breakout candle. The sellers may trigger a short entry right after the last candle closes. Usually, the take profit level is to be set with a 1:1 risk-reward ratio on the H1 breakout strategy. Do not forget that it is Friday. It is an essential factor to remember while trading in the H1 breakout trading strategy.

The last candle gets us some green pips. It looks good now. Most probably, it is going to get us the reward, which it usually does. We must wait and hold the position.

We have been waiting for long. The price has been on strong consolidation. It is still to travel more to hit the Take Profit. As mentioned, it is Friday. The market is about to close (within 2 hours). Usually, most of the pairs get sluggish before the market closes on Friday. On Monday, many pairs start trading with a gap. There is no point holding H1 breakout positions during the weekend. Thus, we may close the trade manually and be happy with half the profit of our expectations.

Categories
Forex Daily Topic Forex Price-Action Strategies

The Trend on the Daily Chart Means a Lot

Most of the Forex trading platforms have charts from 1M to Month. It is a debatable issue to determine the best chart among them. All these charts have merits as well as demerits. However, the Daily Chart plays an important role as far as determining the trend is concerned in the Forex market. In today’s lesson, we are going to demonstrate an example of how long term trend on the daily chart may help us guess the price’s next direction.

This is a daily chart. The price after being very bearish gets choppy. A bullish breakout may make the price go towards the North. On the other hand, a bearish breakout keeps the price being bearish. It could go either way. However, the long-term trend on this chart is bearish biased. Moreover, the last candle comes out as a bearish engulfing candle. Thus, the pair may get bearish again. Let us flip over to the H4 chart and find out how it looks.

The chart shows that the price has been bearish on the H4 chart. However, the price finds its support at the same level, where it had a bounce earlier. If we consider only the H4 chart, the price may get bullish. Do not forget that the daily chart’s long-term trend is bearish. Let us proceed to the next H4 chart.

The last candle comes out as a bearish engulfing candle closing below the level of support. It may get tough to guess what happens here. Have a look at the same chart with two horizontal lines to make things simpler.

The price produces that bearish engulfing candle after a bullish corrective candle. The Stop Loss level is explicit, so it is entry-level. The sellers may trigger a short entry right after the last candle closes. Since there is no support nearby, the sellers may hold their entry until it produces a bullish reversal candle.

The short entry goes well — the price heads towards the South with good bearish momentum. The last candle comes out as a bullish engulfing candle. It is a strong bullish reversal candle. It is time for the sellers to close the entry.

As mentioned, the price in such a case can make a bullish breakout too. Traders must look for long entries then. However, in such price action on the daily chart, we may concentrate more on the chart when it produces a reversal candle in favor of the long-term trend. This is how we give ourselves more chances of getting an entry.


Categories
Chart Patterns

Chart Patterns: Symmetrical Triangles

Symmetrical Triangles

Out of all the triangle patterns, symmetrical triangles are perhaps the most common and the most common and the most subjective. Symmetrical triangles have a standard neutral bias; however, symmetrical triangles most often form after a prior trend, because they most commonly form after a prior move. The preference of their trading direction is determined by the direction from the previous move. If the preceding move was bullish, then the symmetrical triangle is viewed as a bullish continuation pattern. Like all triangle patterns that form after a trending move, they are known as pennants.

The construction of a symmetrical triangle is like any other triangle: it requires to trendlines that intersect: one upward sloping angle and one downwards sloping angle. Price action should touch both the upper and lower trendlines at least twice – but ideally three times. A lack of open space within the triangle is ideal. Breakouts often occur in the final 1/3rd of the triangle. Volume typically falls before the breakout.

I believe that understanding the psychology of how this pattern forms is essential. The symmetrical triangle is the result of a condition that is very common in any traded market: consolidation. It’s not just common; it’s normal. Consolidation is representative of two things: equilibrium on the part of buyers and sellers and indecision by active speculators. The psychology of price action inside a symmetrical triangle is different than what occurs in an ascending or descending triangle, which both have a marked bias during the construction. Symmetrical triangles are the epitome of indecision, and traders can very quickly fall victim to whipsaws.

Symmetrical triangles, while the most common, are also the most confusing. Take the image below:

Symmetrical Triangle

The symmetrical triangle on the daily chart for the AUDJPY is a bearish pennant – a bearish continuation pattern. While any triangle that forms after an established trending move has a high probability of pushing the price in the direction of the trend, it doesn’t always happen that way. As I wrote above, symmetrical patterns are inherently neutral – so it is important to watch them. We can see that this symmetrical triangle did not cause a continuation move south – it reversed. Regardless of the direction of the breakout, some rules should be applied when entering a trade based on a breakout of a symmetrical triangle.

Symmetrical Triangle - Long Entry
Symmetrical Triangle – Long Entry

First, unlike the ascending and descending triangles, we don’t enter on the break. We want to enter when price breaks the prior high (or low). For the chart above, we would enter long above the previous swing high that touched the downtrend line.

Symmetrical Triangle - Short Entry
Symmetrical Triangle – Short Entry

The short entry from a breakout below a symmetrical triangle is the inverse of the bullish entry. On the chart above, the short entry is when price moves below the prior swing low that tagged the uptrend line – not on the initial breakout.

Pullbacks and throwbacks occur 59% of the time. Symmetrical triangles are notorious for many false breakouts, so look for frequent wicks/shadows to pierce the trendlines. Dahlquist and Kirkpatrick wrote that volume that increases on the breakout increases the performance of the pattern, but it is otherwise below average in its performance.


Sources:

Kirkpatrick, C. D., & Dahlquist, J. R. (2016). Technical analysis: the complete resource for financial market technicians. Upper Saddle River: Financial Times/Prentice Hall.

Bulkowski, T. N. (2013). Visual guide to chart patterns. New York, NY: Bloomberg Press.

Bulkowski, T. N. (2008). Encyclopedia of candlestick charts. Hoboken, NJ: J. Wiley & Sons.

Bulkowski, T. N. (2002). Trading classic chart patterns. New York: Wiley.

Categories
Forex Price-Action Strategies

The Lesson We Learn from Such Price Action

In today’s article, we are going to demonstrate an example of a trade, which does not go according to the price action traders’ expectations. We try to dig out what goes wrong with the trade. Let us get started.

This is a daily chart. The chart produces an inside bar right at the level where the price had a rejection earlier. The buyers, according to price action trading, usually wait for the price to produce a bullish reversal candle around such levels. However, the buyers may remember an important point here that the bullish reversal candle is an inside bar. An inside bar is not known as a strong reversal candle. Nevertheless, it is a daily bullish reversal candle producing right at the level of support, so they daily-H4 buyers are to flip over to the H4 chart.

The H4 chart’s price action is bullish. The last candle comes out as a bearish pinbar. The price may consolidate soon. If that happens, followed by an H4 bullish breakout, buyers may go long on the pair. The next significant swing high is far, offering a tremendous risk-reward.

The price consolidates and produces a bullish engulfing candle breaching the level of resistance. The consolidation does not look an ideal one. Ideally, the buyers may trigger a long entry here. This is what we have been learning on daily-H4 chart trading lessons. Let us assume that we take a long entry here. Let us find out how the trade goes.

The next candle comes out as a bearish candle. It does not hit the stop loss, but it looks ominous. Since taking a loss is an unavoidable thing in trading, so we may let it go. This is what we have been learning, as well. Let us find out what happens next.

It hits the stop loss. As far as trading psychology is concerned, we must not let it take over us. However, with this trade, two things may hold many price action buyers back taking the entry.

  • An inside bar bullish daily reversal candle
  • Ugly looking consolidation

We have demonstrated on many occasions, an inside bar daily reversal candle with good-looking consolidation ends up offering a winning entry. On some lessons, an unusual consolidation but with a daily bullish reversal candle does the same. Over here, a combination of both ends up offering a losing entry. On some occasions, such price action (inside bar daily reversal candle and unusual consolidation) may end up offering a winning entry. However, to have better winning consistency, we may skip taking entry on such price action.


Categories
Forex Price-Action Strategies

An H1 Trading Strategy, A New Arrow in the Quiver

The H1 chart is one of the most traded charts in the Forex market. This is a very consistent chart considering other intraday charts. In today’s article, we are going to learn a strategy to trade on the H1 chart in the Forex market.

This is an H1 chart. The price after making a bearish move seems to have found its support. It produces two consecutive bullish candles. The buyers are to wait for the price to consolidate and create a bullish breakout to go long. On the other hand, the sellers are to wait for a bearish reversal candle and make a bearish breakout to go short on the pair. Let us find out what the price does next.

The chart produces a bearish engulfing candle, which is the strongest bearish reversal candle. The sellers have the upper hand here. A breakout at the level of support is the next thing to take a short entry here.

The price consolidates around the level of support. The level of support becomes double bottom support. A strong battle is going on between the buyers and the sellers. Traders must wait to find the next direction.

It makes an explicit bearish breakout. Admittedly, the sellers have outplayed the buyers. Traders shall get themselves ready to go short on the pair. The question is why they have to get themselves ready. Should not they trigger any entry right after the last candle closes? The answer is no. They must wait for the next candle to close below the breakout candle. This is the trickiest part of this strategy. Traders must wait for one more candle to make a new lower low (in a bearish market).

Here it comes. The next candle comes out as a bearish candle closing well below the breakout candle. An entry may be triggered right after the last candle closes. The stop loss level is easy to be found out. It is above the level where the trend initiates. We see that a red marked take profit level as well. However, the chart does not show that it is a significant level. How do we find this out then? We may set our take profit exactly with a 1:1 risk-reward ratio. It means the length of entry to stop loss equals to the length of entry to take profit in this strategy. Let us find out how the trade goes.

The trade goes well. We will demonstrate more examples of this strategy soon. Meanwhile, let us concentrate on the things to remember.

  1. The trend initiation candle is to be a strong reversal candle.
  2. The breakout is to be very explicit.
  3. The very next candle is to close below (in a bearish market) or close above (in a bullish market).
  4. Take Profit is to be set with no more than 1:1 risk-reward.
Categories
Forex Price-Action Strategies

Trading the ABC Pattern

In today’s lesson, we are going to demonstrate an example of an ABC pattern trading on a daily chart. The ABC pattern is one of the most consistent trading patterns in the financial market. It offers an excellent risk-reward as well as a high winning percentage. Let us get started.

This is a daily chart. The price after being bullish makes a bearish move. The last candle comes out as a doji candle. This is a bullish reversal candle, which is not a strong one. However, look at the level where the price produces the doji candle.

It is a flipped level of support. Technically, the buyers are to wait for a bullish reversal candle to go long around this level. Since this is not a strong bullish reversal candle, the buyers might as well wait for a bullish engulfing candle to go long from here.

Here it comes. This is a bullish engulfing candle closing above the last bearish candle. This means it produces a morning star. The buyers may trigger a long entry right after the last candle closes. This point is known as point C in the ABC chart pattern. Traders shall set their stop loss below the level of support. With take profit, they are to be tricky. The last swing high (or low) often becomes a big factor. Thus, buyers may consider taking a partial profit. Have a look at the chart below.

The price often roams around and even makes a reversal at this point. This point is known as point B. If we take out the 50% profit around this level and let the rest of it run, we give ourselves a chance to win more pips without any risk. If the price produces an ABC pattern, in 70% cases, it makes a new higher high or lower low. Let us find out what happens here.

The price makes a breakout. We have taken out some of our profits. Now, we may consider using a trailing stop setting below the last candle (breakout candle). We must be patient and hold the trade until the price produces a strong bearish reversal candle.

The price heads towards the North with good bullish momentum, and then it produces a bearish reversal candle. It may still head towards the North if it makes a bullish breakout after consolidation. Meanwhile, we may come out with the rest of the trade.

The price pattern is produced in almost all the pairs and in all time frames. It is one of the most common price patterns, which is favorite among the financial traders. To be able to trade and make money out of it, we need to have a lot of back-testing and practice.

Categories
Forex Price-Action Strategies

Edged Breakout Lessens Momentum and Chance of Winning

In today’s lesson, we are going to demonstrate an example of the daily-H4 combination trade, where the price produces a reversal candle, but it does not make an explicit breakout. The price heads towards the breakout direction after having more consolidation. It often happens. Thus, we need to get familiar with such price action. Let us get started.

Above, we can observe a daily chart. The last daily candle closes well below the last swing low. This is an explicit breakout. Let us now determine the level where the price may find its next support. The chart shows that the price closes within a swing low. However, the swing low one below may come as the next level of support. Have a look at the chart below.

The price may head towards the South and find its support at the red-marked level as far as the daily chart is concerned. The daily-H4 chart combination traders are to flip over to the H4 chart for the price consolidation and bearish breakout to go short on the pair.

The image above corresponds to the H4 chart. The chart produces a bullish corrective candle. If it produces a bearish candle closing below the last swing low, the sellers may trigger a short entry. Let us proceed to the next chart.

The chart produces a bearish engulfing candle. However, look at the breakout. It is not an explicit breakout. If the candle closed below the level of support with a 15%-25% extra red body, it would be an excellent entry. Nevertheless, it is a strong bearish reversal candle (bearish engulfing). A bearish engulfing candle in a bearish market makes a very strong statement that the sellers are in control on the minor charts. Let us find out what happens next.

The chart produces another bearish candle. Look at the last candle. It comes out as a bullish candle with a long upper shadow. The pair still looks bearish, but the bullish corrective candle goes too far up. It may be because of the bearish reversal candle that we have after the first consolidation. If it closed well below the level of support, it would have been bearish with more momentum. Often the price goes towards the opposite direction and hits the stop loss too in such breakout. Let us find out what happens here.

It goes according to the sellers’ expectations and hits the Take Profit. Here is a question. Would you take such entry next time? I would not blame if you say ‘yes.’ Because such trade may have a 55% chance of winning, however, to be very consistent and keep our confidence at the top level, it is better if we skip such entry.

Categories
Forex Price-Action Strategies

It is Better to be Safe than Sorry.

Using Stop Loss is an essential component of trade management. The Forex market gets volatile from time to time. Taking an entry without using Stop Loss may make an account empty. Thus, under no circumstances, we shall take any entry without using Stop Loss. We need to make sure that we set our Stop Loss accordingly, which is neither too tight nor too saggy. In today’s lesson, we are going to demonstrate an example of that.

The above chart is a daily chart. We see that the price finds its support and produces a bullish engulfing candle. The candle closes within the last swing high. The daily-H4 combination traders are to flip over to the H4 chart to take a long entry upon consolidation and bullish breakout. Let us have a look at the H4 chart.

The H4 chart looks extremely bullish. The chart produces a morning star right at the support zone and heads towards the North for one more candle. Traders are to keep an eye on the chart for the price consolidation.

The chart produces one more bullish candle. It then consolidates and creates a bullish engulfing candle breaching the last highest high on the chart. This is an ideal price action opportunity to trigger a long entry right after the last candle closes. Traders shall set the stop loss below the level of support, where the engulfing candle bounces.

The next candle comes out as a bearish candle approaching the Stop Loss level. However, if we set the Stop Loss below the support level, we would be safe here. Things do not look as good as we expected. Let us proceed to the next chart.

The next candle comes out as a bullish engulfing candle. Things look much better now. However, we must not miss the fact that the bullish engulfing candle has a bounce right at the Stop Loss level. If we set too tight Stop Loss, we would have to encounter a losing trade here. Instead of making the profit, we would lose money.

It is a debatable issue how far we shall set our Stop Loss. It is not recommended that we should set our Stop Loss too far. However, we shall set our Stop Loss below the level of support/resistance and add some extra pips. For intraday trading on the 5M, 15M, 30M, H1, and H4 chart, to measure the number of extra pips, we may use the spread of that particular pair. Let us assume we are taking a long entry on EURUSD. If the spread is three pips, we may add three extra pips to set our Stop Loss. We must do a lot of back-testing with our favorite pairs to find out the perfect measure for this to be safe with our entries. As they say, “it is better to be safe than sorry.”


Categories
Forex Price-Action Strategies

Breakout Confirmation Means a Lot

Breakout Confirmation Means a Lot


Price action traders count the breakout as one of their most essential trading components. There is another factor, which is directly related to a breakout: It is called Breakout Confirmation. A breakout is not considered as a perfect breakout on a particular chart if the breakout level does not hold the next candle. In today’s lesson, we are going to demonstrate an example of that.

Thie chart above is a daily chart. The chart shows that the price breaches the level of resistance. The candle closes above the level as well. Many traders consider it as a breakout. It is not a breakout yet on the daily chart. The price may have made a breakout on other minor charts such as the H4, H1, 15M, etc. However, to consider it as a daily breakout, traders must wait for the next daily candle to close above or within the breakout level. Let us have a look at the following daily chart.

The next daily candle comes out as a bullish pin bar and closes within the breakout level. It means that the breakout level holds the price and confirms the breakout. The price may head towards the North because of the breakout and breakout confirmation. The daily-H4 chart traders may flip over to the H4 chart for the price to consolidate and upside breakout.

The H4 chart shows that the price produces a bullish engulfing candle having a long upper shadow. However, the candle closes within the last swing high. The buyers shall wait for the price to consolidate and upside breakout.

The price keeps heading towards the North with an average bullish momentum. The last candle comes out like a spinning top, which is a sign of price consolidation. Let us proceed to the next chart to find out whether it consolidates more or makes an upside breakout.

It produces a bullish engulfing candle closing above the last swing high. The buyers may trigger a long entry right after the candle closes by setting stop loss below the consolidation support. Let us find out how the entry goes.

It goes well. It goes towards the North further even after producing a little bearish candle. Ideally, some buyers may come out with their whole trade there, and some traders may take partial profit. This is another issue. We shall concentrate on the breakout and the breakout confirmation. Since the daily pin bar candle’s body closes within the breakout level, it suggests that the trend is still with the bull. If it closes below the breakout level, things would have been different. Such things matter a lot in the Forex market and traders must consider those.

Categories
Forex Daily Topic Forex Price-Action Strategies

An Entry Derived From an Unusual Consolidation

Price action traders love to see the price consolidates and makes a breakout towards the trend direction. Consolidation offers better risk-reward as well as a better chance of winning a trade. In today’s lesson, we are going to demonstrate an example of a consolidation, which is rather unusual. Let us proceed.

This is a daily chart. The chart shows that the price produces a bullish engulfing candle at a flipped level of support. The daily-H4 chart combination traders may flip over to the H4 chart for the price to consolidate and a bullish breakout to go long on the pair. Let us flip over to the H4 chart.

The H4 chart shows that the price heads towards the North by producing bullish candles consecutively. The buyers shall wait for the price to find its support, consolidates, and makes a bullish breakout. Let us proceed to the next chart.

The chart produces another candle, which has a bullish body. In naked eyes, it is a bullish candle, but it is not. It is an Inside bar, which closes within the level of resistance. Let us have a look at the next chart.

The next candle has a little bullish body as well. Many traders may think that the price is still with the bull. Do not get trapped here. The candle closes within the level of resistance again. The price has not found its support yet. However, it has been on a tricky consolidation.

Look at the last candle, which closes above the level of resistance. The price bounces at the level where the first candle (Inside Bar) bounced. Since a bullish engulfing candle breaks the level of resistance, technically traders may trigger a long entry right after the candle closes. Let us proceed to the next chart to find out how the trade goes.

The price keeps heading towards the North for two more candles. As it seems, it may go towards the North further. An unusual consolidation and an explicit breakout seem to work wonderfully well for the buyers here. We usually see that price consolidates by producing bearish candles on a bullish market and vice versa. In this example, we have seen that the price may consolidate by producing inside bars as well. An Inside bar/s may confuse us. It may make us think the price is not on consolidation. Now we know consolidation sometimes may look different. However, it works as well as usual consolidation.

Categories
Forex Daily Topic Forex Price-Action Strategies

Need the patience to Manage Trade by Taking Partial Profit

Partial profit taking is a handy feature that Forex traders often use. Since the Forex market is very volatile, traders take out a portion of profit and let the rest of the trade run to get them more pips. Traders need to have patience, though, if they want to manage the trade by taking a partial profit. In today’s lesson, we are going to demonstrate an example of partial profit-taking and find out the importance of having patience.

This is a daily chart. The price produces a bullish harami right at the level where it bounces earlier. The daily-H4 combination traders are to flip over to the H4 chart to find out long opportunities. Let us flip over to the H4 chart.

The H4 chart looks fantastic for the buyers. The first candle comes out as a bullish engulfing candle followed by another bullish one. The price consolidates and produces a bullish reversal candle as well. The buyers are to wait for an H4 breakout at the resistance to trigger a long entry.

The price comes down to find its support and heads towards the North to make the breakout. Look at the breakout candle, which is a good-looking bullish candle with long lower shadow. The buyers have been waiting for this. It is time to trigger a long entry.

The price keeps heading towards the North after triggering the entry. The last candle comes out as a strong bullish candle, so the buyers let their trade to go along. Let us proceed to the next chart.

The chart produces a bearish reversal candle. The price may go up to the black marked level. It means that the price has enough space to travel and offer a handful of pips. The price may make a bearish move from here as well. What do the buyers do here? They may take out a portion of the profit. They may take out a 50% profit and leave the stop loss where it is. It will allow them grabbing more pips if it keeps going towards the North. If it does not, they will not lose a dime.

The price gets caught within a bullish rectangle. Do not forget that it has been a long time that the buyers were sticking with their trade. They have been very patient. The price still does not make an upside breakout. It might go either way. Let us proceed to the next chart.

At last, it makes a breakout at the first rectangle. It consolidates again with several candles and makes another bullish breakout. Eventually, it hits the level. Traders have grabbed more pips by taking a partial profit. However, we must not miss the part that they are to be extremely patient. Taking a partial profit may help us be more consistent in making a profit, but we now know what we have to put in to do it accordingly.


Categories
Forex Daily Topic Forex Price-Action Strategies

Do not Mix up, Stick with the Rules

In today’s lesson, we are going to demonstrate an example of an H4 chart offering an entry. The daily-H4 chart combination traders are to keep an eye on the daily chart first. Once the daily chart produces a daily reversal candle from the support/resistance zone, they are to flip over to the H4 chart to take an entry. Today, we are going to do it in another way for a reason. We are going to start monitoring from the H4 chart. Let us start. Soon you will know why I am doing it so.

This is the H4 chart, and the red-marked level is daily support. It shows that the price is at the level of support. The last candle comes out as a bearish candle with a long lower shadow. It suggests that the level may produce a bullish reversal soon.

As expected, the chart produces a bullish engulfing candle right at the level of support. A bullish engulfing candle at a support zone has a strong message to send to the buyers that it is their territory.

The price goes towards the North for one more candle. It then has a correction and produces another bullish engulfing candle closing above the resistance. This is an ideal sequence for the price action traders to take a long entry. Let us assume that we do not trigger an entry here and have a look at the next chart.

The price keeps heading towards the North. It means that we have missed an opportunity to make some green pips here. Everything seems perfect, but why we skip taking the entry. Is it a mistake? Is not it? No, it is not a mistake. We shall not take the entry as far as the daily-H4 chart combination chart is concerned. We have started monitoring the chart from the H4 chart today. The daily-H4 chart combination traders are to monitor from the daily chart. Let us have a look at the Daily chart how it looks before flipping over to the first H4 chart here.

You see that the last daily candle comes out as a bearish one. It closes within a level, which has the potential to hold the price as a level of support. However, it has not produced a bullish reversal candle yet. Thus, they shall not flip over to the H4 chart. This is the reason that the daily-H4 chart combination traders may not take the above entry. The H4-H1 chart combination traders may not get an entry here as well since the level of support is not H4 support. The price does not react to the level on the H4 chart in recent times.  It moves towards the North by obeying other trading methods but not according to the price action chart combination trading.

We must be disciplined and must not mix up one strategy with others but stick with the rules. Sticking with the rules is one of the most important factors to be consistent in trading.

Categories
Forex Daily Topic Forex Price-Action Strategies

Consolidation and Breakout: The Two Key Movements in Price Action Trading

Price action trading mainly relies on consolidation, trend, and breakout. Reversal candle is another feature that traders keep an eye at. Typically, double top/bottom, morning star/evening star, and engulfing candle are considered the strongest reversal signal. However, even an inside bar may create an excellent bullish/bearish momentum if the price consolidates and makes a perfect breakout. In today’s lesson, we are going to demonstrate an example of this.

We are looking at an H4 chart. It shows that the price heads towards the North with extreme bullish momentum. A bearish inside bar followed by another bearish candle makes a reversal. The price after being bearish may have found its support. The buyers are to wait for the price to make a bullish breakout at the level of resistance. The sellers are to wait for consolidation and a bearish breakout at the level of support.

The price starts having a correction. If it keeps going towards the North further, it may get choppy. If it finds its resistance nearby, the sellers may find an opportunity to go short on the pair.

The chart produces a bearish engulfing candle. It means the price finds its resistance. If it makes an H1 breakout at the level of support, the sellers may want to trigger a short entry. Let us now have a look at the same chart with those two levels.

The equation gets much simpler with those two levels. Since this is an H4 chart, the sellers are to flip over to the H1 chart to get a breakout and trigger a short entry. The reversal candle looks strong enough to make the sellers keep an eye on the pair to take a short entry upon a breakout.

This is how the H1 chart looks. The price seems to have found two levels of support here. However, the H4 chart looks very bearish, which may keep driving the price to make a breakout at the level of red marked support.

Here comes the breakout. The candle closes well below the level of support. It has a long lower shadow, but it has a thick bearish body as well. The sellers may trigger a short entry right after the candle closes by setting stop loss above the resistance. Take profit may be set at the last swing low on the H4 chart. Let us proceed to the next chart to find out how the entry goes.

The price heads towards the South with good bearish momentum. It makes another bearish breakout at the last swing low as well. Concisely, the sellers grab some green pips from the entry.

If we concentrate on the first candle of the trend, we see that the candle is a bearish inside bar. An inside bar is considered the weakest reversal signal. However, it produces an excellent short signal here because of perfect consolidation and the breakout. The above example signifies the importance of consolidation and breakout in price action trading.

Categories
Forex Price-Action Strategies

Choppy Daily Chart, H4 Chart Still Offering an Entry

In today’s price-action lesson, I am going to divulge an example of the daily-H4 chart combination offering an entry. Usually, it is best to trade on the daily-H4 chart combination when the price is having a solid trend on the daily chart. However, not all the time the price is going to have a strong trend on the daily chart. The price action may be trapped within zones and still offer an entry.

The daily chart shows that the price has been roaming around within two levels. The last candle comes out as a bearish engulfing candle. The candle forms at the resistance zone. The level of support is not too far away. Let us have a look at the same chart with those two levels.

The chart shows that the price may find its next support at the red marked line. The price had a bounce at the level earlier. As far as the daily chart is concerned, the price does not have enough space to travel towards the South. However, the daily-H4 chart combination traders may have another equation to play with. Let us flip over to the H4 chart and find that out.

The H4 chart shows that the price heads towards the South with extreme bearish pressure. Traders are to wait for consolidation and bearish breakout to go short on the pair. The selling pressure is too high to consolidate though. Then again, the sellers must not give up. Let us find out what happens next.

The price starts having the correction. It may find its resistance nearby and offer a short entry upon a bearish breakout. On the other hand, if the price goes too far towards the North, the risk-reward factor may hold the sellers back to go short.

The price goes towards the North for one more candle and produces an H4 bearish engulfing candle closing below the level of consolidation support. The last candle looks to be a fantastic signal candle and the price still has some room to travel towards the South. Let us have a look at the same chart with consolidation support and resistance.

The equation gets much simpler with those two lines. A short entry may be triggered right after the last candle closes by setting Stop Loss above consolidation resistance. Take Profit may be set at the last swing low or wait until a bullish reversal candle on the H4 chart. Let us find out what the price does after triggering the entry.

The price heads towards the downside with good bearish pressure. The last H4 candle comes out as a bullish Inside Bar. The sellers may want to close the entry here.

We have seen that as long as the daily chart’s support/resistance offers a lucrative risk-reward for the H4 traders, they may be able to find entry occasionally even though the price is not having a strong trend on the daily chart.

Categories
Forex Price-Action Strategies

The H4-H1 Chart Combination Keeps You Busy Even in a sluggish Market

Usually, the Forex market gets sluggish in December. It gets tough for traders to find out a good entry on major charts as far as price action is concerned. However, the H4-H1 chart combination still offers a few entries. In today’s lesson, we are going to demonstrate an example of an entry based on the H4-H1 chart, which was offered in mid-December 2019.

Let us proceed.

We’re looking at the H4 chart. The last candle makes a strong breakout at the last swing low. Traders are to wait for consolidation and H1 breakout to go short on the pair. Let us find out whether it starts consolidating from right there or comes further down.

It comes down further for one more candle. It means traders are to wait longer. However, the nearest support is far enough. Thus, the price has a lot of space to travel towards the South.

The price starts consolidating and produces two bullish candles consecutively. The pair is to make a big decision from here. Does it continue its journey towards the North, or does it find its resistance nearby? Let us find out from the next chart.

The price finds its resistance and produces a bearish engulfing candle. The sellers have been waiting for this. It is time for the traders to flip over to the H1 chart and wait for an H1 bearish breakout to take a short entry. Let us find out how the H1 chart looks.

The H1 chart shows that the price produces an engulfing bearish candle and heads towards the South. The price on this chart makes a breakout at the red marked support level. It may make the traders wait for, or it may make a breakout straightway. Let us what the price does here.

The price makes an explicit bearish breakout. The breakout candle looks very strong, barely having a lower shadow. A short entry may be triggered right after the candle closes by setting Stop Loss above the level where the H4 chart produces the bearish reversal candle. Let us now find out how it ends.

The price heads towards the South with good bearish momentum. It produces a bullish engulfing candle having a long upper shadow. It may be time for the sellers to close the whole entry since it is the month of December.

As mentioned, in December, traders do not get as many entries as they usually get. However, the H4-H1 chart combination may offer a few entries occasionally even when the market gets sluggish.

Categories
Forex Daily Topic Forex Price-Action Strategies

Daily-H4 Combination – Rather Mechanical than Emotional


In today’s article, we are going to demonstrate an example of a daily chart, which after having a bounce at Double Bottom support heads towards the North. However, the question is whether the daily-H4 chart combination traders find an entry or not. Let us find this out.

The chart shows that the price has had several bounces at the level of support. Without any doubt, it is a strong level of support, in which buyers would love to keep an eye on the price action around this level. A bullish reversal candle around this level, like the last one, would make them flip over to the H4 chart to go long upon breakout. We are not flipping over to the H4 chart right now. You find out the reason in a minute.

The price on the H4 chart may have consolidated but never made any breakout on the following day. The candle is called Bearish Harami. Usually, it attracts buyers. However, the daily resistance is not too far, so the buyers may not be interested in buying the pair on the daily chart.

As expected, intraday sellers pushed the price down. Then, a bullish engulfing candle forms right at the level of support. The daily-H4 combination traders are to flip over to the H4 chart. Let us flip over to the H4 chart and find out how it looks.

The chart looks bullish, but the momentum is not there. The level of resistance is far enough, which suggests that there are still some pips for the buyers to grab. The buyers are to wait for consolidation and an upside breakout to go long on the pair.

The next candle comes out as a bullish candle too. The price has covered some distance. This means the price is offering less number of pips. However, if it consolidates from right there, the buyers would still be offered a good risk-reward. Let us proceed to the next chart.

The price keeps heading towards the North. It does not offer an entry. Moreover, it even makes a breakout at the level of resistance. This means the level of support has been working with command. Matter of regret, the daily-H4 chart combination traders have not been able to take an entry in such a strong bullish market.

When things go like this, it annoys us. This is obvious. After all, we are the human being, not a machine. The thing is we often have to deal with things like a machine in the Forex market. It is hard and needs someone to be mentally strong. Whatever it is, we must work towards it.


Categories
Forex Price-Action Strategies

Daily-H4 Timeframe Combination – The Market Sometimes Makes You Wait More Than You Think

In today’s lesson, we are going to demonstrate an example of an entry derived from the daily-H4 combination. Usually, the daily-H4 combination does not take that long to offer an entry once the price makes a breakout on the daily chart. In today’s example, things are a bit different. Let us find out how it starts and ends.

The figure above shoes the daily chart. After a strong bullish impulse, the price action gets choppy for several days. Do you notice anything here?

The price gets caught within a rectangle. Since it has been choppy for quite a while, it makes some traders think not to keep the pair on their watch list.

There is a saying in price action trading “the more it ranges, the harder it breaks’. Thus, the next breakout may be a very strong one.

The breakout candle looks good. However, it is not that strong a breakout as we have expected. Nevertheless, it is a valid daily breakout, so traders are to flip over to the H4 chart to take a long entry.

The figure above shows the H4 chart. The price has been heading towards the North with an average bullish momentum. Traders are to wait for the price to find its support and make an upside breakout to offer them a long entry.

The price keeps being choppy on the H4 chart as well. It neither has consolidated nor produced a bullish reversal candle on which buyers could take a long entry. It has instead been within another bullish rectangle. This time it is, of course, an H4 bullish rectangle. Let us proceed to find out which way it makes its next breakout.

The price makes an upside breakout again. A bullish engulfing candle with long lower shadow makes the breakout. The buyers have been waiting for it, so a long entry may be triggered right after the candle closes. The Stop Loss shall be set below the rectangle support. There is no visible swing high. This suggests that the profit taking should be managed manually.

The plan has worked wonderfully well. The price goes straightway towards the North with extreme bullish momentum. The buyers may trail their Stop Loss in the middle of the big candle or at least above the breakeven point. As it has been going, it may keep pushing towards the North further. Let us find out what happens next.

The chart produces a bearish reversal candle. It is an Inside Bar, but it is time for the buyers to close the entry.

The price takes so long to make a breakout on the daily chart. It also takes a long time to offer entry on the H4 chart as well. This situation does not happen frequently, but sometimes it may occur. Thus, traders are to be mentally prepared for it.

Categories
Forex Price-Action Strategies

H4-H1 Combination – An Opportunity Missed Just for an Inch

The H4-H1 is an action-packed combination. By drawing support/resistance on the and upon getting a reversal candle on the H4 chart, an entry is triggered considering H1 price action. However, things do not always go according to our expectations. In today’s lesson, we are going to demonstrate an example of an H4-H1 combination and find out whether it offers us entry or not. Let us get started.

This is the H4 chart. The chart shows that the price after having a rejection at a strong resistance zone heads towards the downside with extreme bearish pressure. The support zone is strong too. The last three candles are bearish, but they suggest that selling pressure may have decreased off a little. The last candle is a Spinning Top.

The combination of the last three candles ends up producing a Morning Star. This is one of the strongest bullish reversal candle combinations. The buyers are to flip over to the H1 chart for consolidation and H1 breakout candle to go long on the pair. Let us flip over to the H1 chart.

This is how the H1 chart looks. The chart produces several bullish candles consecutively, which suggests that it is the buyers’ territory. The resistance level is far enough to offer a lucrative risk-reward to the buyers as well.

Here it comes. The first candle for consolidation comes out as a bearish engulfing candle. Let us find out whether the price finds its support nearby or it heads towards the downside further.

It seems that the price may have found its support. It produces a Spinning Top again. If a bullish engulfing candle breaches the level of resistance, it will be an A+ buying signal. If another bullish candle breaches the level from where the last candle closes, it will be a good buying signal as well but may have relatively less buying pressure than the engulfing one. In both cases, the buyers are to calculate that the signal candle does not go too far up. Let us find out what happens next.

A very good-looking bullish Marubozu candle breaches the resistance. The buyers may want to trigger a long entry right after the candle closes. Would you trigger a long entry here? I let you think for a minute.

If yes, then you might have missed the line “In both cases, the buyers are to calculate that the signal candle does not go too far up.” It does, and it leaves only a little space for the price to travel towards the resistance. The risk-reward is not lucrative here at all.

An entry where almost everything looks perfect, we may still skip taking that for not fulfilling just one condition. It may frustrate us to some extent, but we have to deal with it professionally.

Categories
Forex Price-Action Strategies

Be Patient and Observant, You Will be Paid Back

Price action traders are to be extremely observant to find out entries. Charts sometimes may seem not to offer an entry soon. However, if traders are sharp, they will be able to find out entries from the charts that may look choppy or dead for the price action traders. In today’s lesson, we are going to demonstrate an example of that.

After being very bearish, the price gets caught within a rectangle. The price action has been choppy, and it does not seem like that the chart is going to offer an entry. Many traders may want to skip eying on the chart to find out an entry. Can you sniff something out of it? Have a look at the chart below.

With a bit of adjustment, we can draw horizontal support as well as resistance. Look at the last bullish engulfing candle. It forms right at the support level, where the price had bounced twice earlier. That was on the daily chart. The daily-H4 combination traders may want to look for long opportunities here. Since the resistance is not far away, let’s wait for a daily breakout.

Here it comes. The next candle breaches the level of resistance and closes well above the resistance level, so it is an explicit breakout. The buyers, then, must wait for consolidation to get a level of support and to set their stop loss below that level.

The next candle comes out as an Inside Bar closing within the breakout level. This fact must excite the buyers and make them wait to get a bullish engulfing candle to trigger a long entry.

This has been a copybook price action, which price action traders dream of. The last candle engulfs the previous candle. The buyers may want to trigger a long entry right after the candle closes. Stop loss may be set below the flipped support.

This is how the chart looks after triggering the entry. The way the price has been heading, it may keep going towards the last swing high. However, by locking some profit, the buyers are to keep an eye on the chart.

The chart produces an Inside Bar. It still favors buyers. However, traders are to make a decision here. They either close the whole entry or take out at least 50% profit and let the rest of it run. This is part of trade management. However, the lesson we have learned from here is we are to be patient and extremely observant to be able to find out entries. If we are observant, we will be able to find out entries even from the charts that do not look that good.

Categories
Forex Price-Action Strategies

It’s Not Only the Levels, but It’s also about Zones

We keep talking about support, resistance, and their levels. Sometimes we forget that it is not only about the levels. A lot depends on their zones. No doubt, in the end, we are to calculate their levels at the time of taking an entry. However, we are to keep an eye at the zones where the price may create a new trend. In this article, we are going to demonstrate an example of that.

This is a daily chart. The chart shows that the price upon finding very strong support heads towards the upside. It may have found its resistance as well, which pushes the price towards the downside. Take note that the level of support is extremely strong, which creates a secure buying zone.

The price tried to find its support at the last swing high. However, it breaches the level and comes further down. It produces an Inside Bar. It looks good for the sellers so far. Let us proceed to the next chart to find out what the price does.

The price consolidates with several candles. Look at the last candle. This is an engulfing candle which states that buyers on the minor time frames are confident enough to push the price towards the North. The resistance is far enough. Thus the daily-H4 chart traders are to flip over to the H4 chart to find out a long opportunity.

This is the H4 chart. The chart produces a Spinning Top. A bullish reversal candle, along with a breakout at the resistance, will be the signal to go long. Let us find out from the next chart whether it consolidates more or produces the bullish reversal candle.

It produces an H4 bullish engulfing candle as the reversal candle. It has an upper wick, but the body looks good enough to attract the buyers. A long entry may be triggered right here. Let us find out how the price heads with the bull. Do not forget it may go another way around, as well.

It goes towards the buyers’ desired direction. The buying pressure has been good as well. However, the last candle comes out as a bearish engulfing candle. It may be time for the buyers to close their entry.

The Bottom Line

We have demonstrated an example that the price creates a new trend, not right from the last level of support. It instead creates it from a support zone. Traders are to keep an eye on the price action around the support/resistance zone to be able to find out more entries.

Categories
Forex Price-Action Strategies

Risk-Reward and Its Impact on the Price Behavior

Risk-reward is an essential factor in price action trading. When the price makes a breakout and produces a signal, the first thing traders are to calculate is risk-reward. It does not matter how the price heads towards a direction, significant higher high and lower low are to be calculated. These are what determine risk-reward. In today’s lesson, we are going to demonstrate an example of how risk-reward may have an impact on the market.

The above chart is a daily chart, in which the price action produces a Double Top along with an Inside Bar, and its neckline is not too far. The sellers are to wait for a breakout at the neckline and go short on the pair. Let us flip over to the H4 chart.

The H4 chart produces an Inside Bar as well as the reversal candle. However, the price heads towards the neckline with good bearish momentum. If the price makes an H4 breakout, the sellers may go short up to the last swing low on the H4 chart. The daily support, however, lies a bit further down.

The price is right at the neckline level. It is at a critical level since the last candle closes right at the neckline level. It could go either way from here. Let us see which way it heads.

A massive breakout takes place here. However, look at the last swing low. The price is adjacent to it. This means risk-reward is not lucrative at all. Traders must not sell from here on this chart.

It makes a breakout, which is fantastic. However, the black marked level is daily support. The sellers may take a short entry from here, but that is on the H4-H1 chart combination.

As expected, the price heads towards the daily support, and it produces a bullish reversal candle. It made such a strong bearish move, but the daily-H4 chart combination traders have not found any entry because of the risk-reward issue. If the daily-H4 combination chart traders found an entry, the bearish move would have been more consistent. Let us find out what happened next.

The price heads towards the level sellers were waiting for the price to make a breakout at first. This one is another inconsistent move on this chart. That means an inconsistent move may bring another inconsistent one. To sum up, we could conclude by saying that the risk-reward factor may make the price inconsistent to some extent.

Categories
Forex Basic Strategies Forex Trading Strategies

Trading False Breakouts Like a Professional Forex Trader

Introduction

Often there are times in the market when the price breaks a certain significant level, and most of the novice traders immediately jump into the market. But, suddenly, the price reverts quickly, stopping out these traders or putting them in a losing position. Most of the experienced traders would have exited their positions when they realized they are trapped by the big whales like industry or institutional traders.

But beginner traders often become the victims of these false breakouts, and it affects their psychology as well. They will start doubting their trading strategies, and the fear element will surpass their confidence. Instead of falling into the negative state of mind, traders should learn how to use these false breakouts to their advantage so that they can profit from it. In this article, let’s discuss how to trade the false breakouts properly.

Most of the traders often consider false breakouts as a negative thing in the market. The general perception is that, by trading the false breakouts, they are taking the unnecessary risk, or it is not the correct way to trade. Some traders also believe that simple breakouts are more comfortable to trade. It is true, but simple breakouts won’t provide a great risk-reward, and also, it is not a consistent way to trade the market. On the other hand, successful & experienced traders see the false breakout logically and consider it as an opportunity to make some quick profits.

There are a lot of ways to trade false breakouts. Some traders trade them in conjunction with indicators, and some use it with trend lines and support resistance. In this strategy, we will show you the most appropriate way of trading false breakouts.

Trading the false breakout by using the major S&R levels

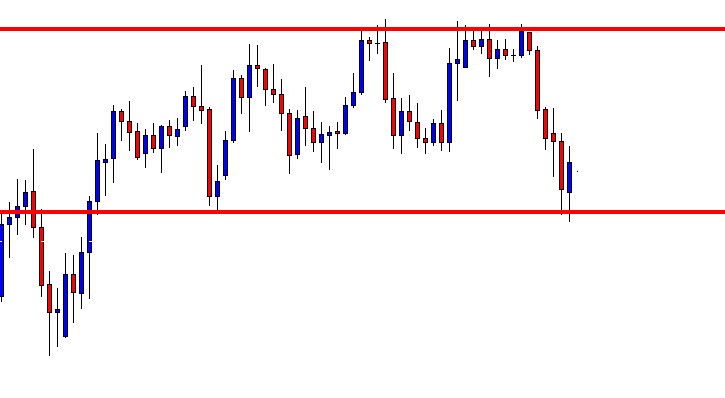
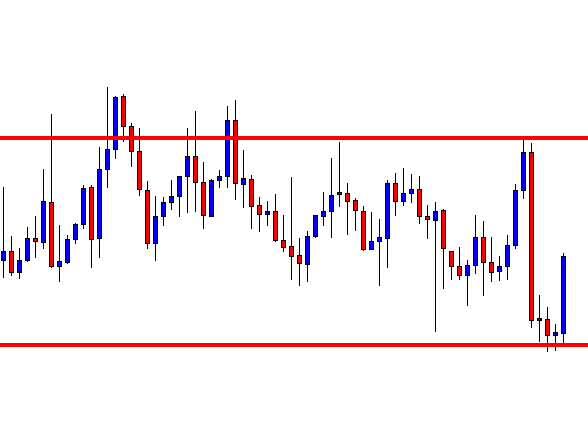
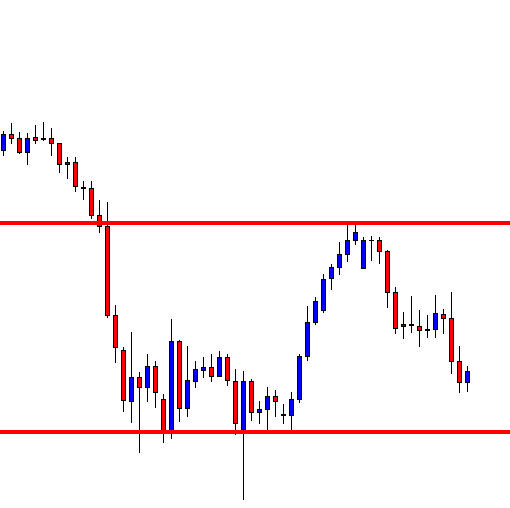
False breakouts occur in all types of markets, such as Forex, Stocks, Futures, and Options. They also occur in all kinds of market conditions. But the critical thing to remember is that every false break out is not worthy enough to trade. Always consider trading the false breakouts by following the trend of the market. That is, if the trend is up, look for the buy-side false breakout and in a downtrend, look for sell-side false breakouts.

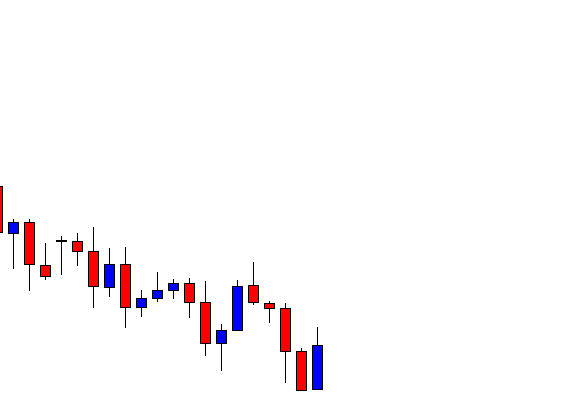
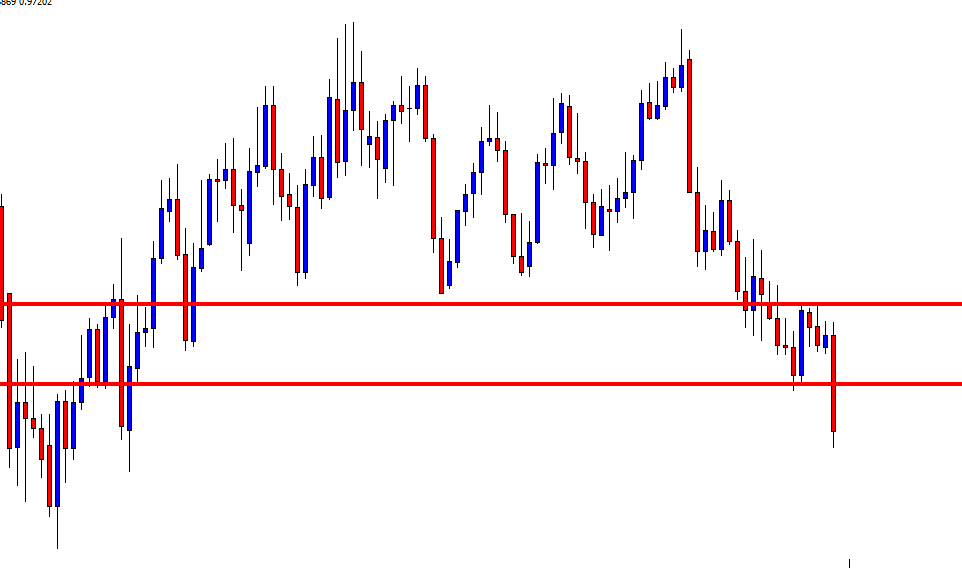
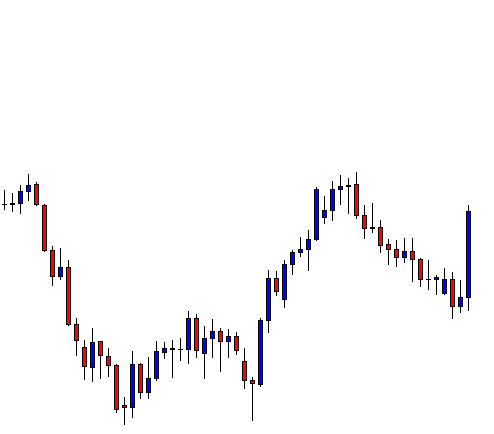
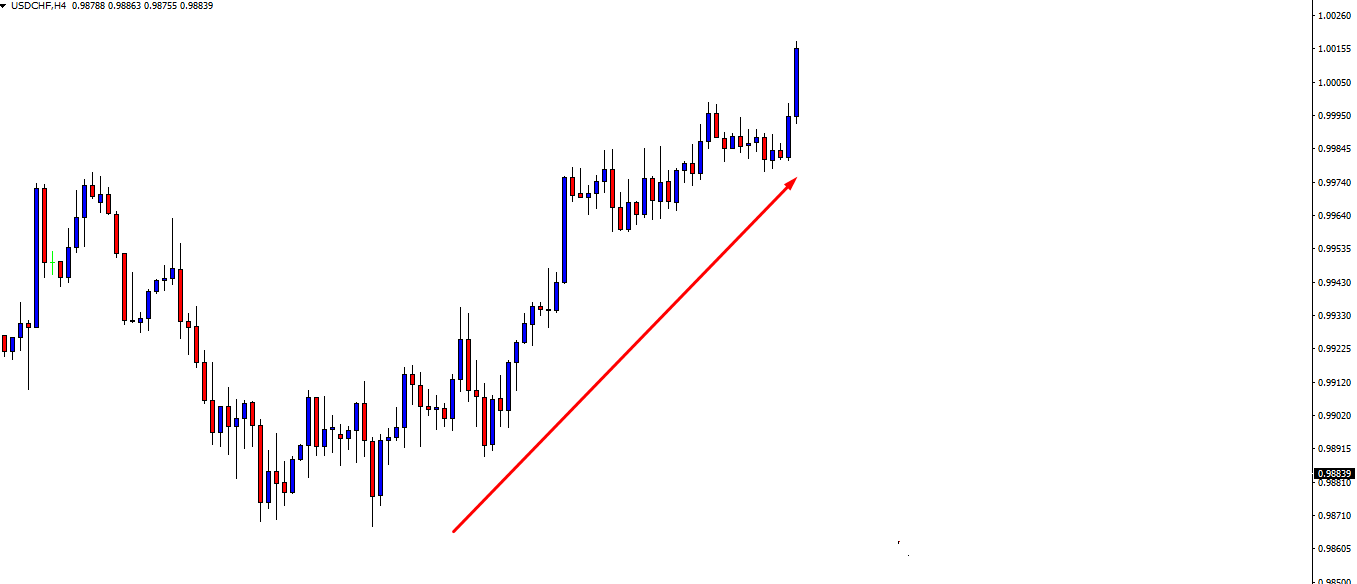
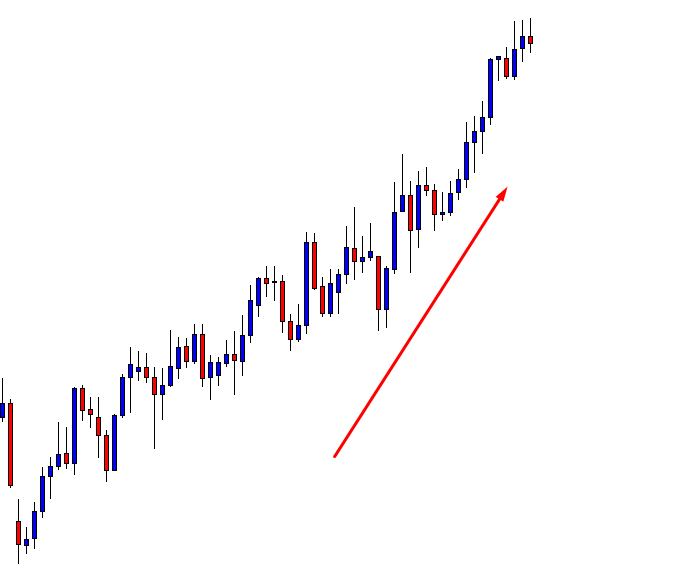
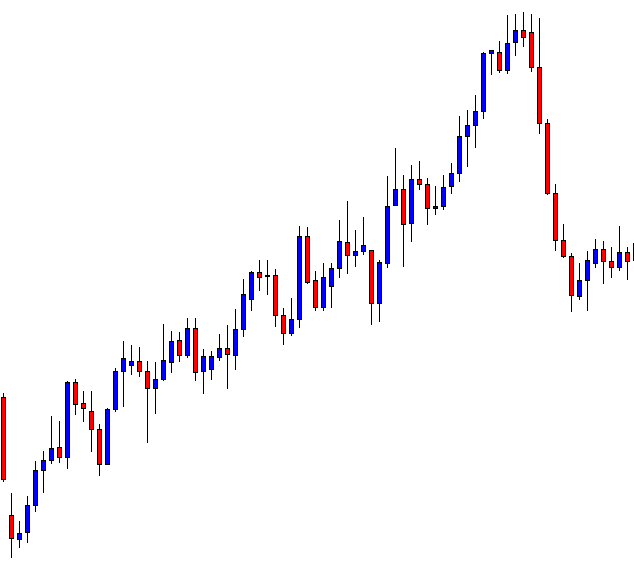
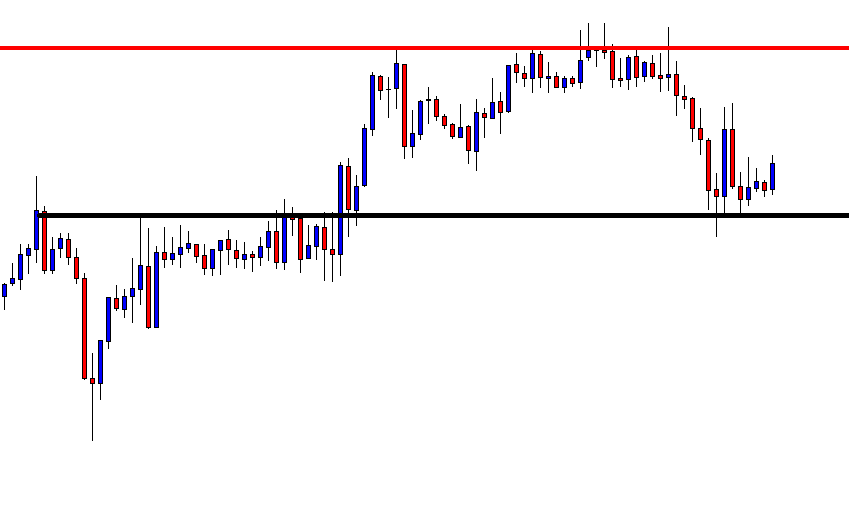
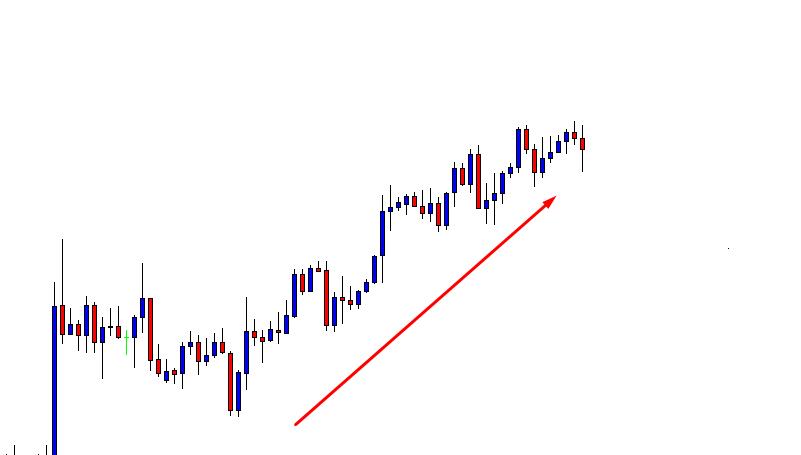
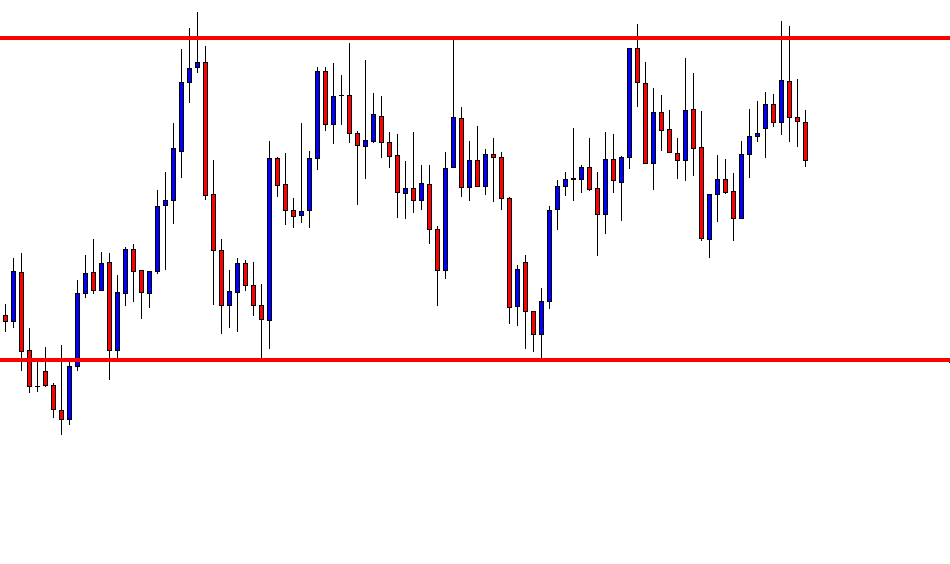
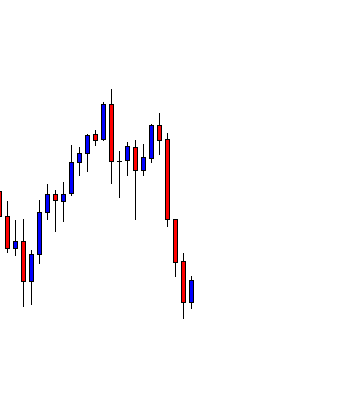
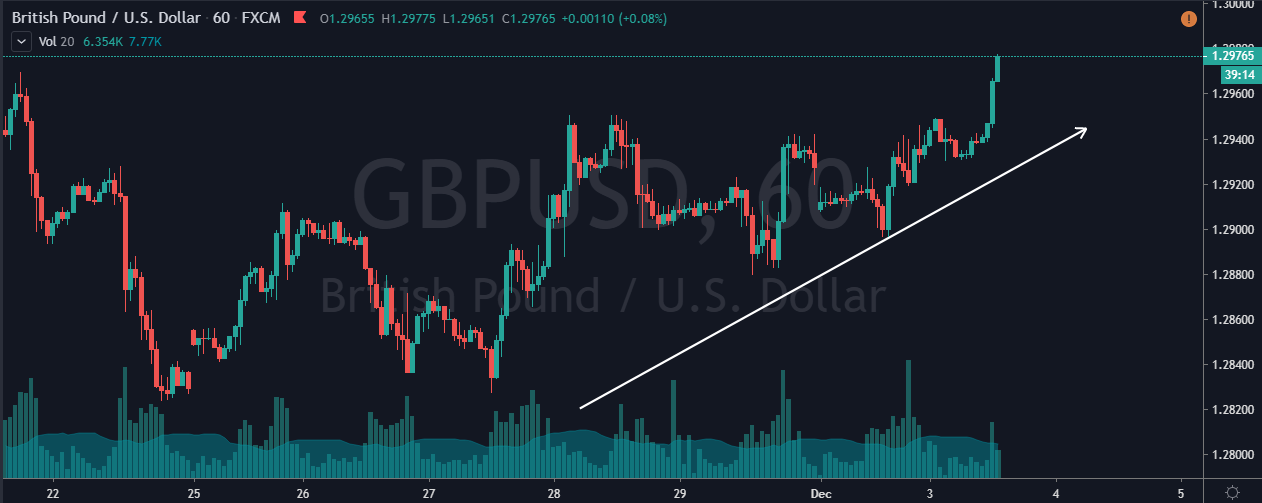
Step 1 – Find the trend of the higher timeframe

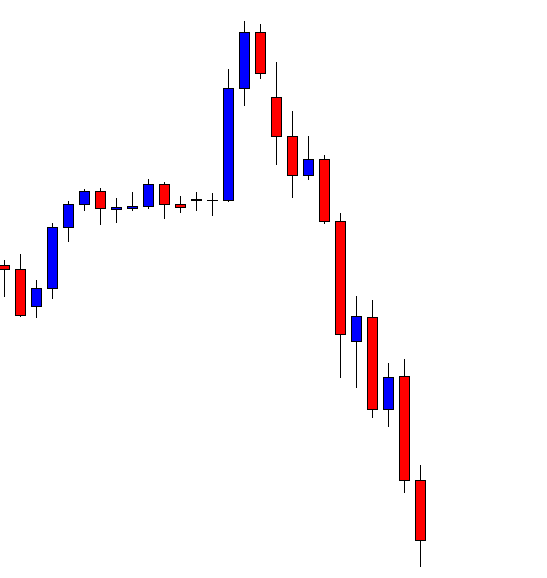
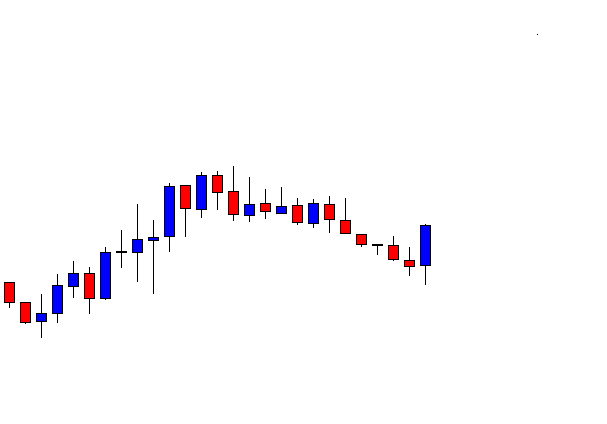
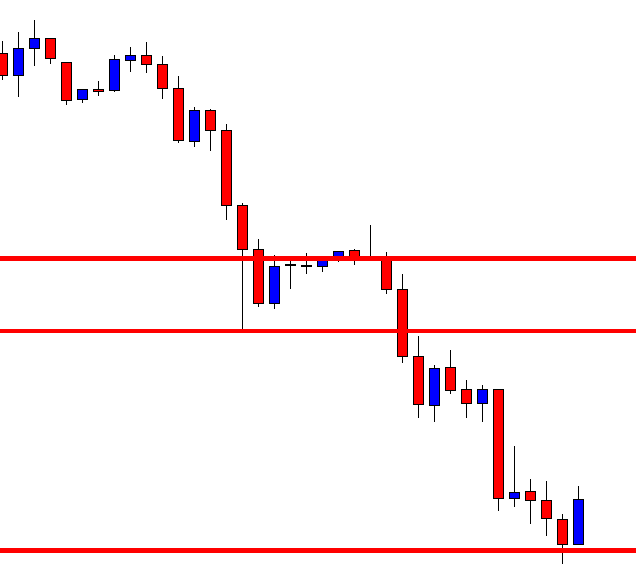
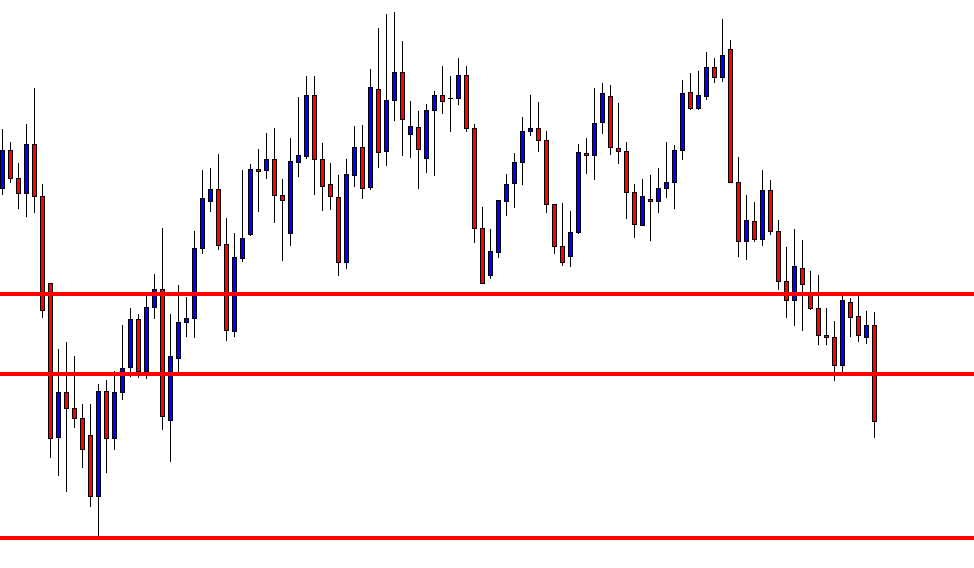
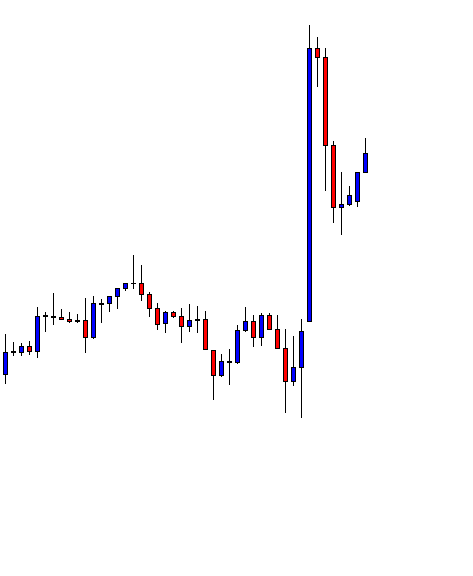
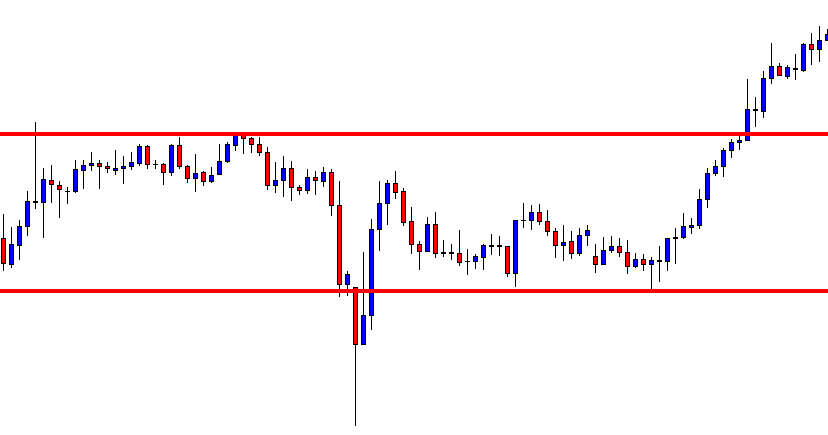
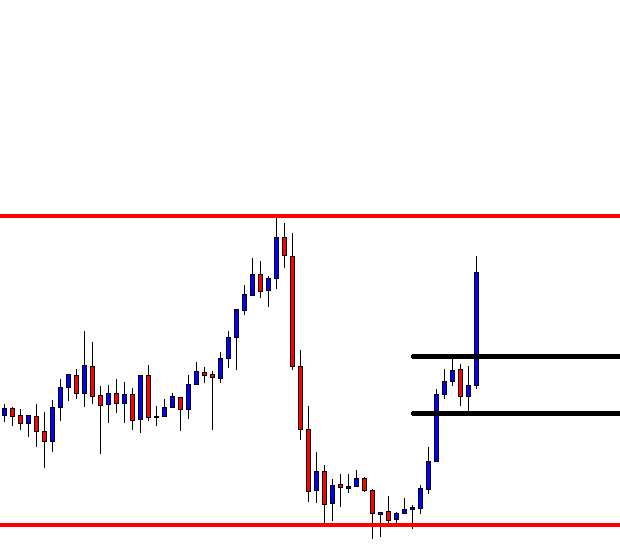
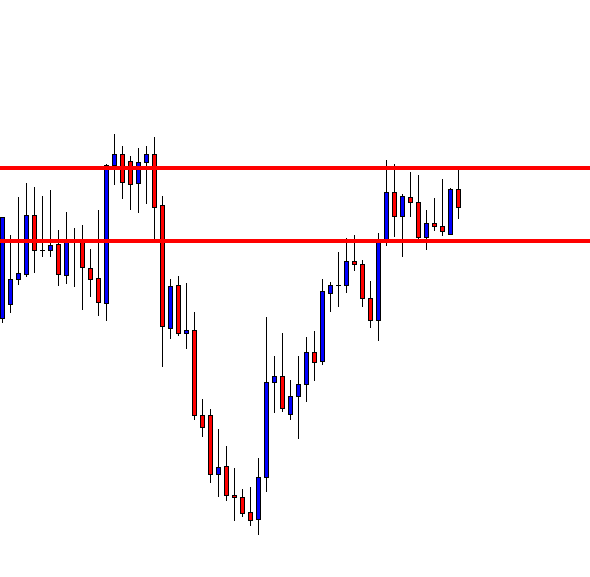
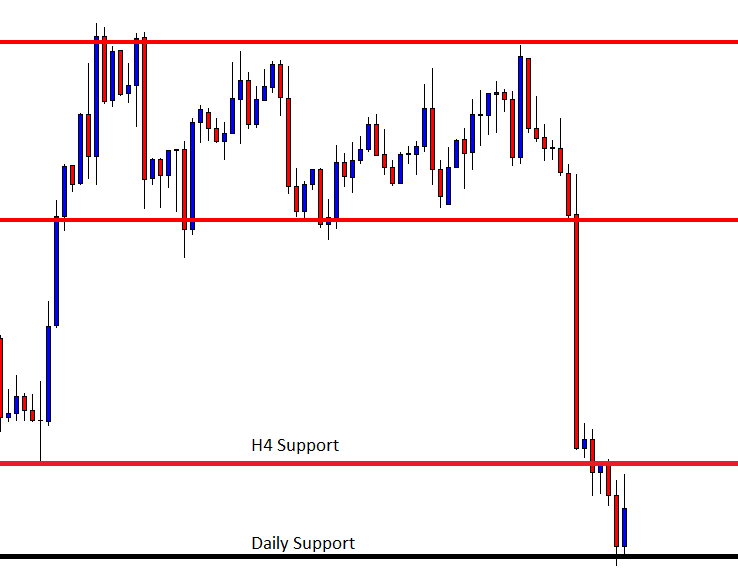
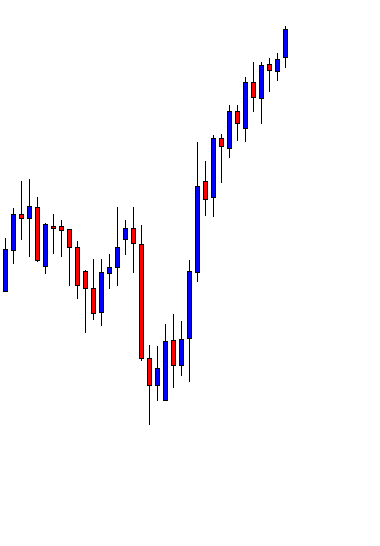
This step is simple yet crucial because we need to confirm the trend of the market. Keep in mind that most of the lower timeframes always follow the direction of the higher timeframe. To explain this strategy, we are examining the uptrend of the GBP/USD forex pair.

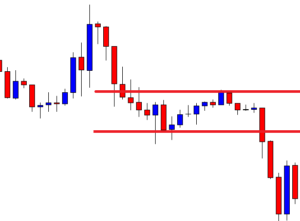
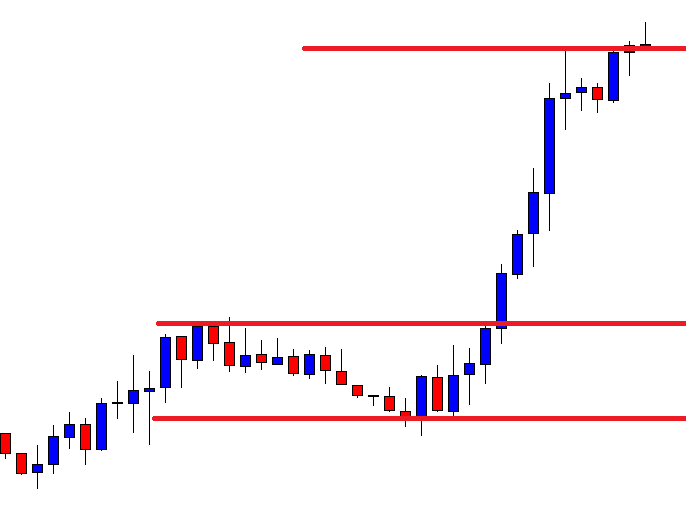
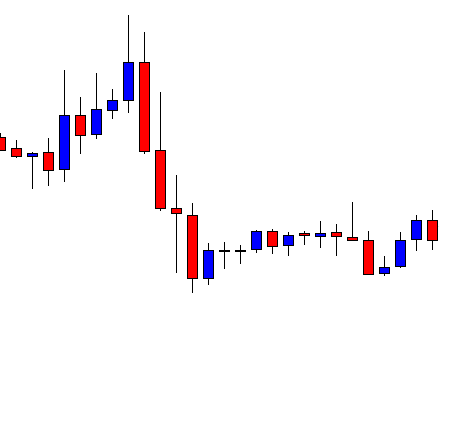
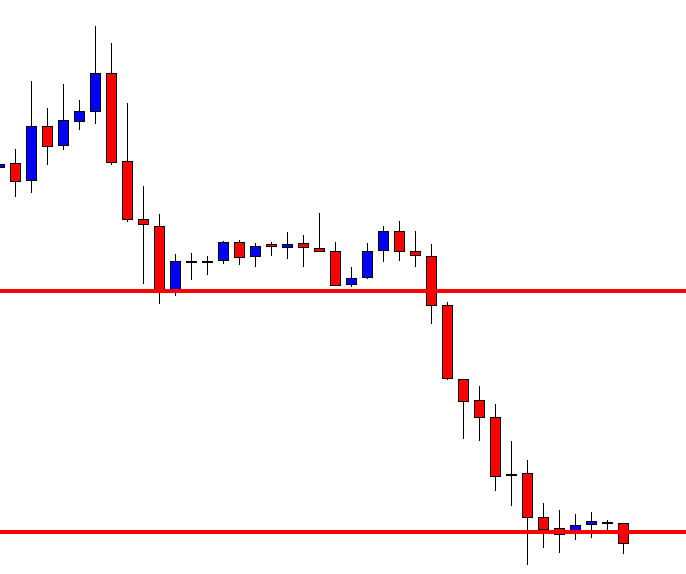
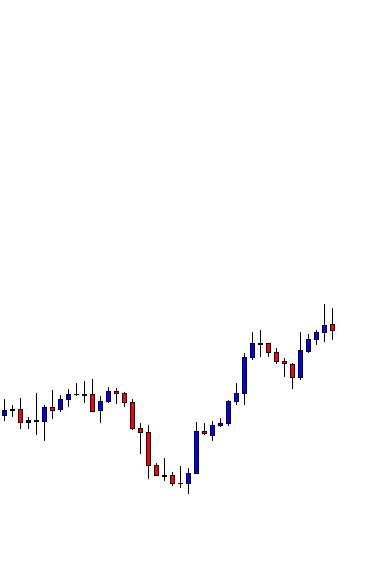
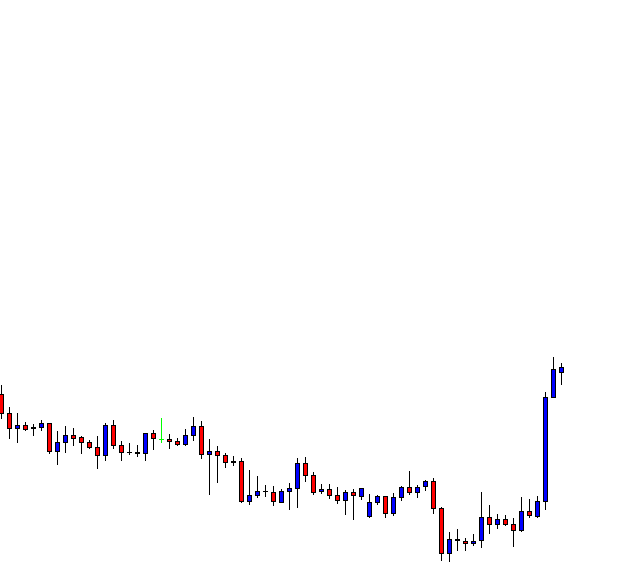
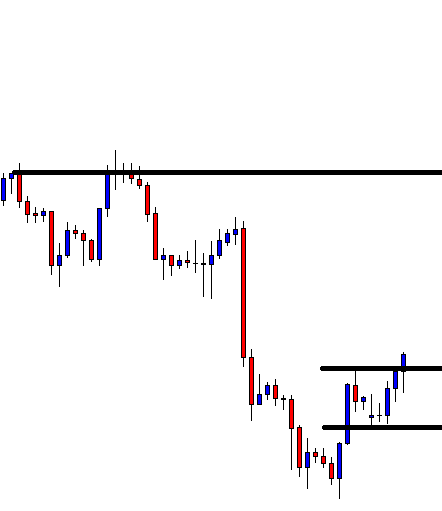
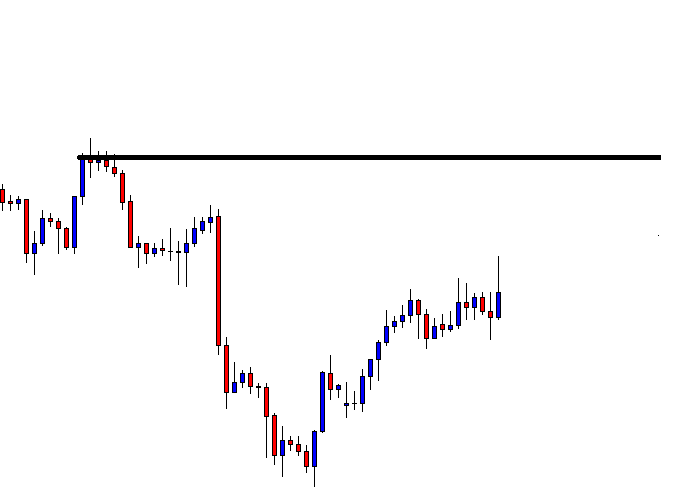
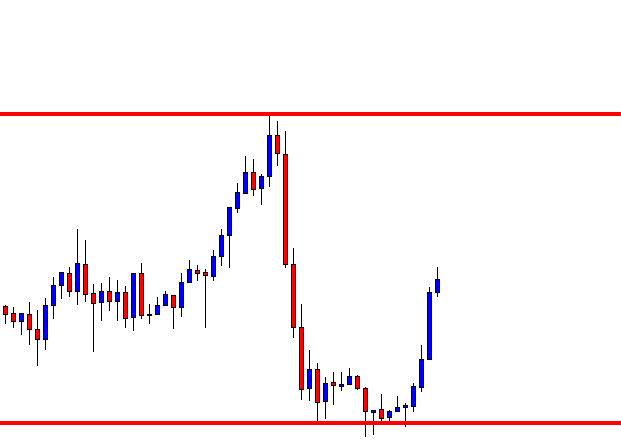
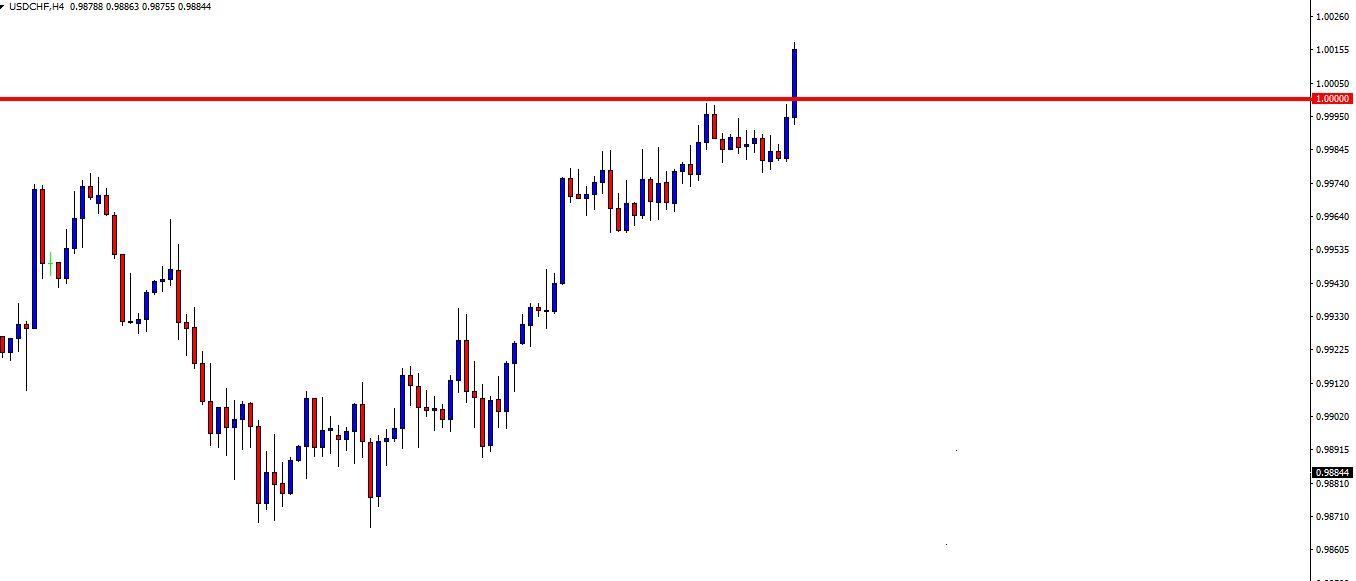
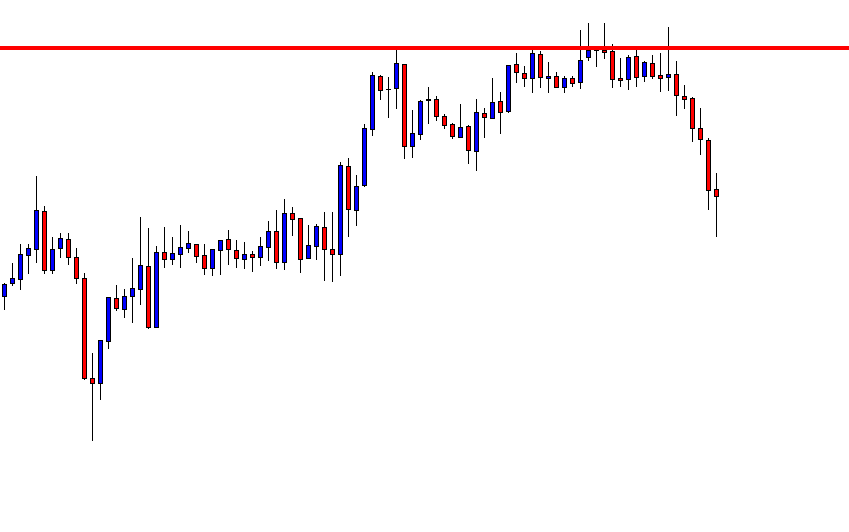
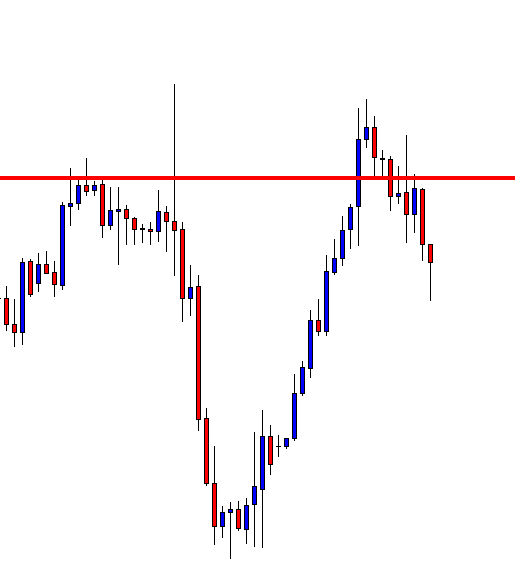
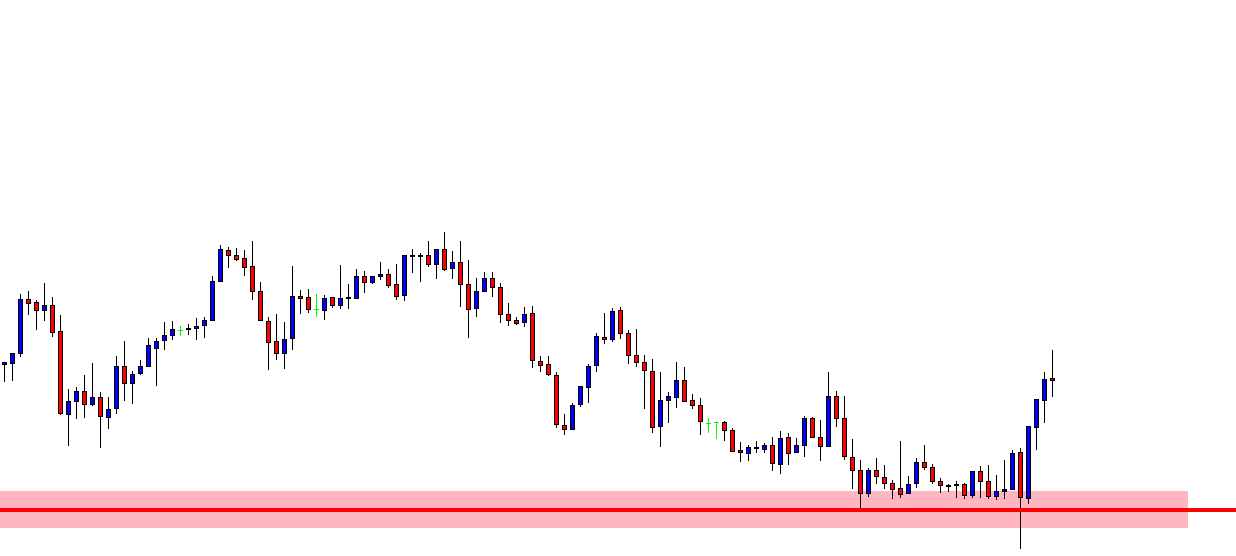
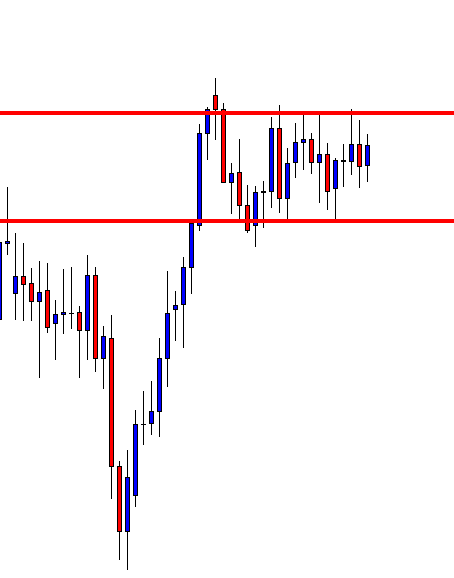
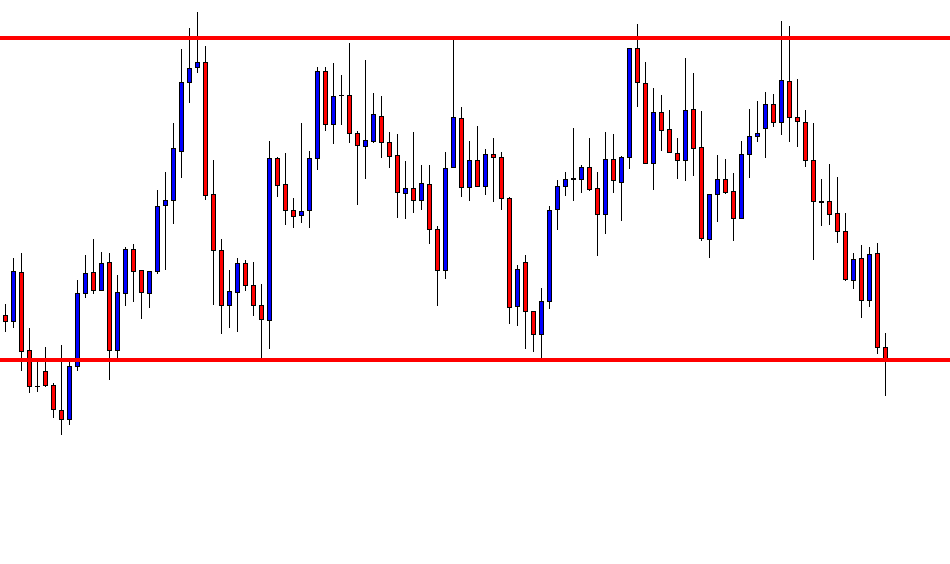
Step 2 – Look for the significant S&R in the lower timeframe

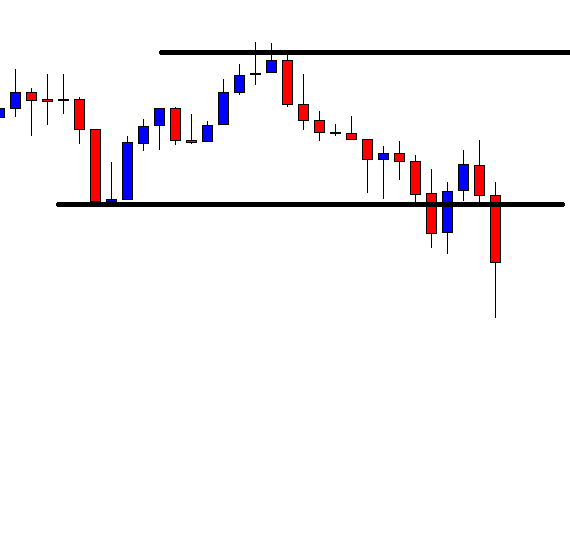
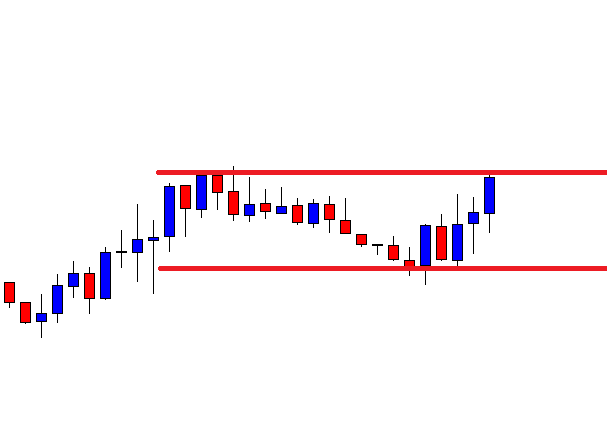
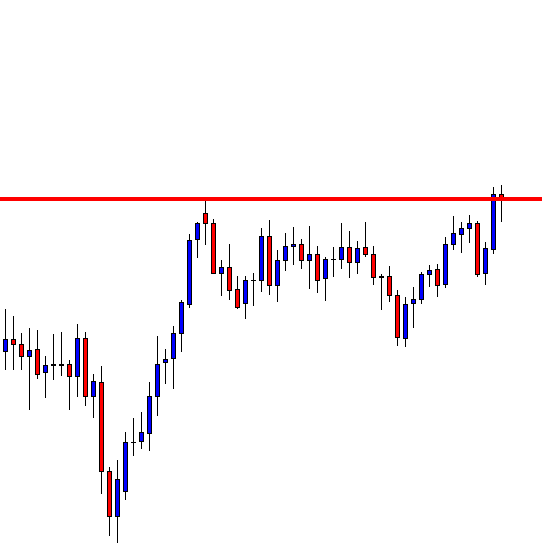
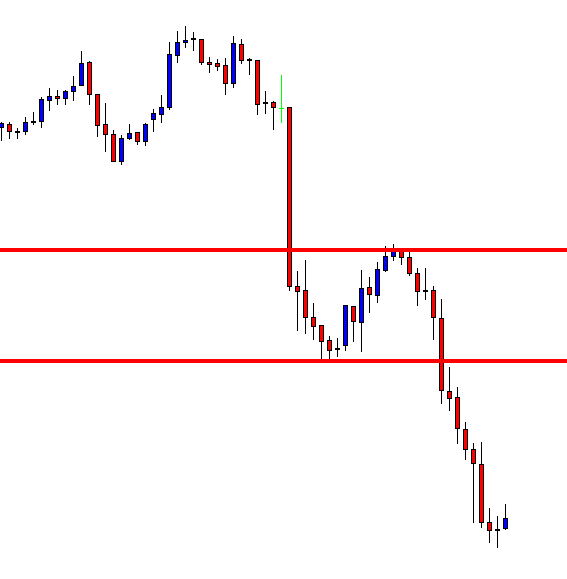
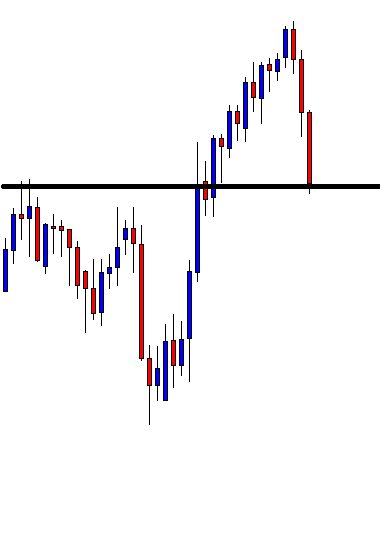
Most of the false breakouts occur near the support and resistance level. The reason brokers and market movers use these levels is to manipulate the market as is these areas act as a significant supply-demand zone. This makes it easier for the bigger players to fill more orders.

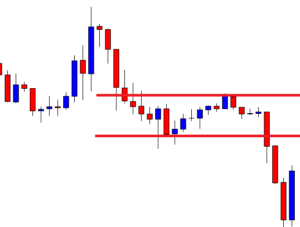
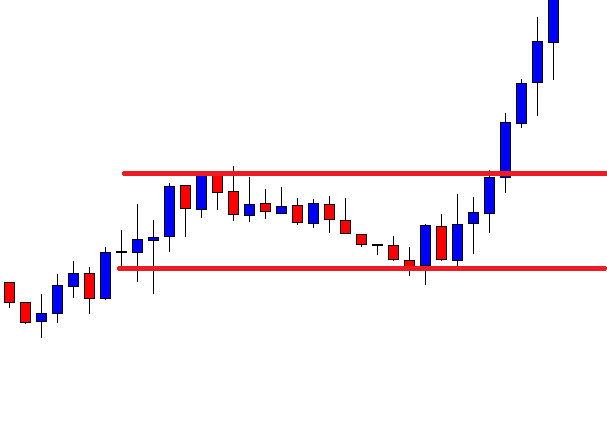
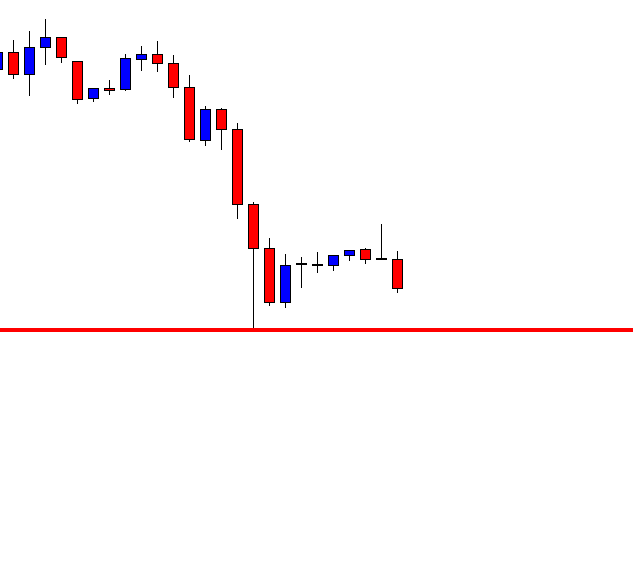
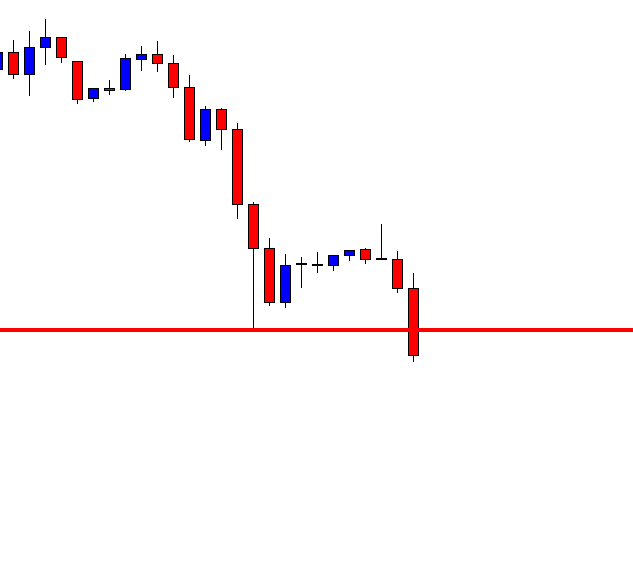
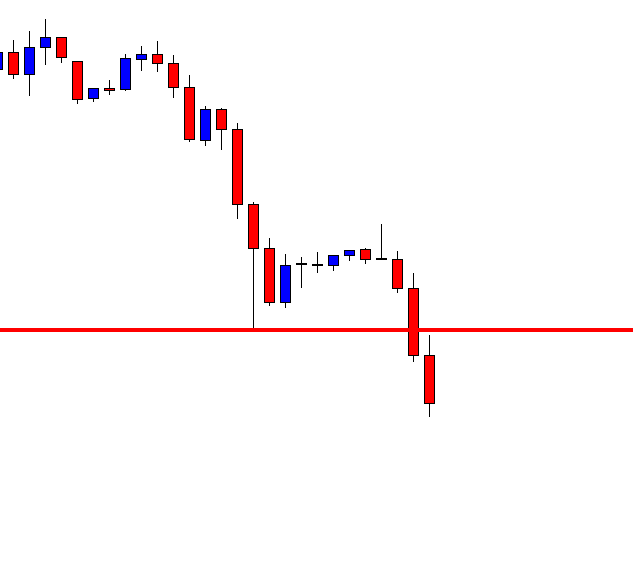
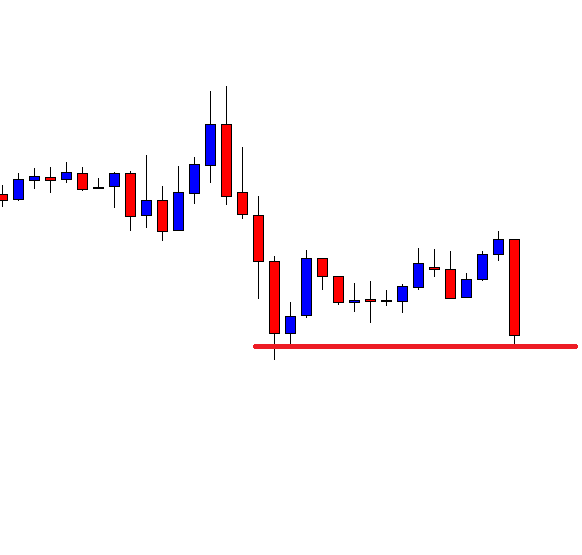
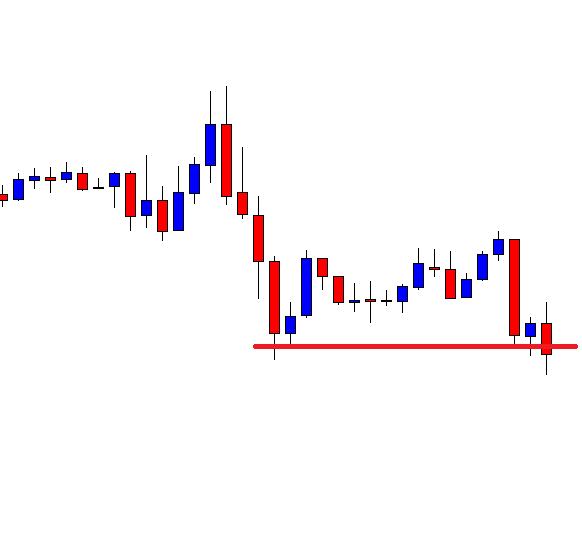
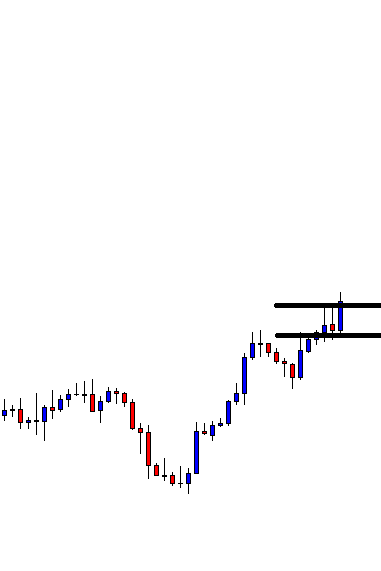
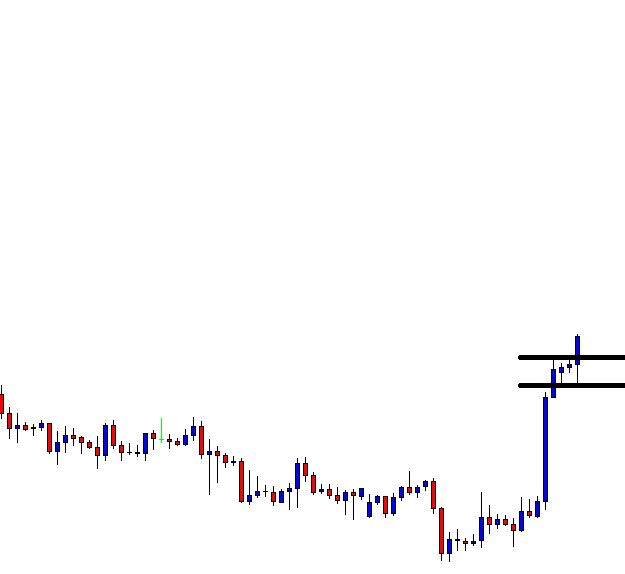
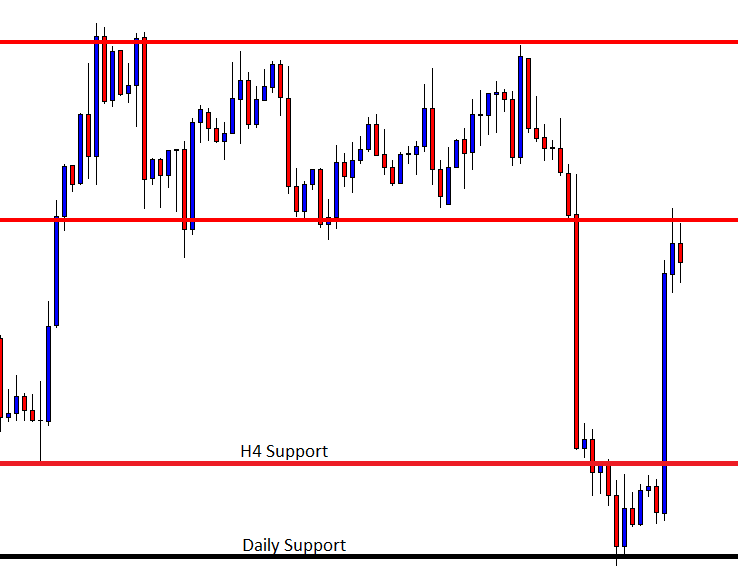
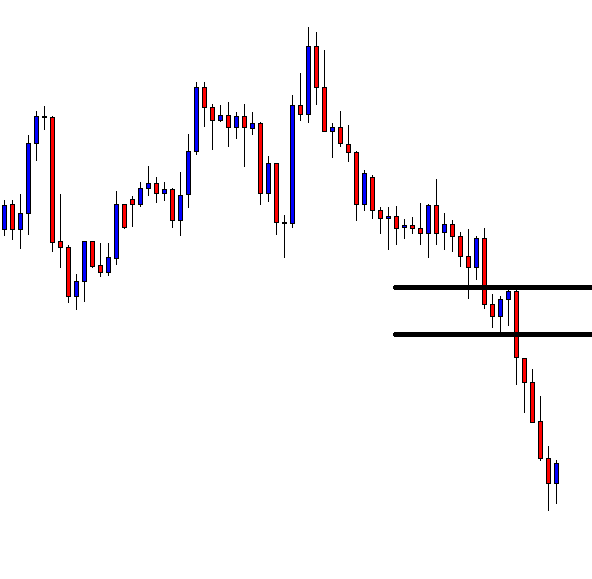
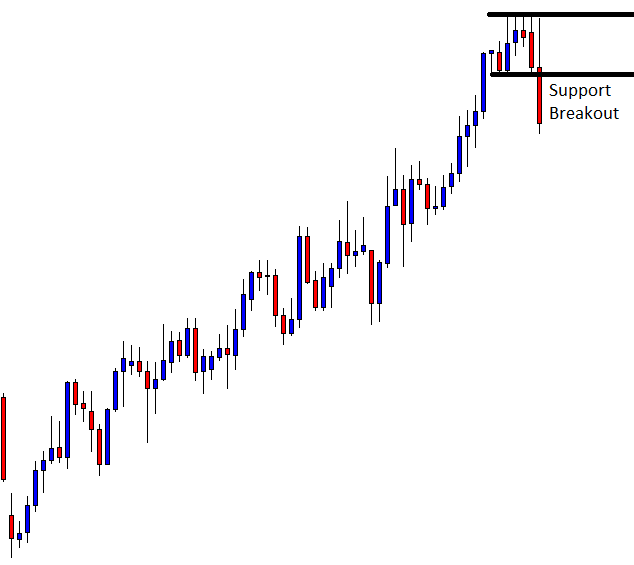
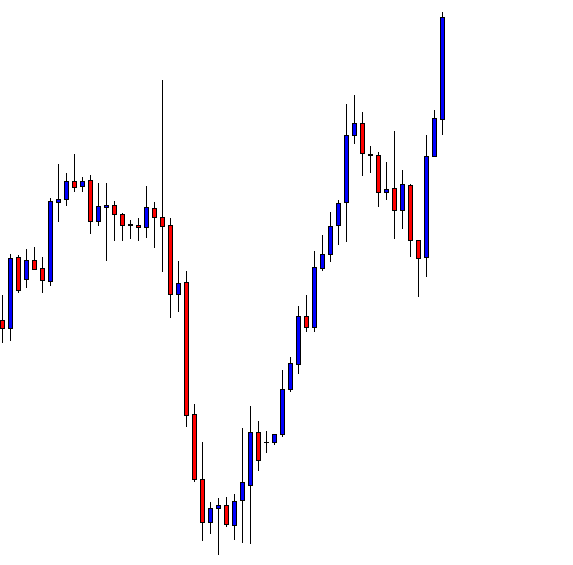
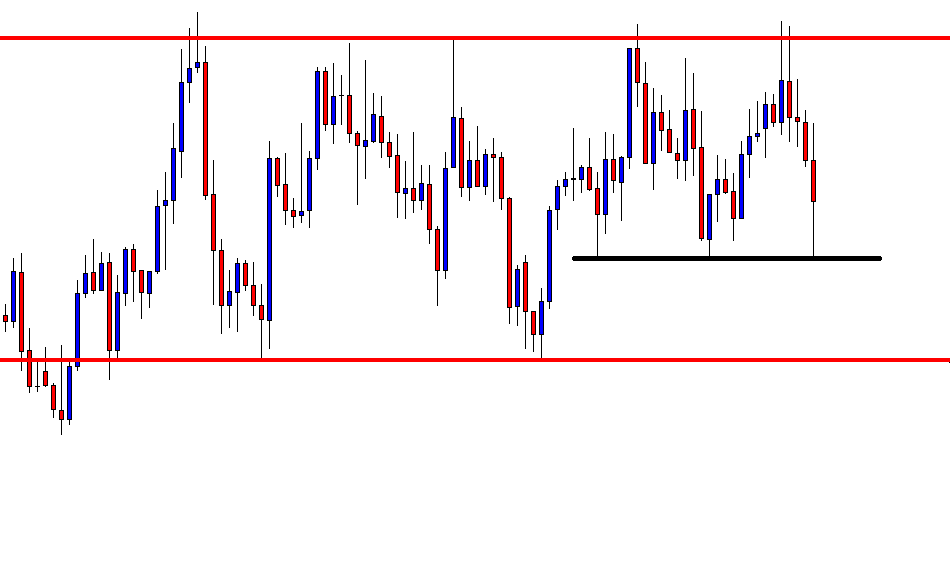
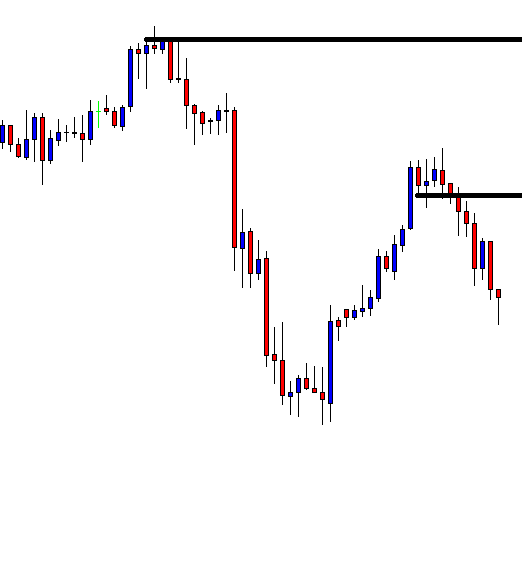
Step 3 – Look for the false breakouts at the S&R level

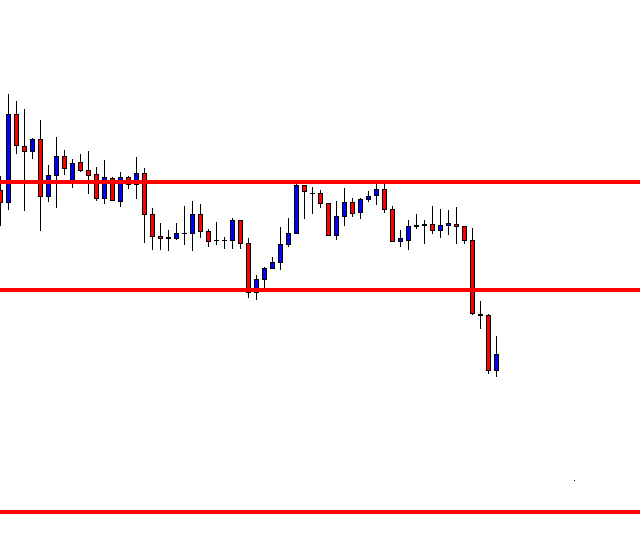
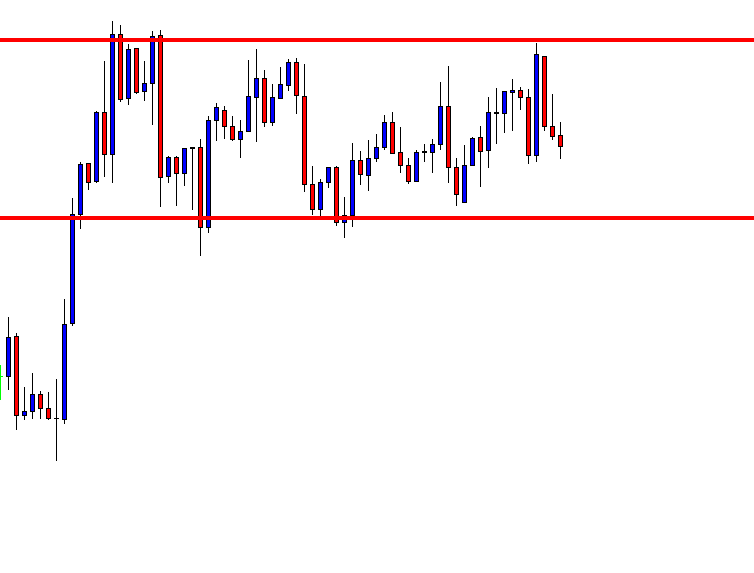
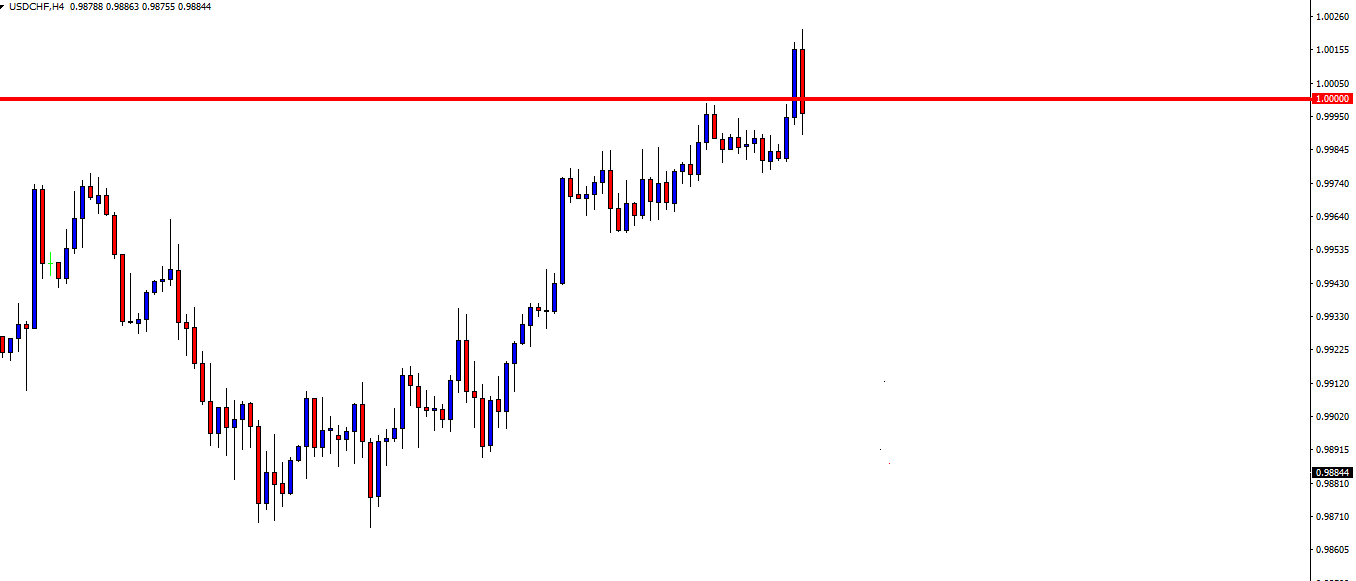
As we know by now, most of the false breakouts happen at major support resistance area. A trader can set the alarm on the price chart to see when the price action is at a major level. When the price breaks these levels, wait for the false breakout to trade the market.

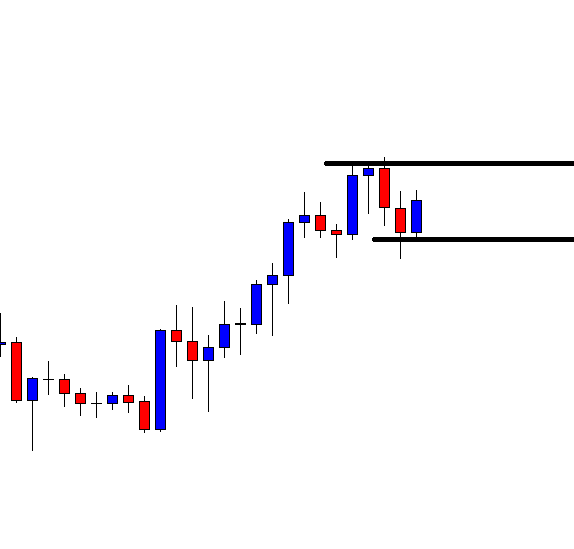
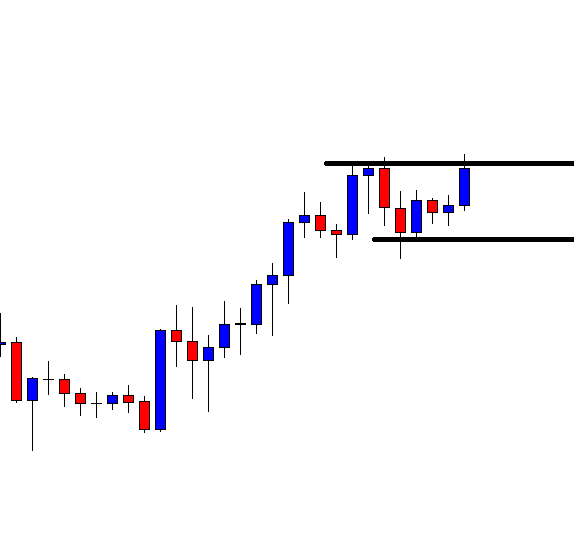
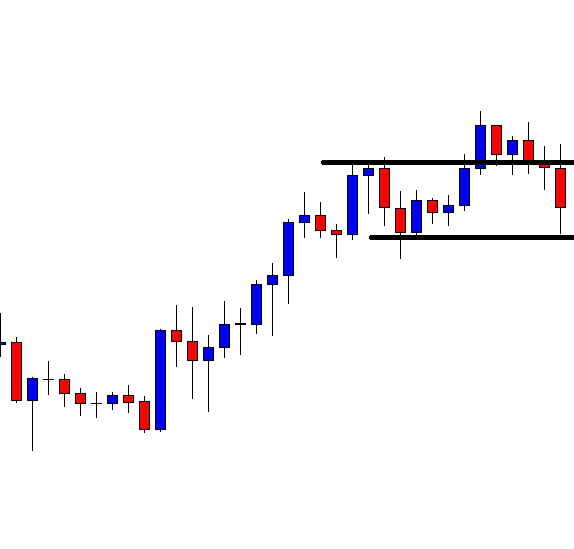
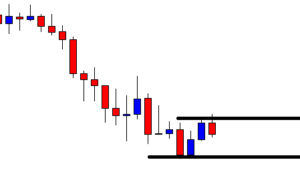
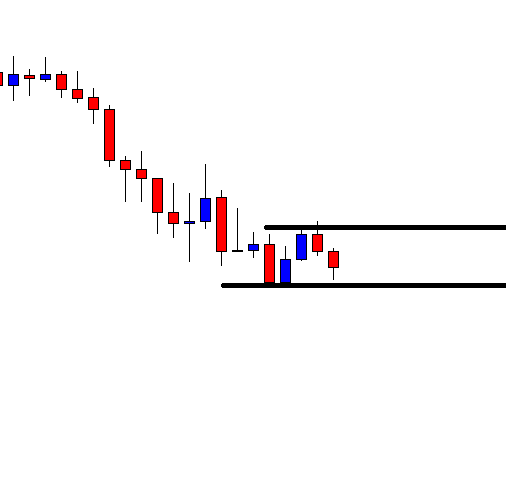
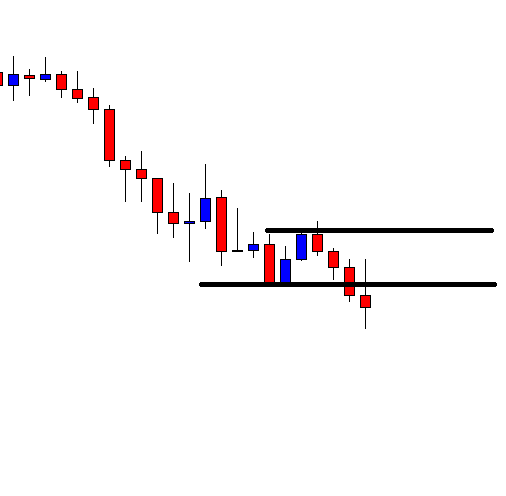
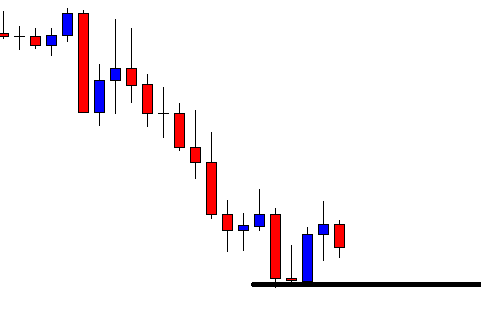
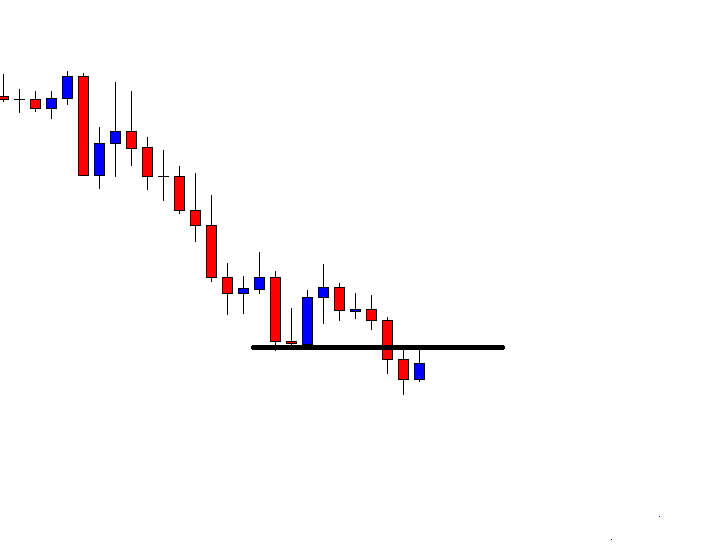
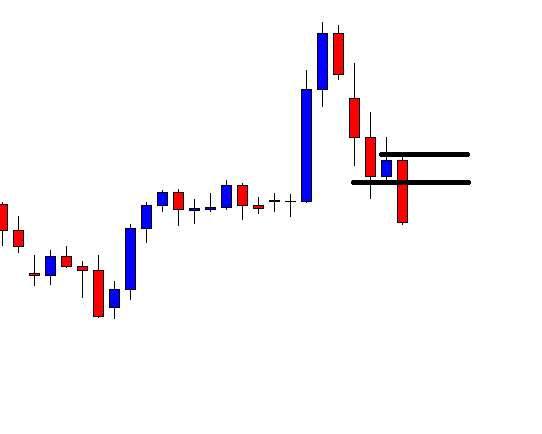
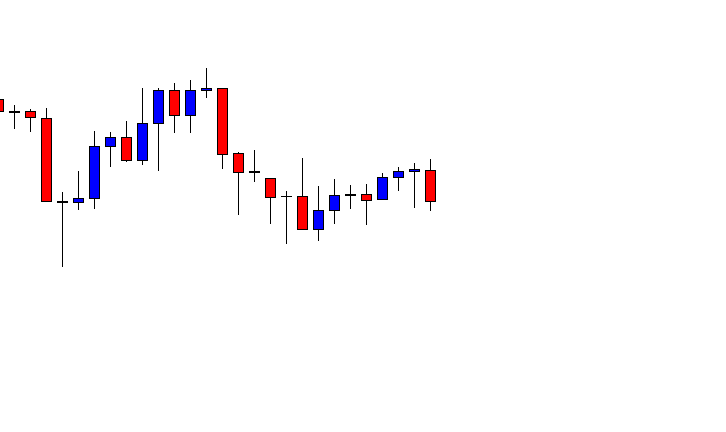
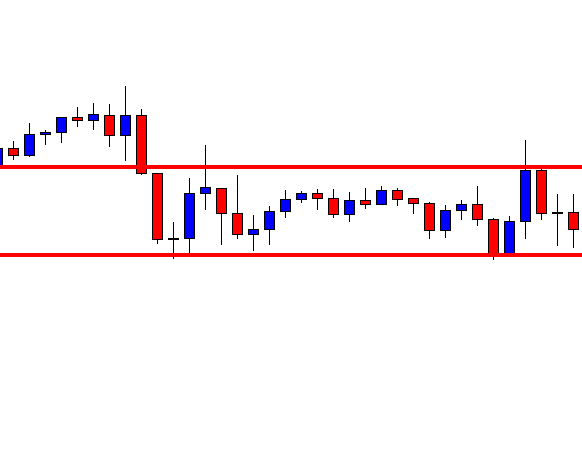
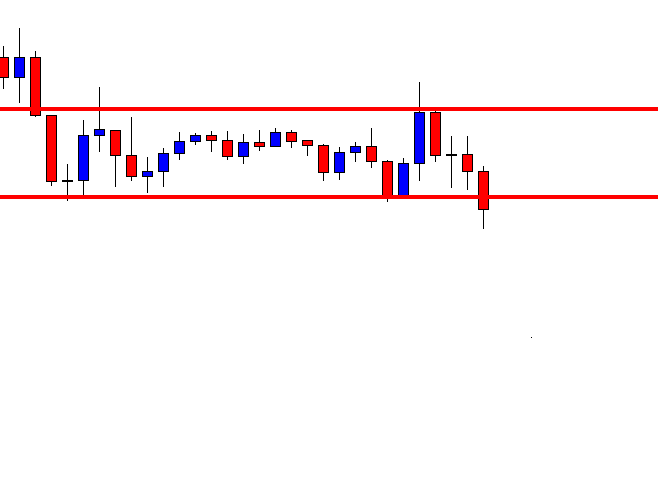
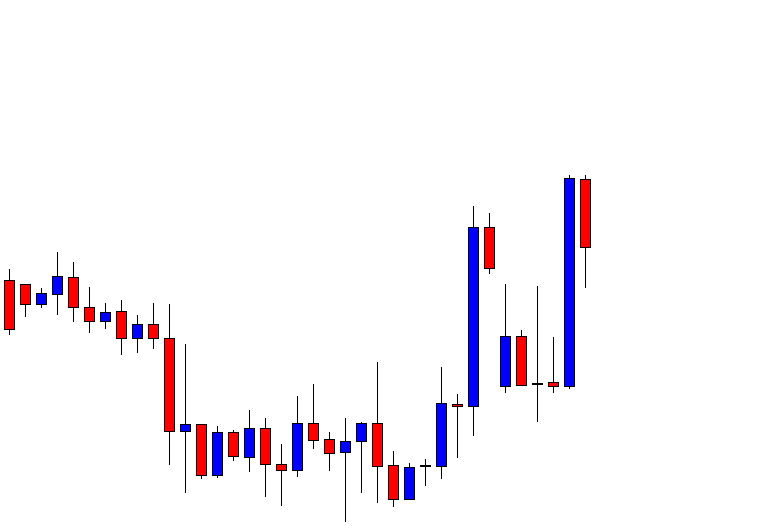
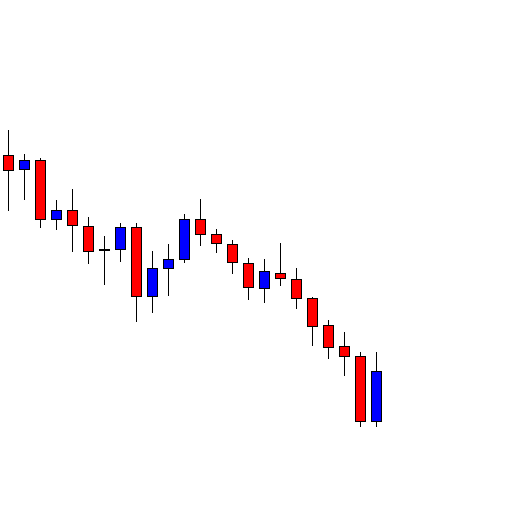
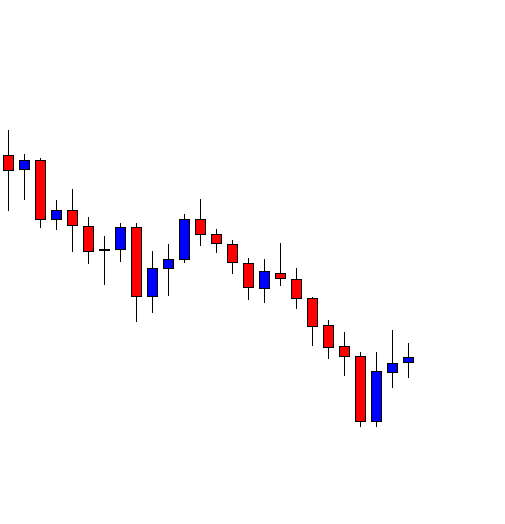
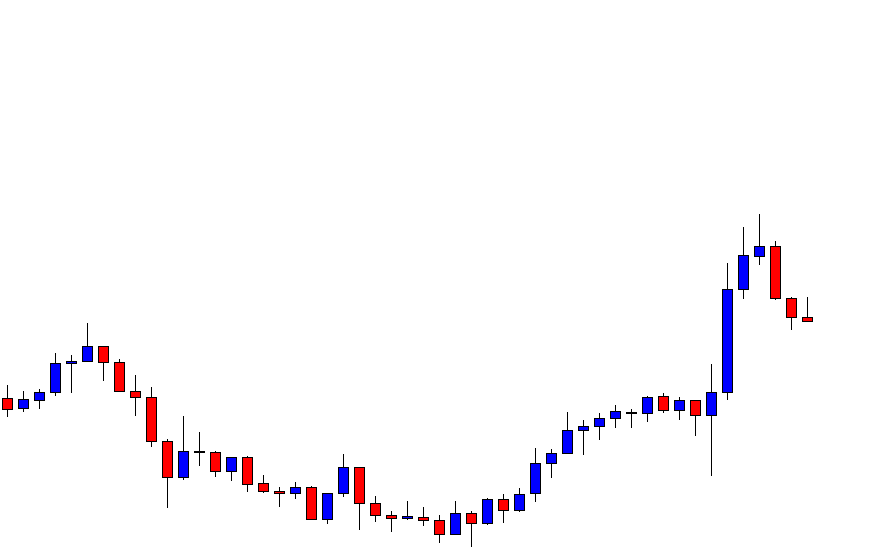
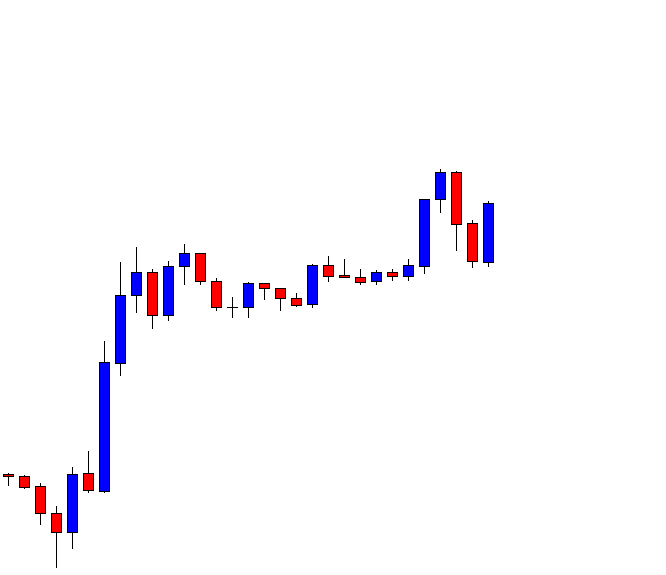
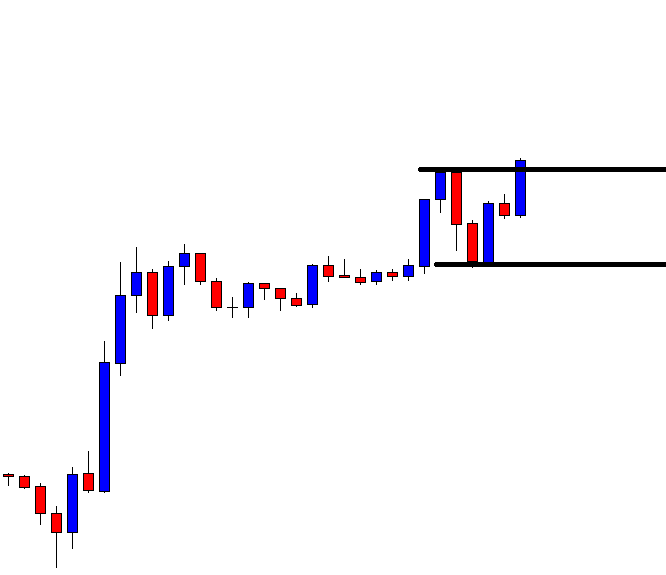
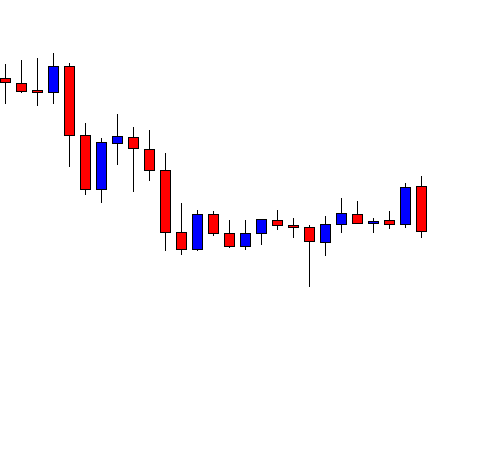
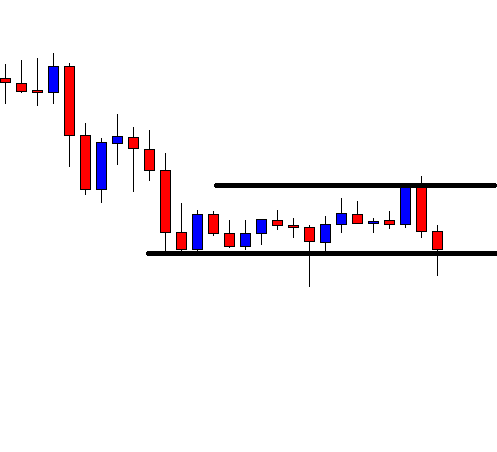
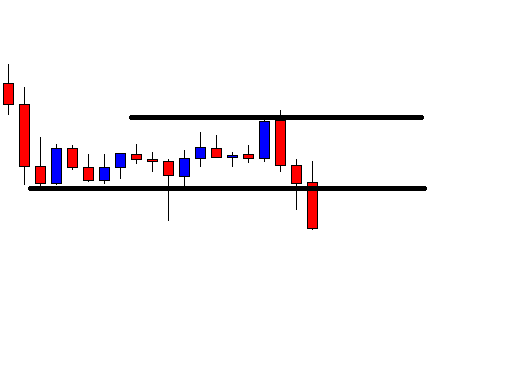
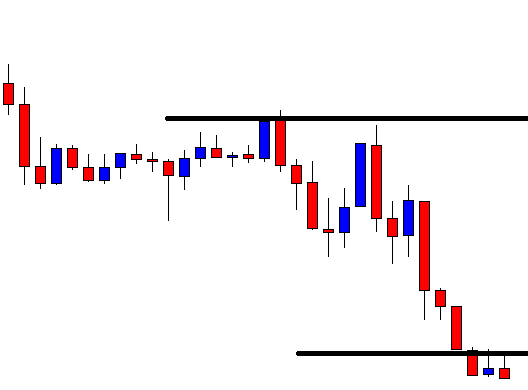
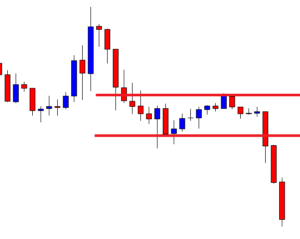
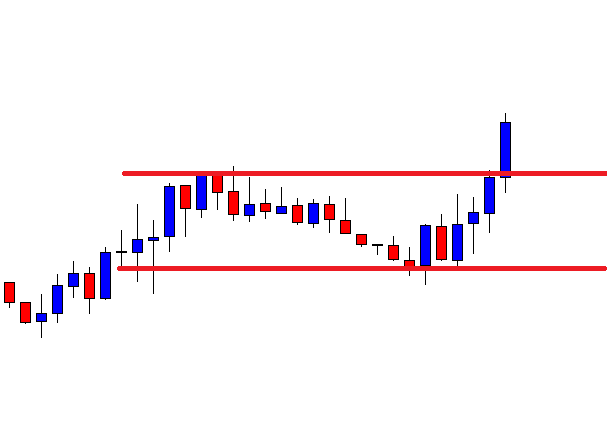
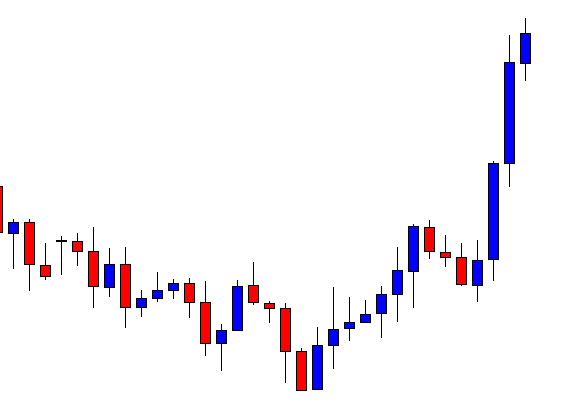
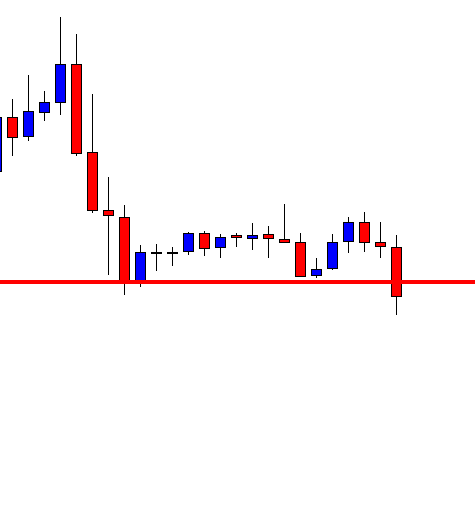
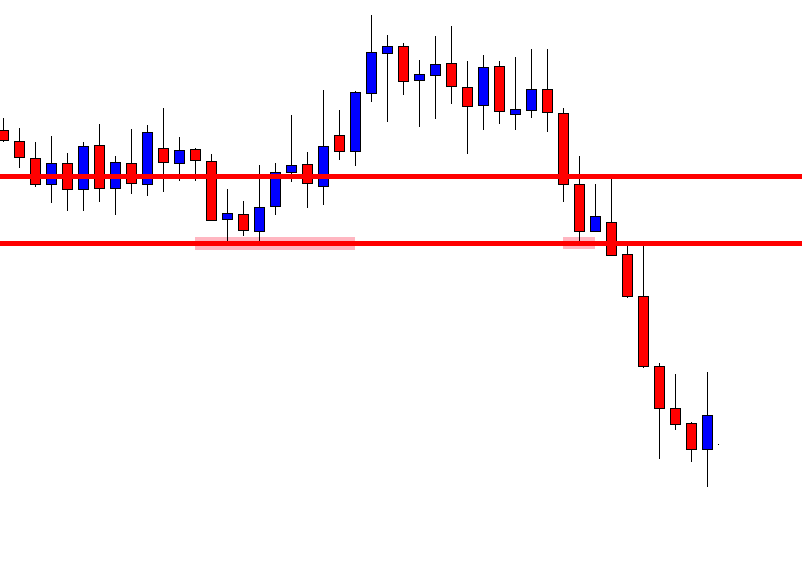
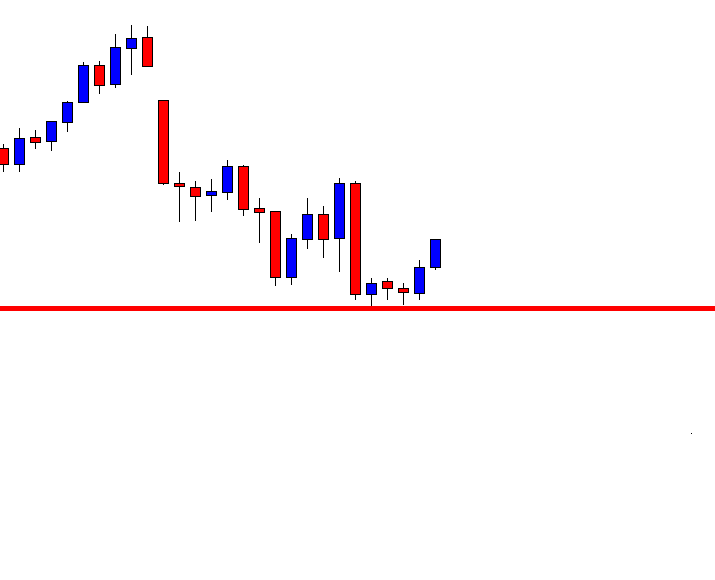
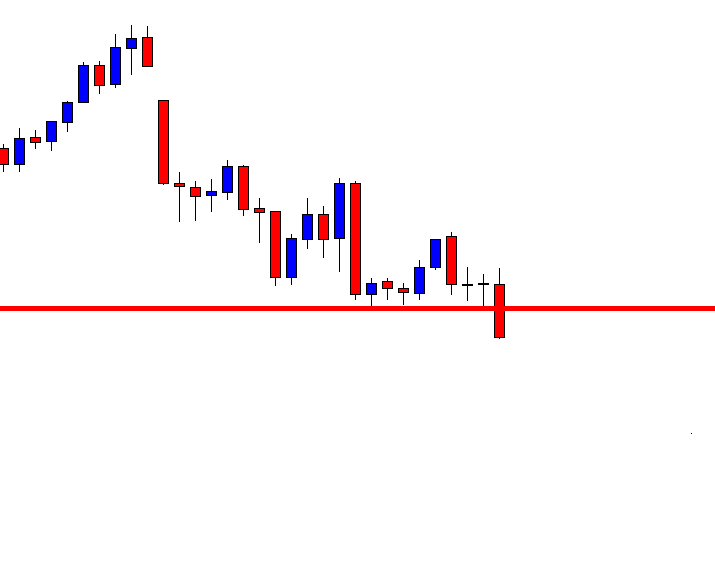
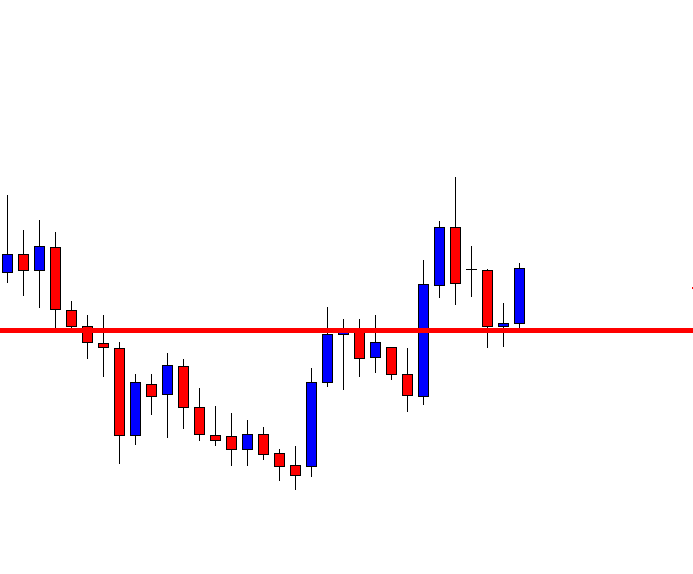
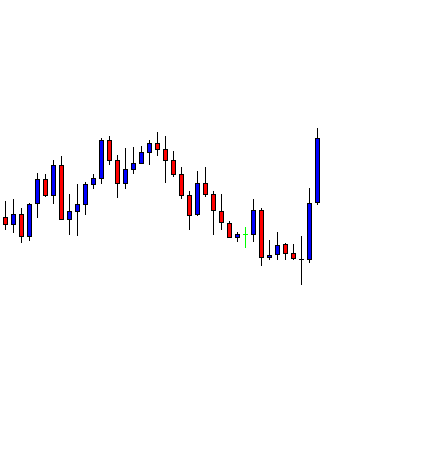
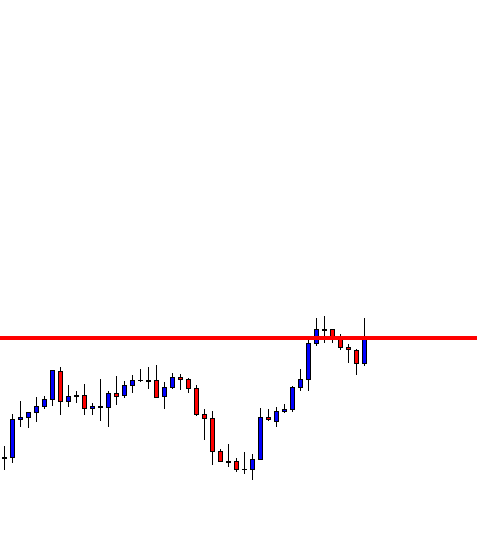
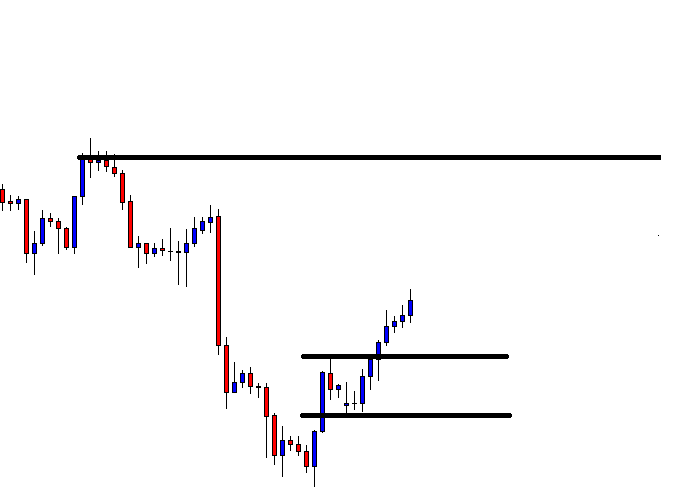
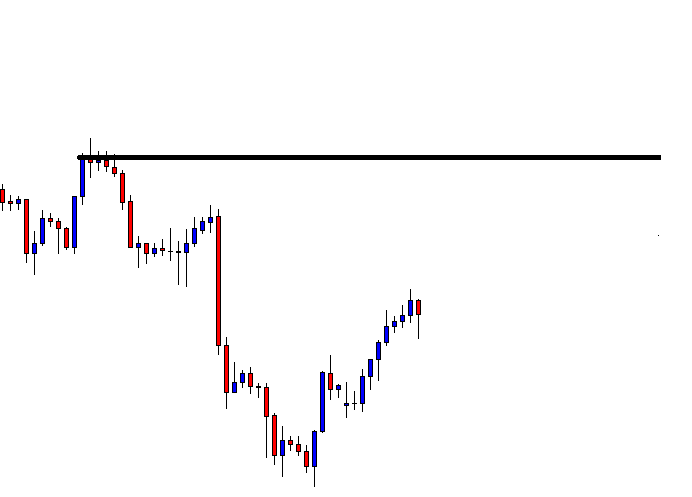
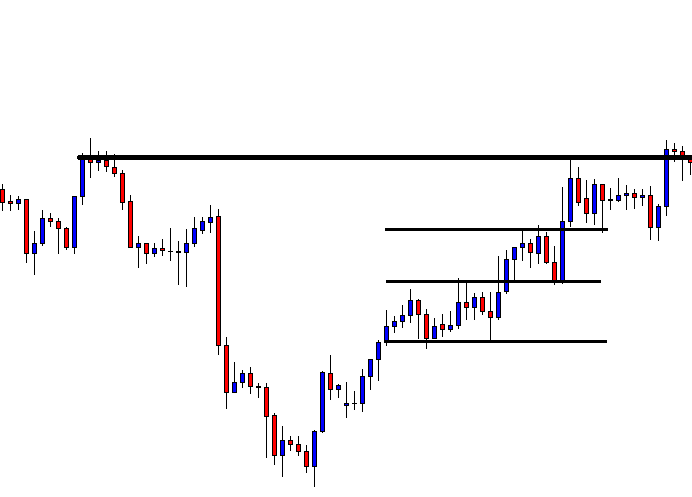
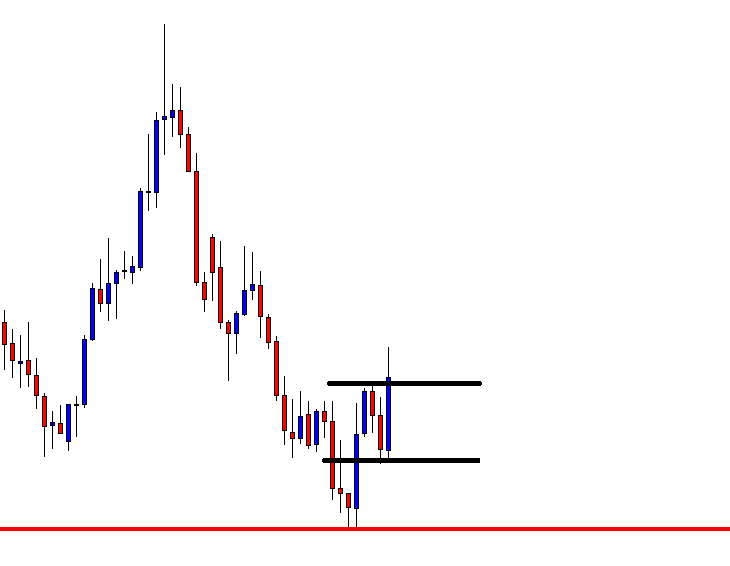
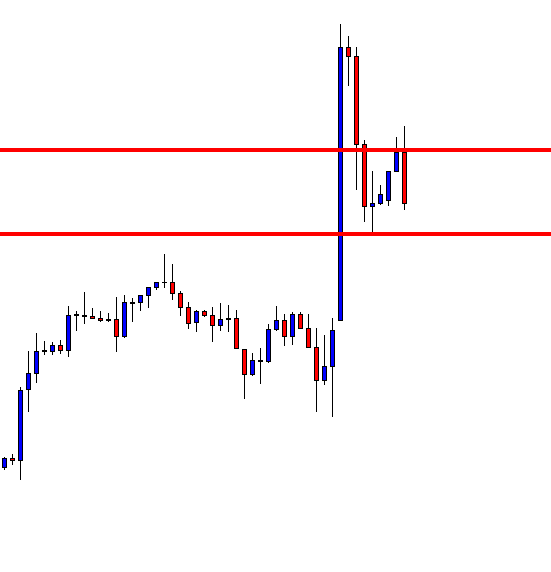
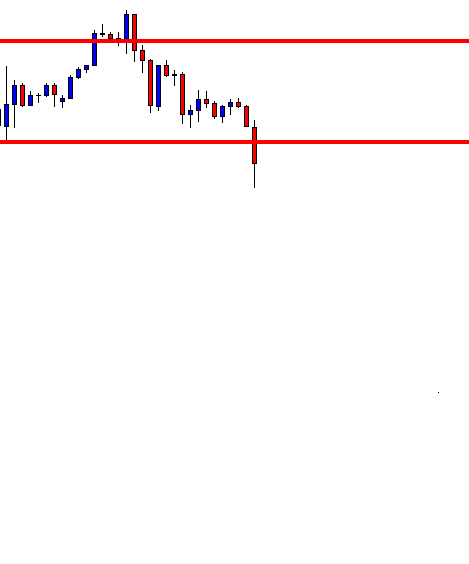
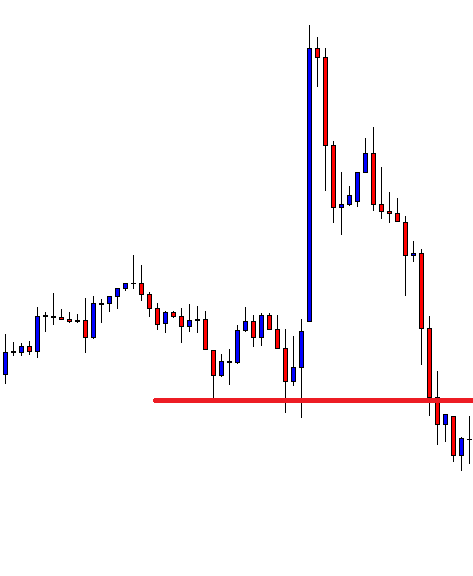
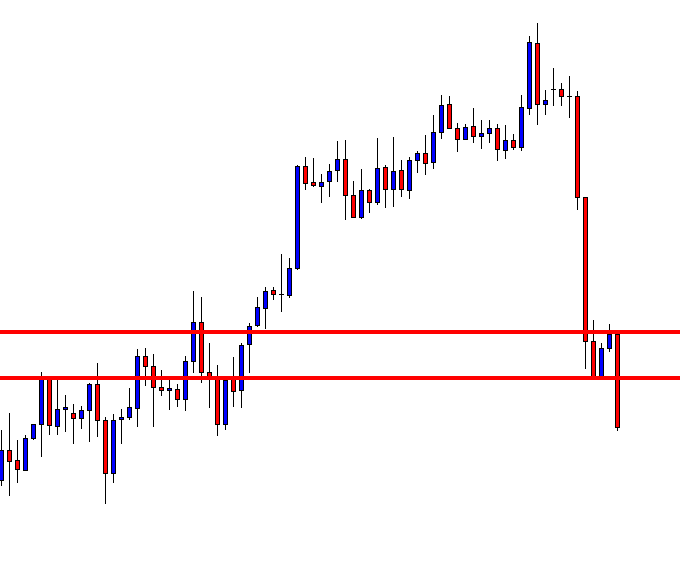
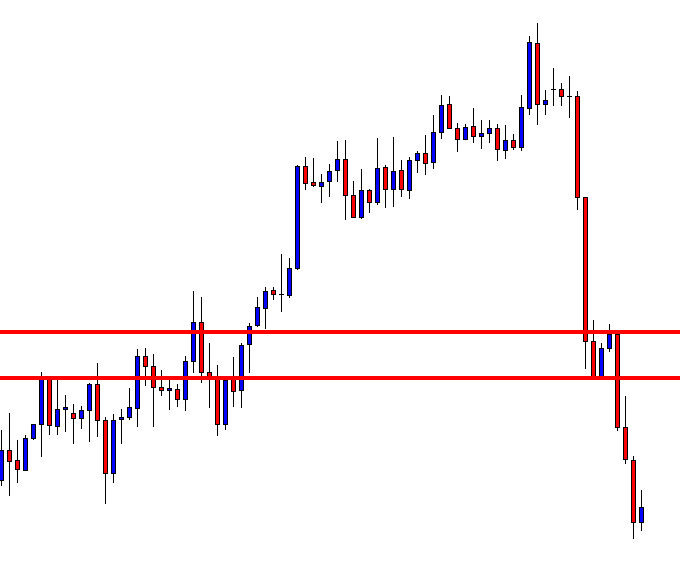
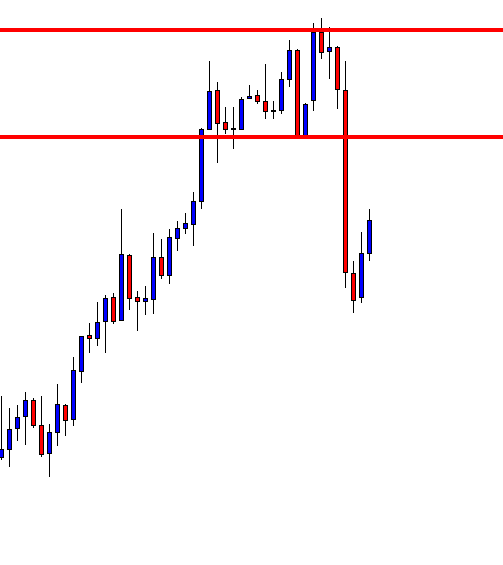
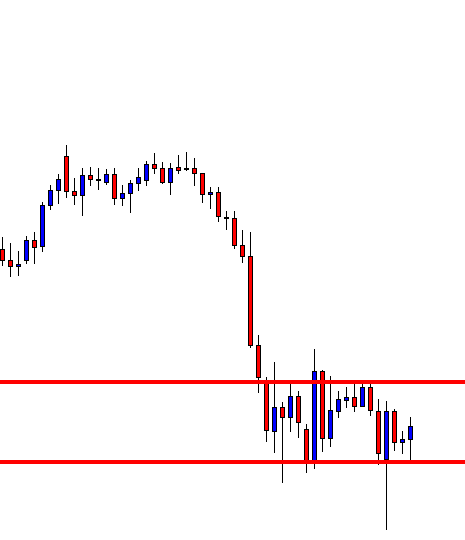
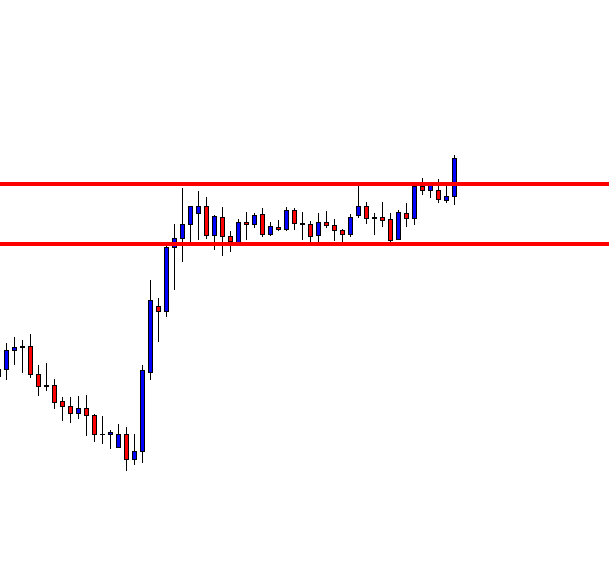
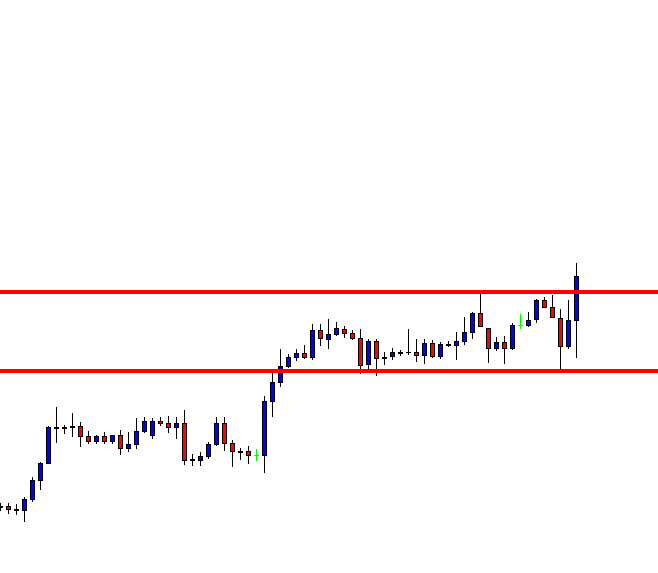
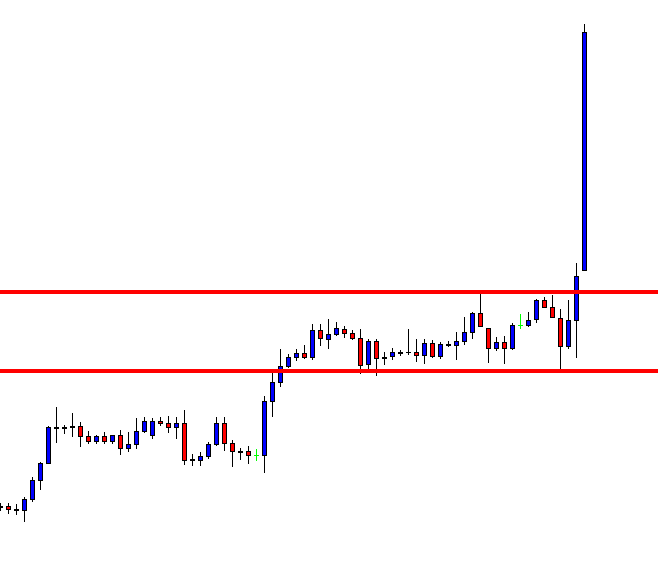
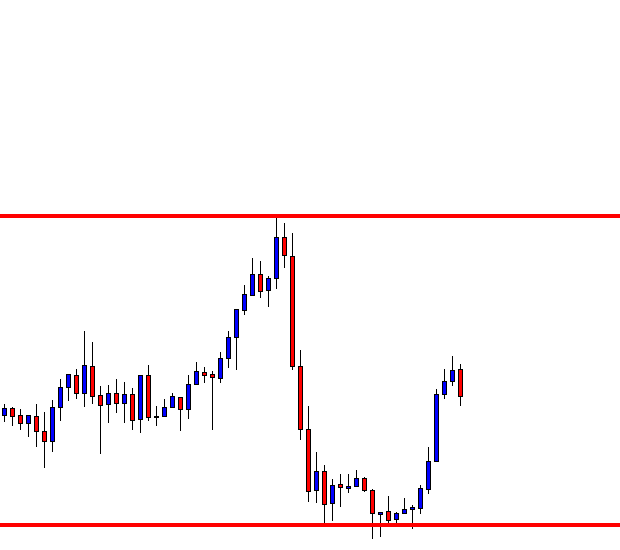
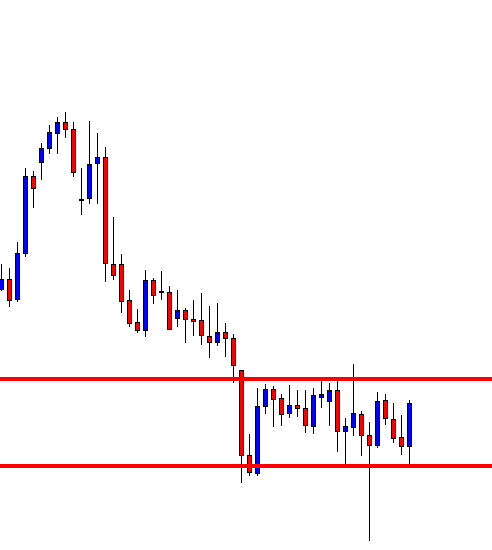
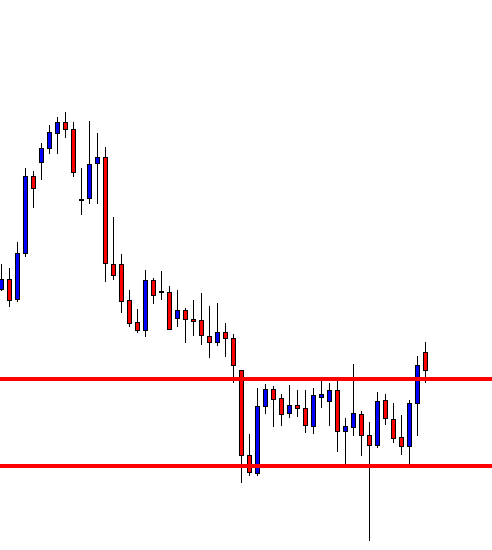
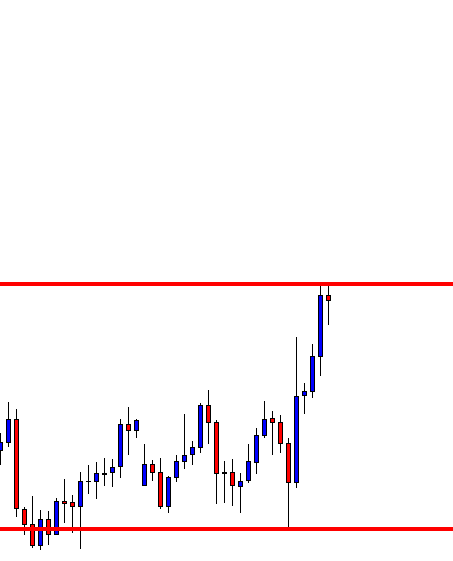
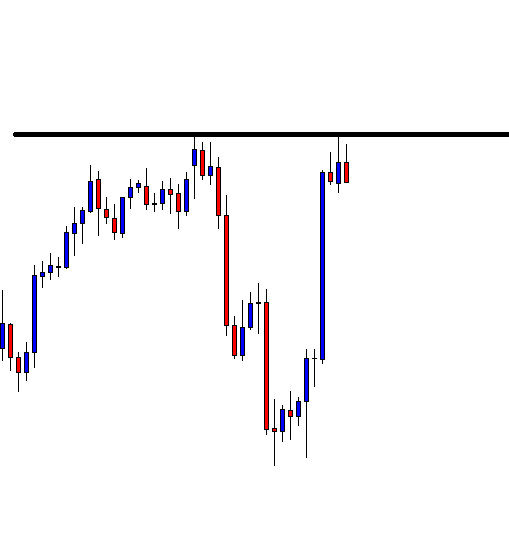
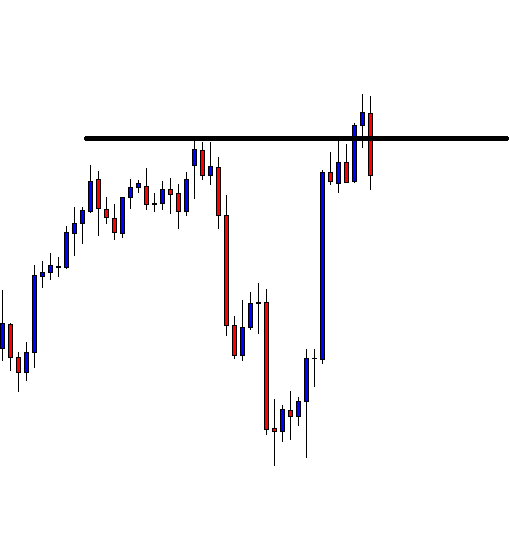
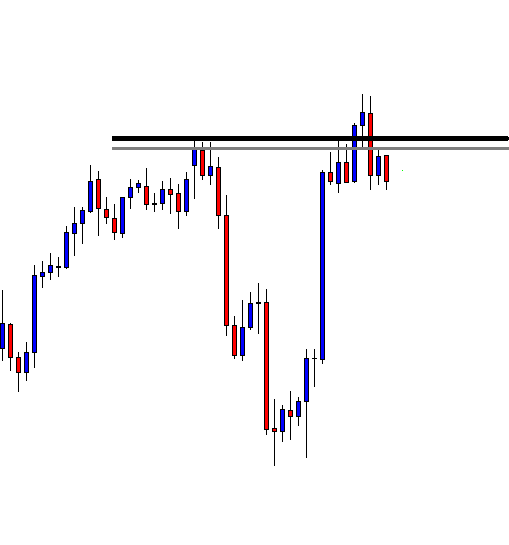
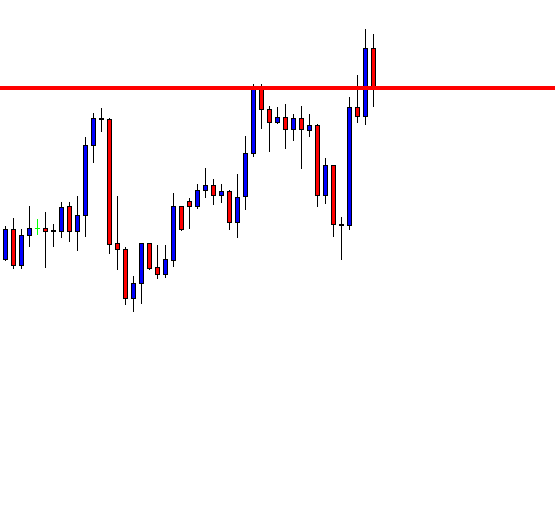
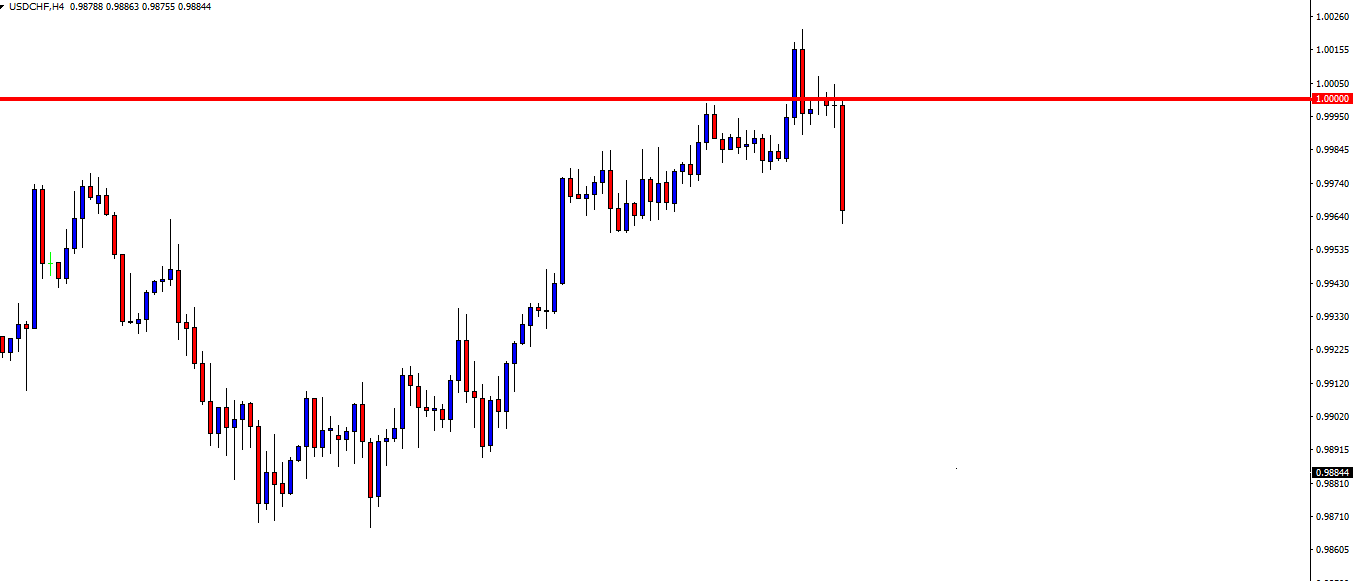
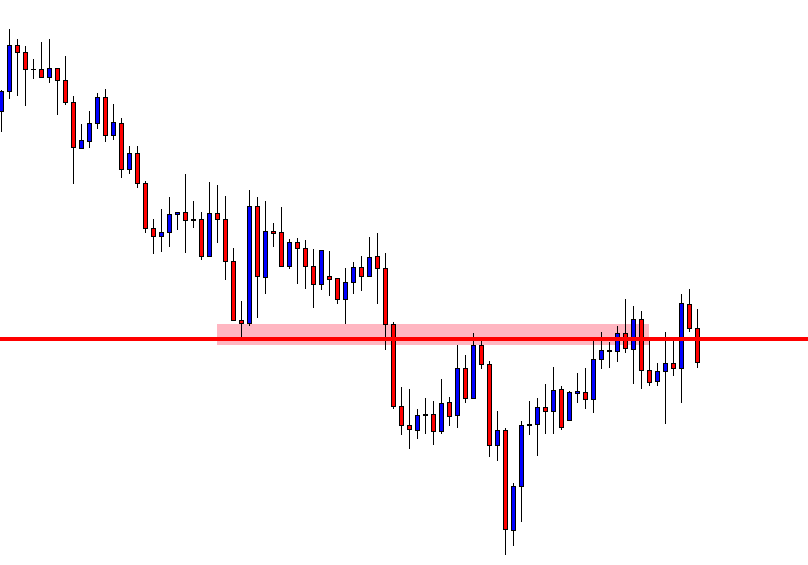
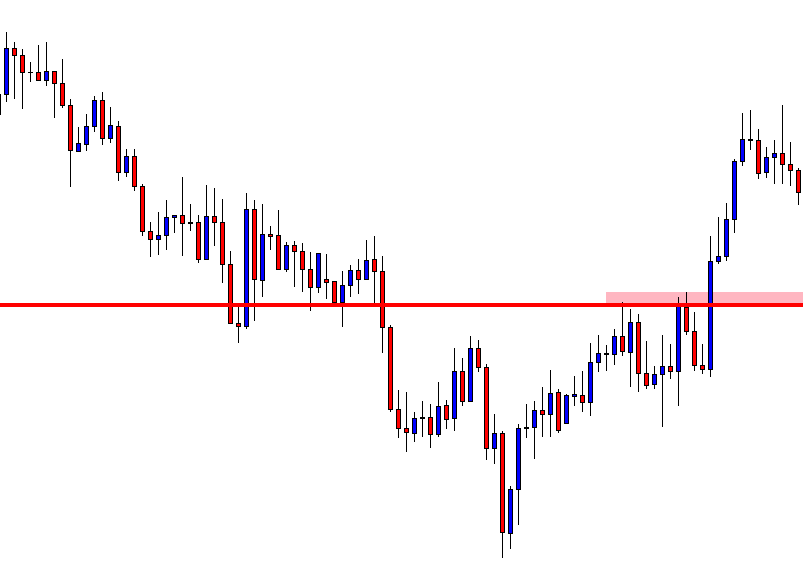
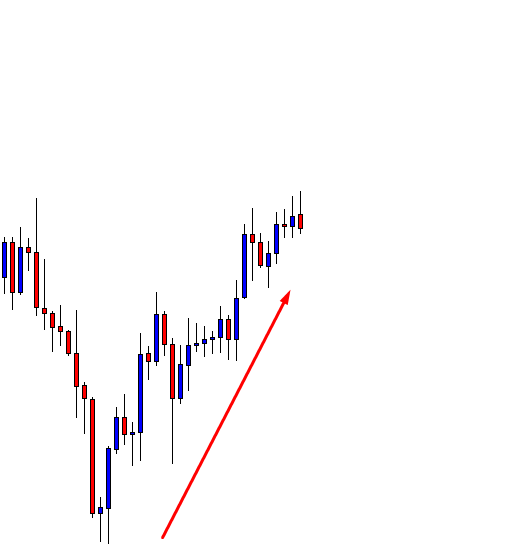
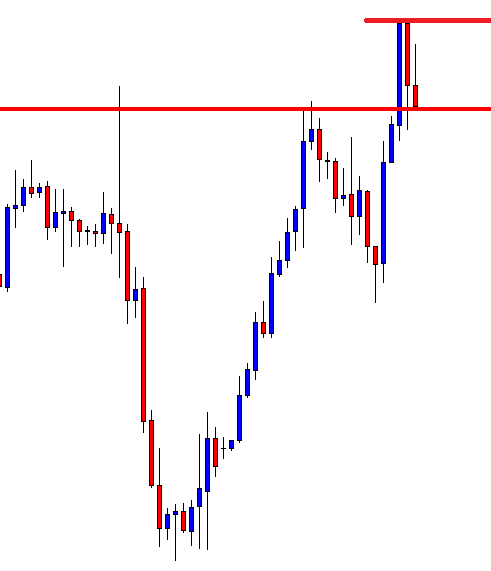
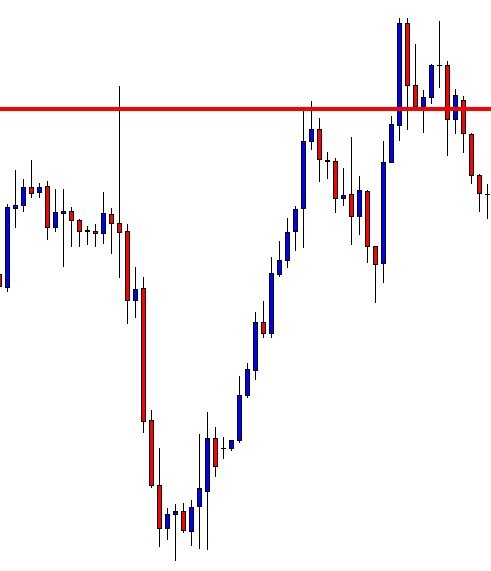
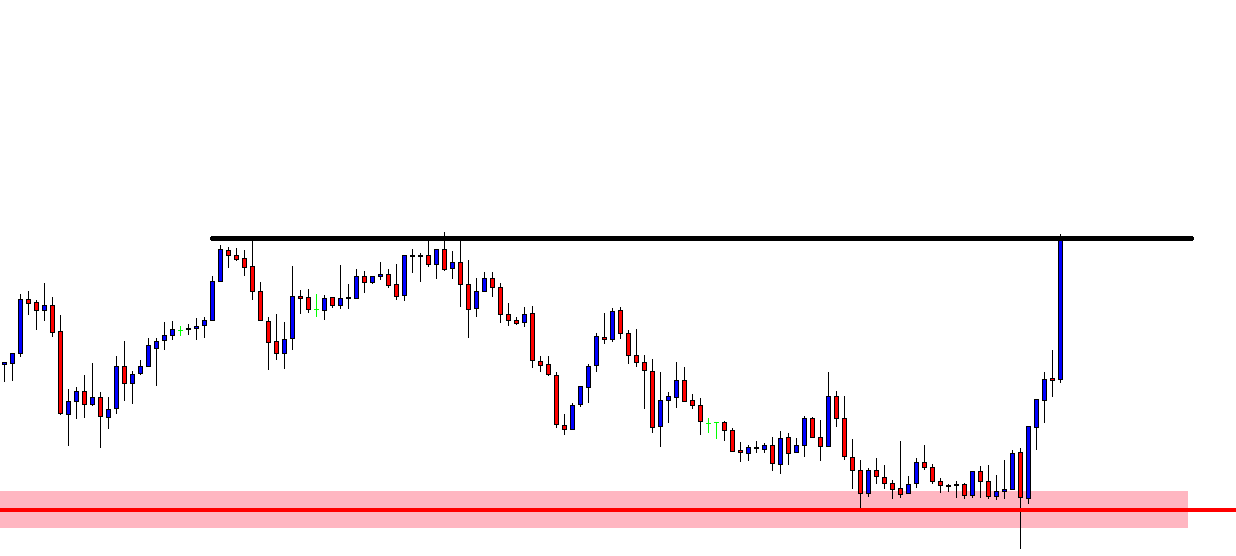
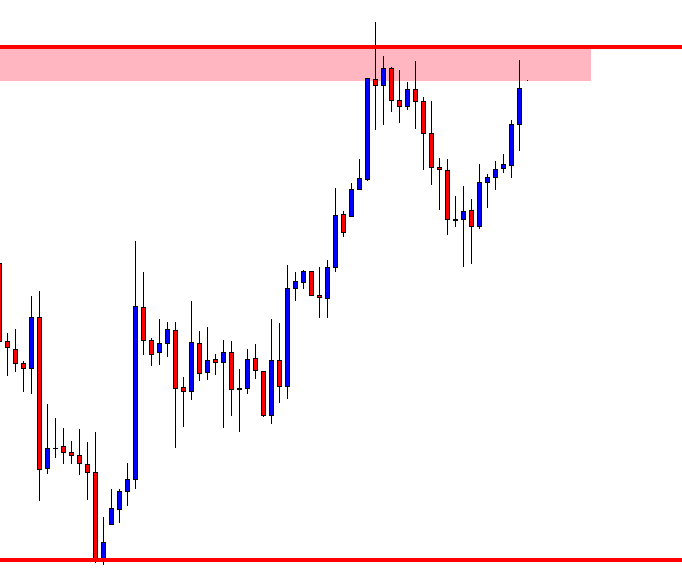
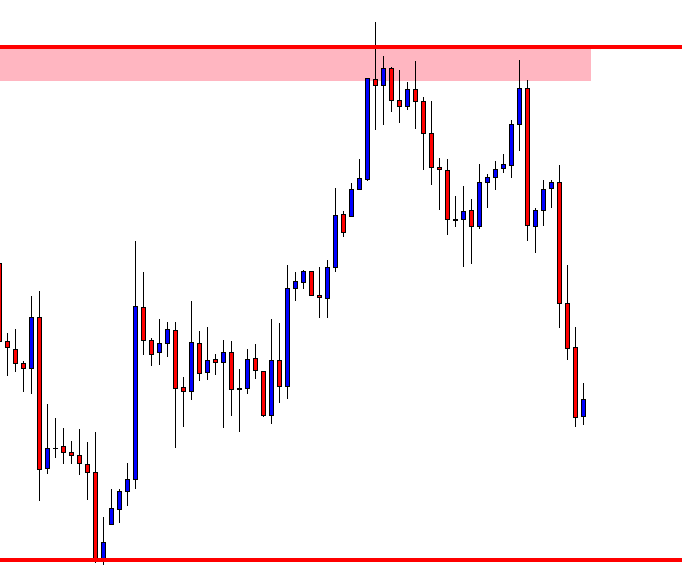
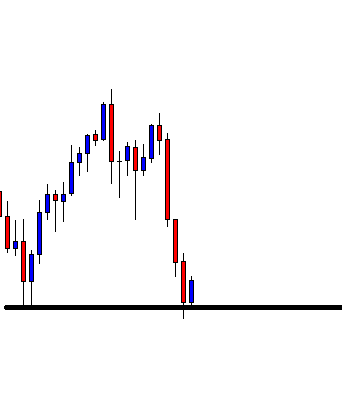
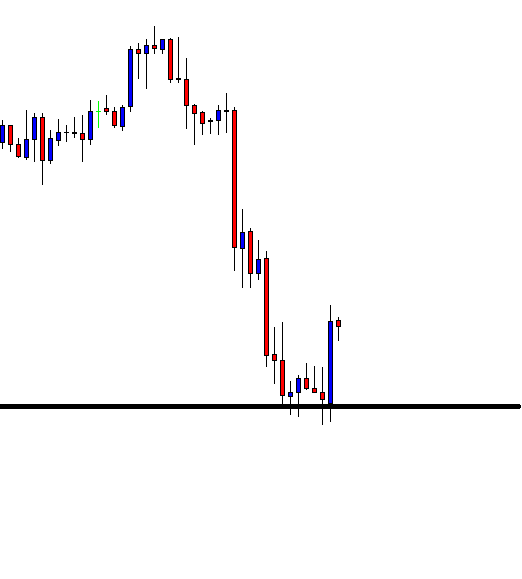
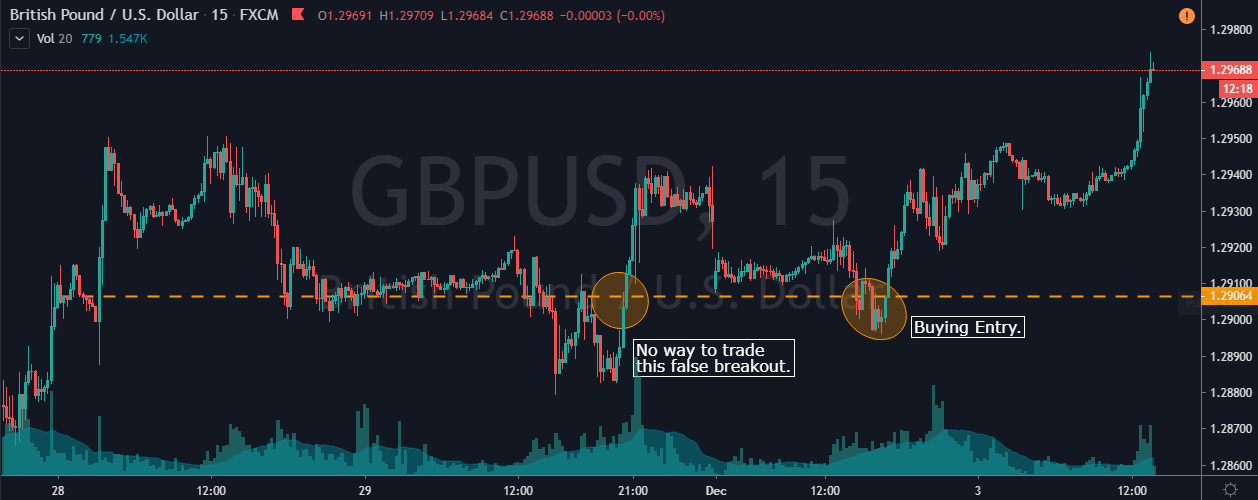
In the below image, GBP/USD was in an uptrend. On 15 Min chart during the pullback phase, prices started holding at the support area. On 29th Nov, look at the first circle where the price action prints the false breakout. But there is no way to trade that breakout. Because after that, the price action dipped below the support area, which is a sign of a false breakout. So it is an indication to go long on the GBP/USD forex pair.

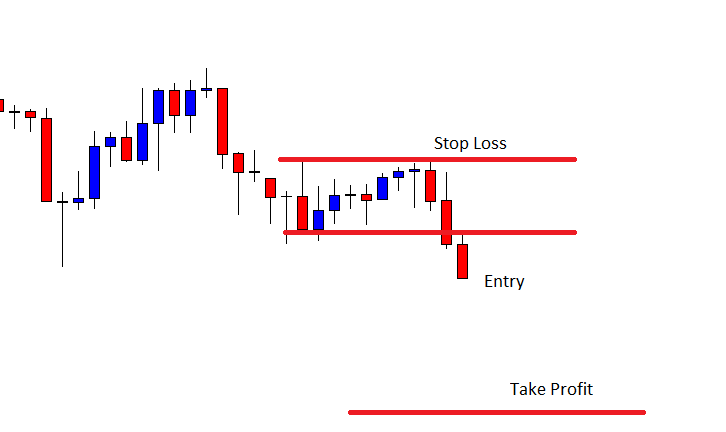
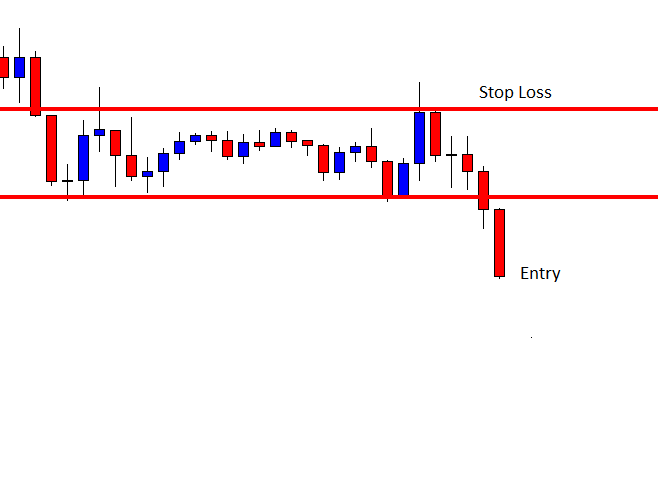
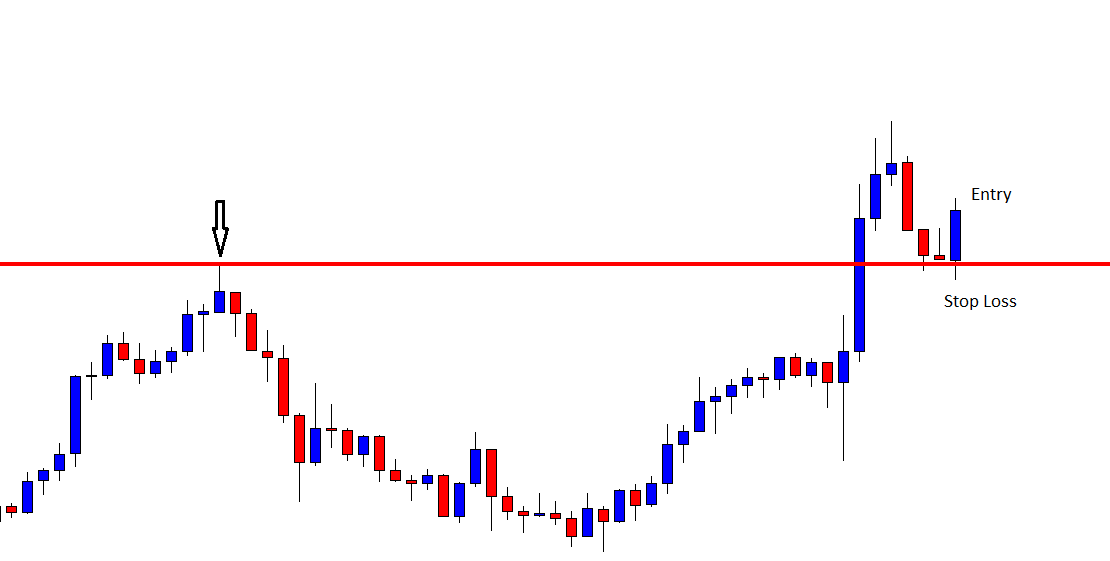
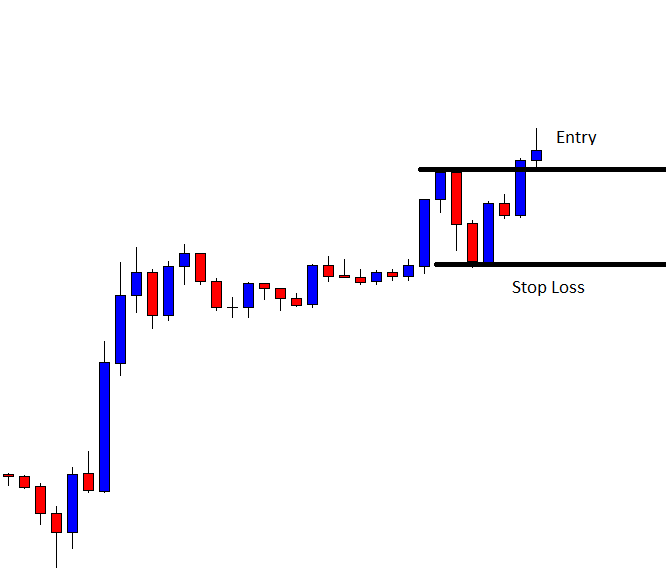
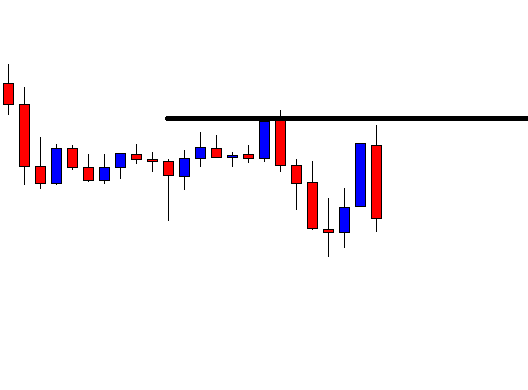
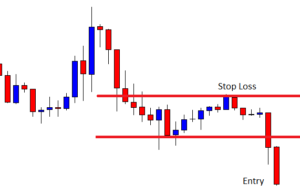
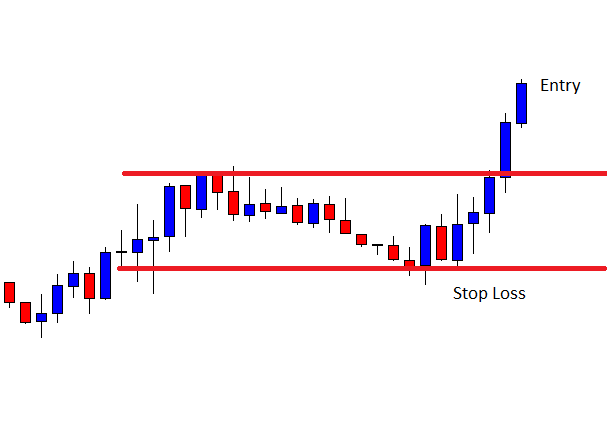
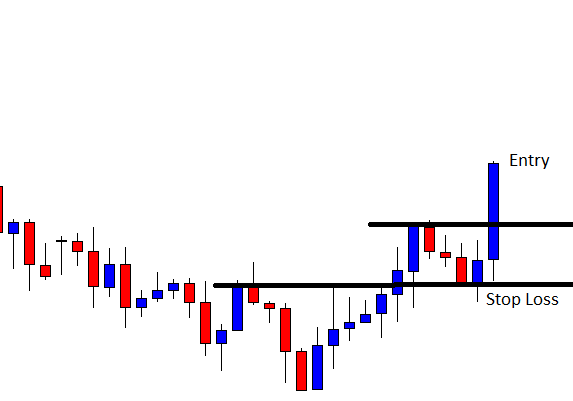
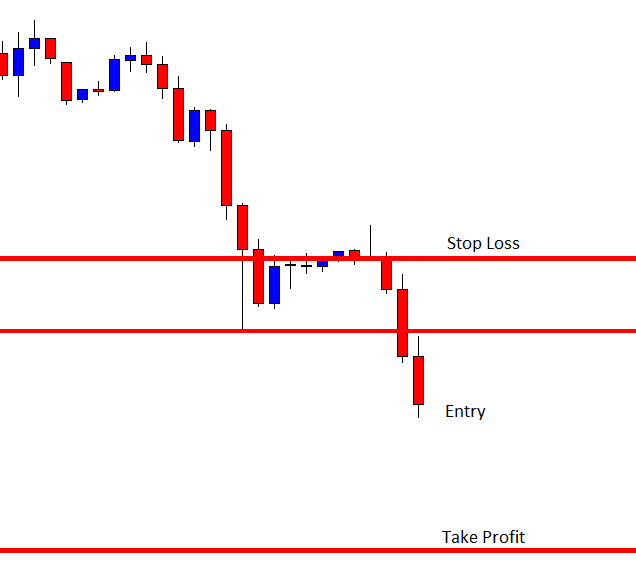
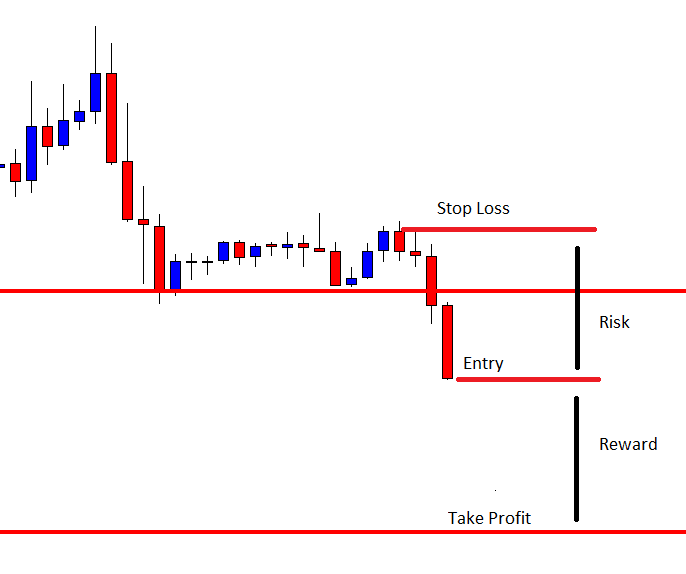
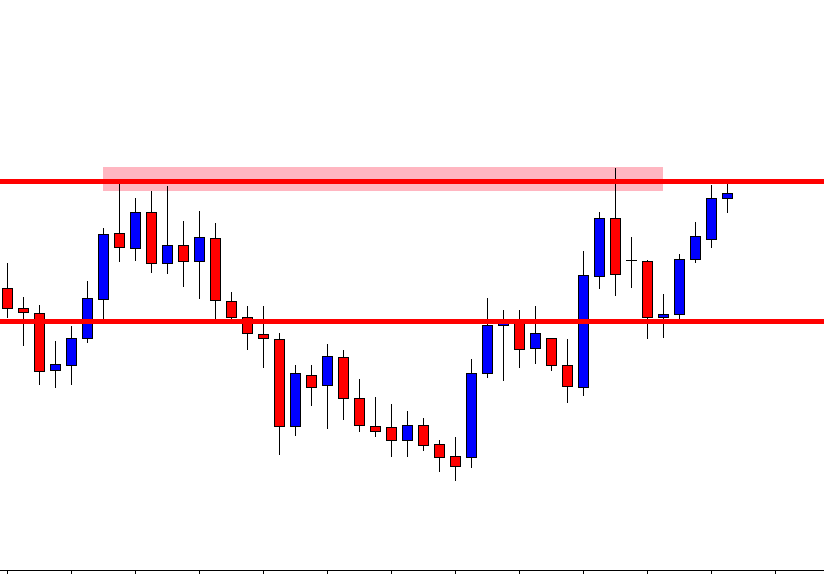
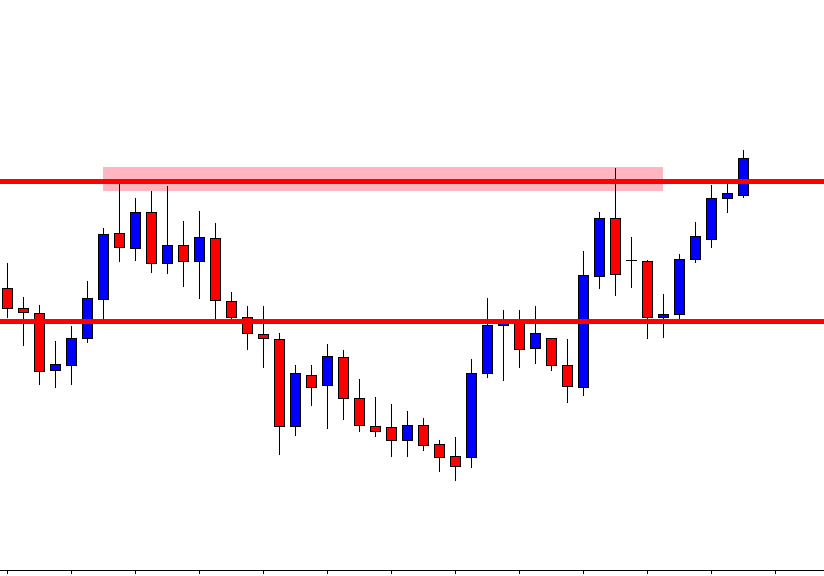
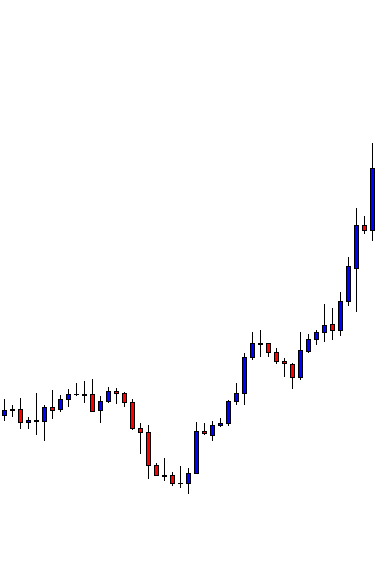
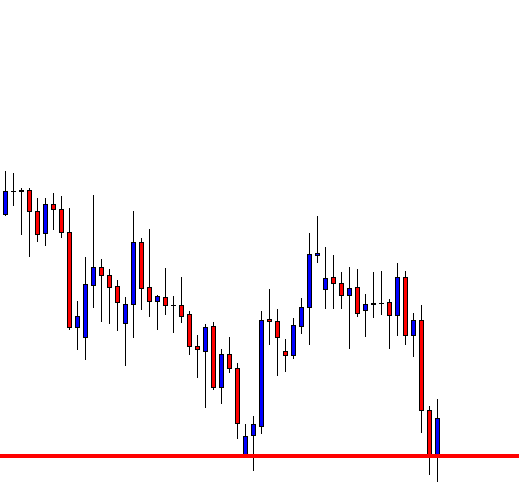
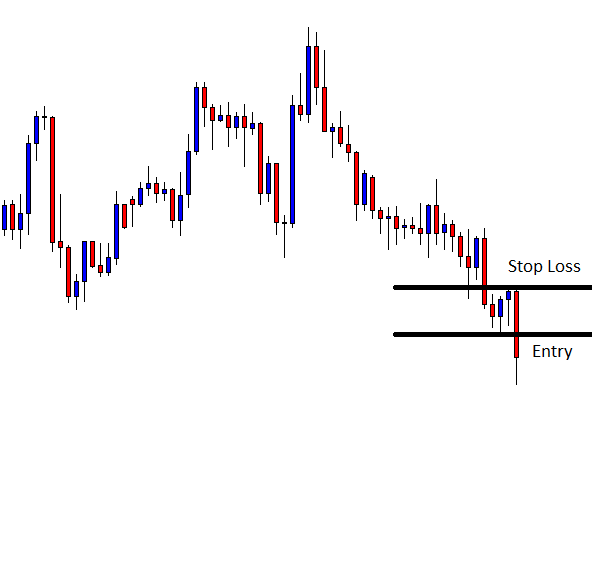
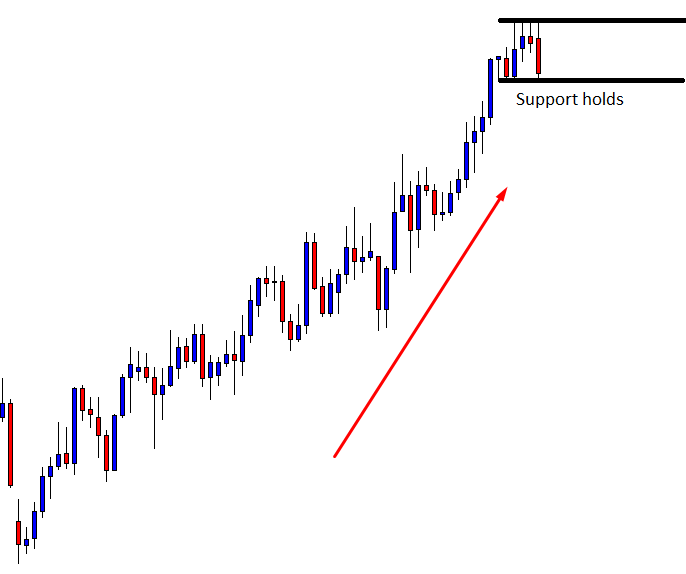
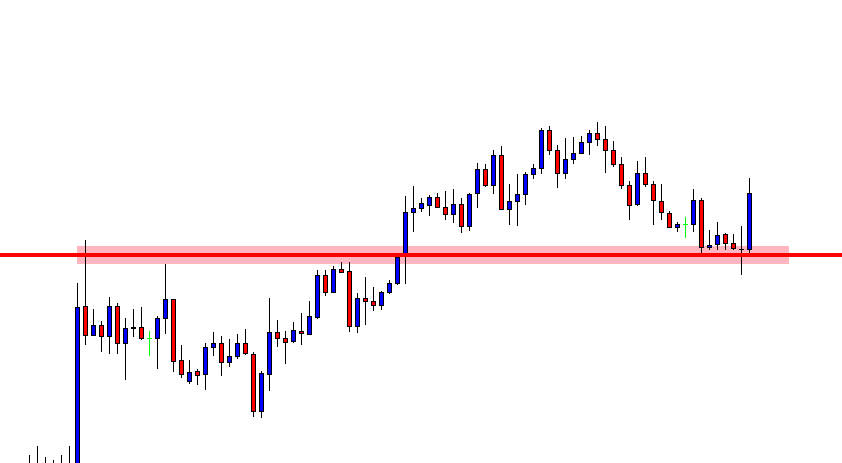
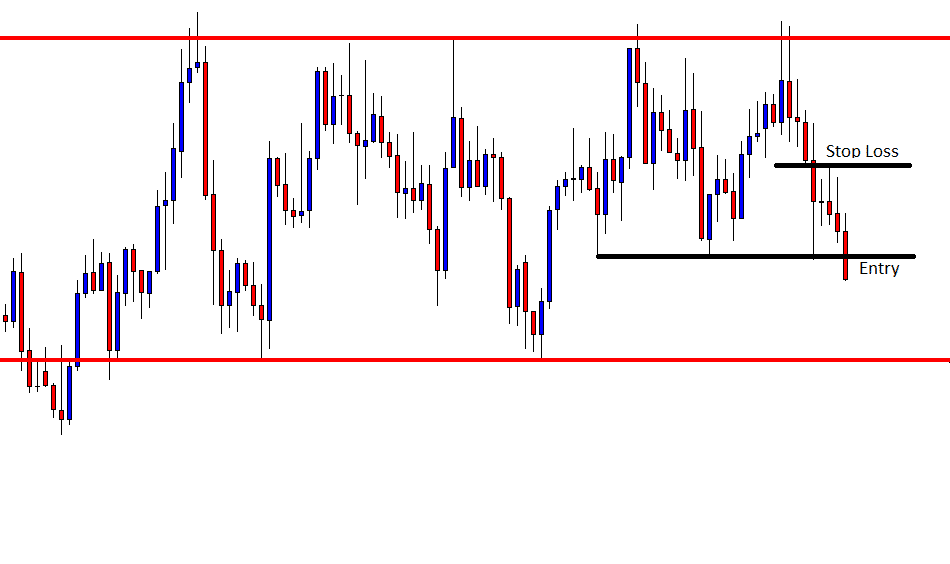
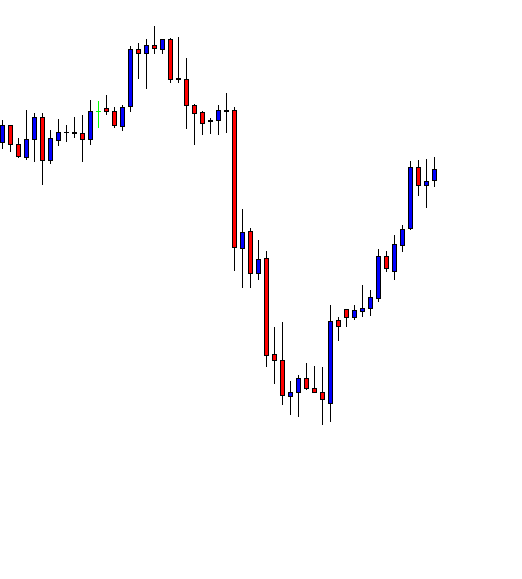
Step 4 – Entry, Stop loss and Take profit

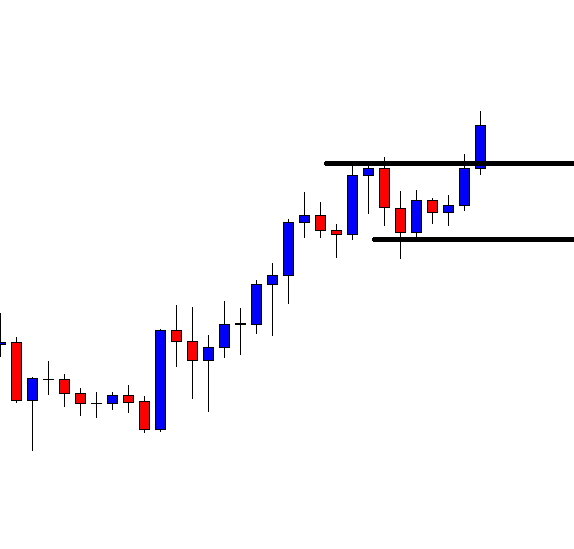
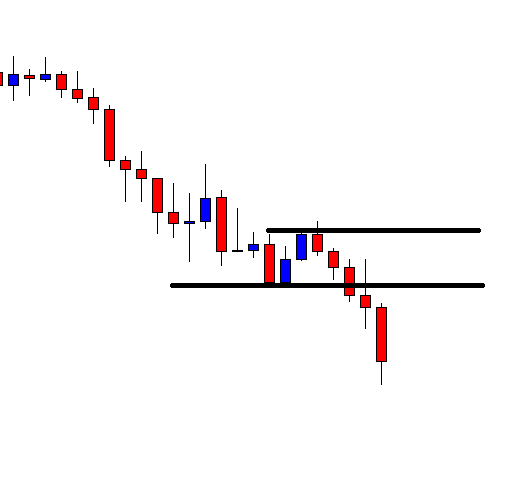
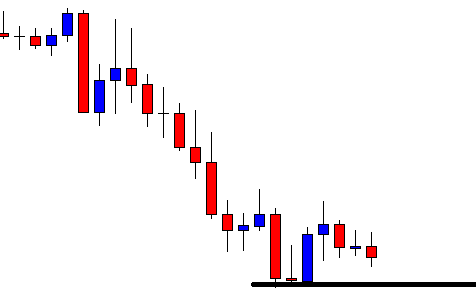
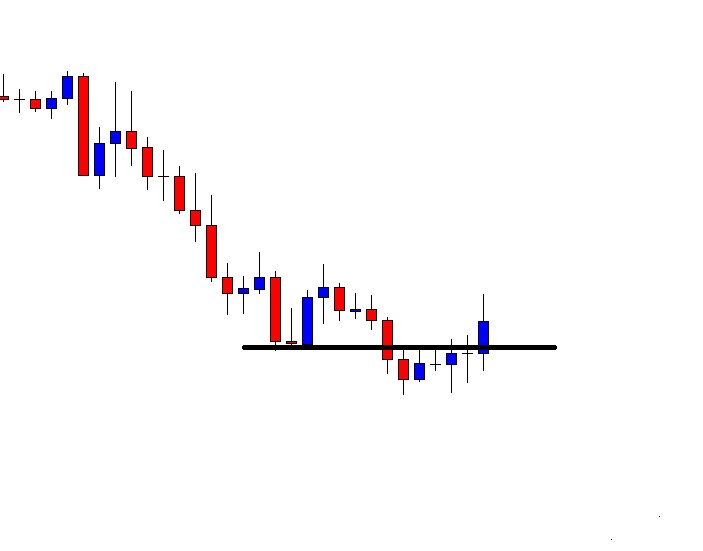
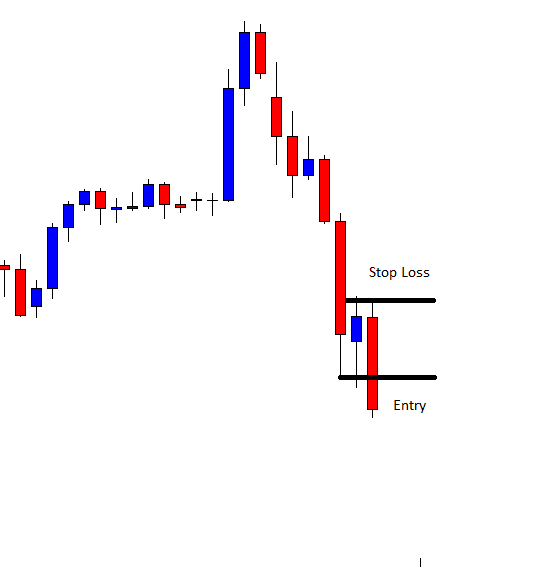
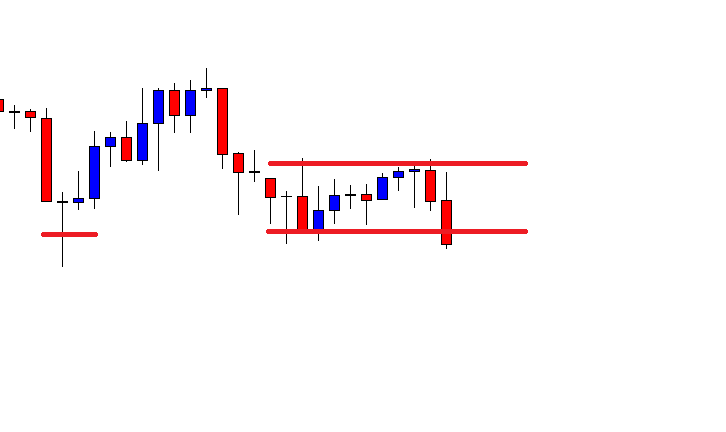
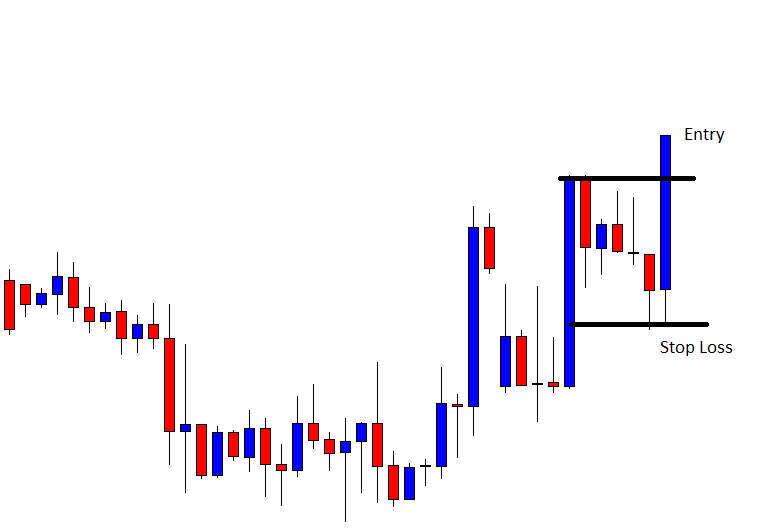
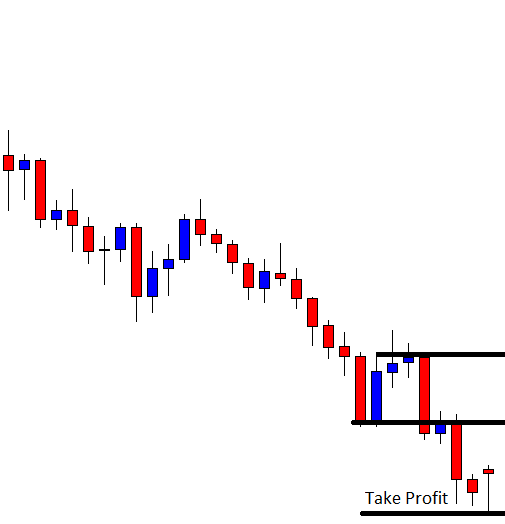
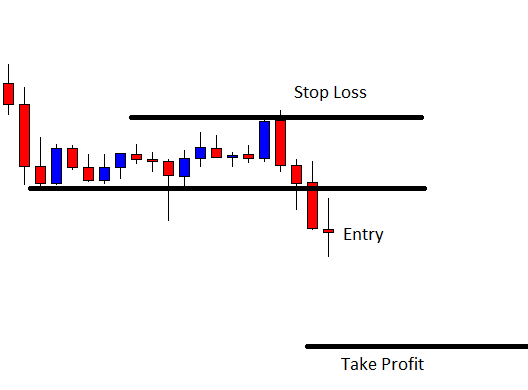
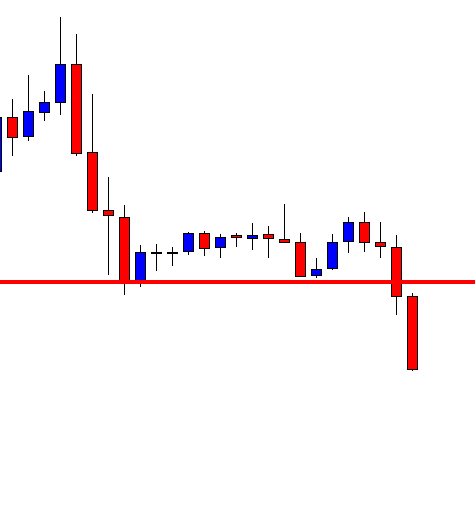
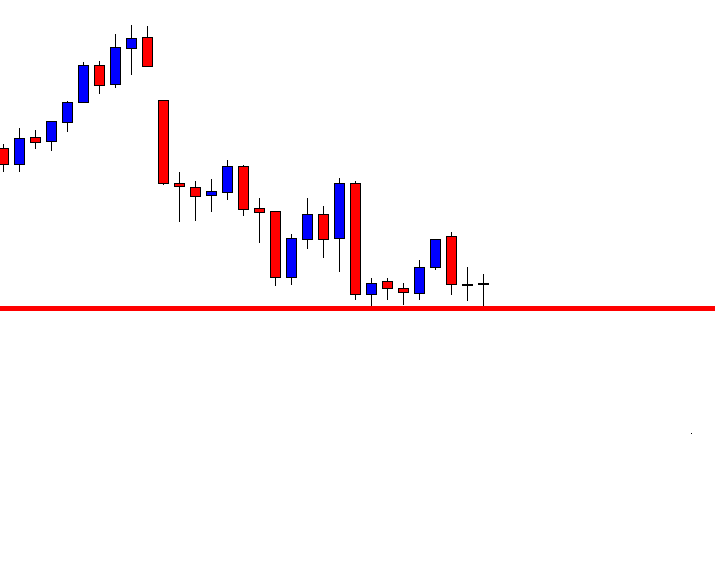
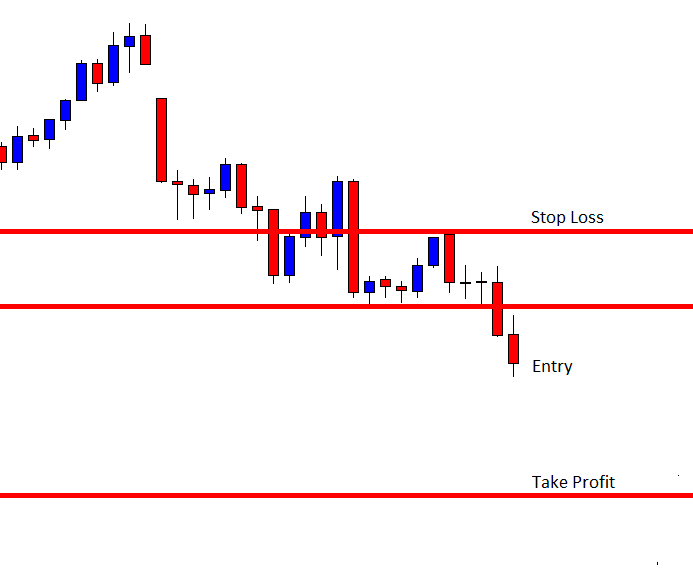
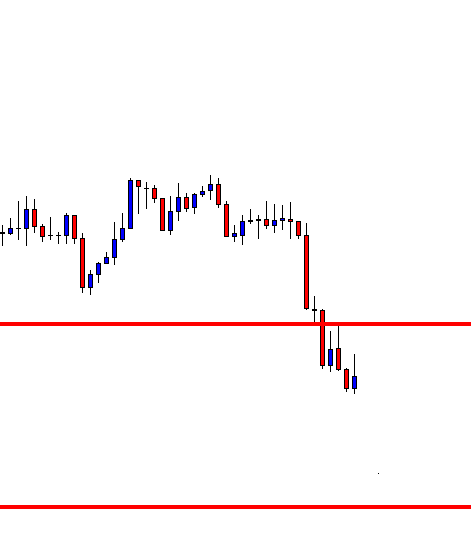
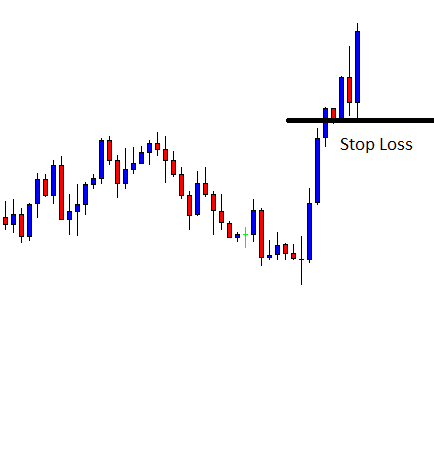
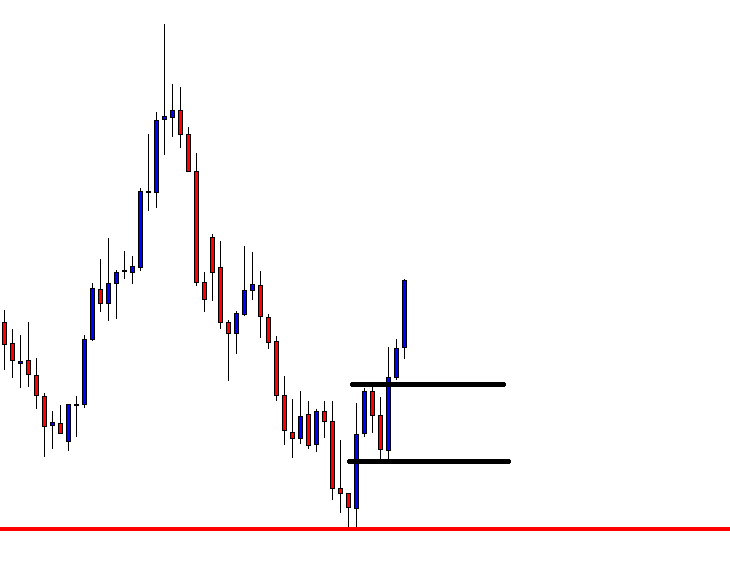
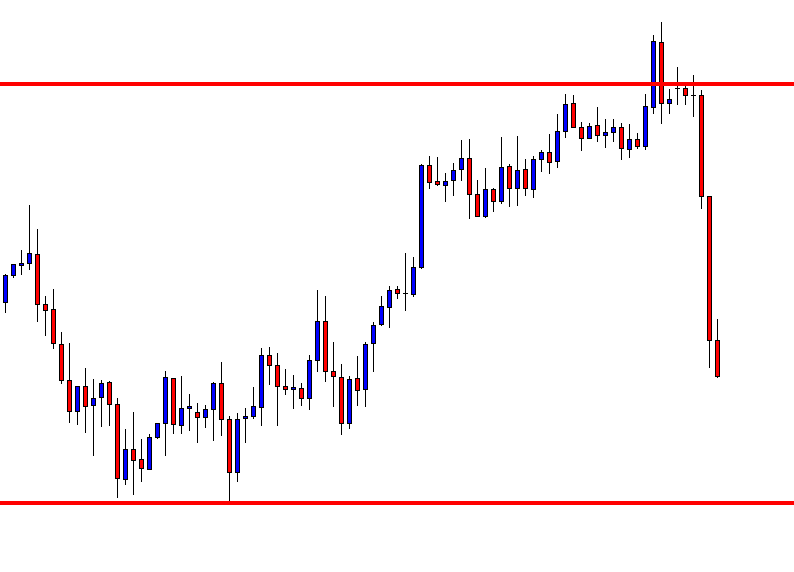
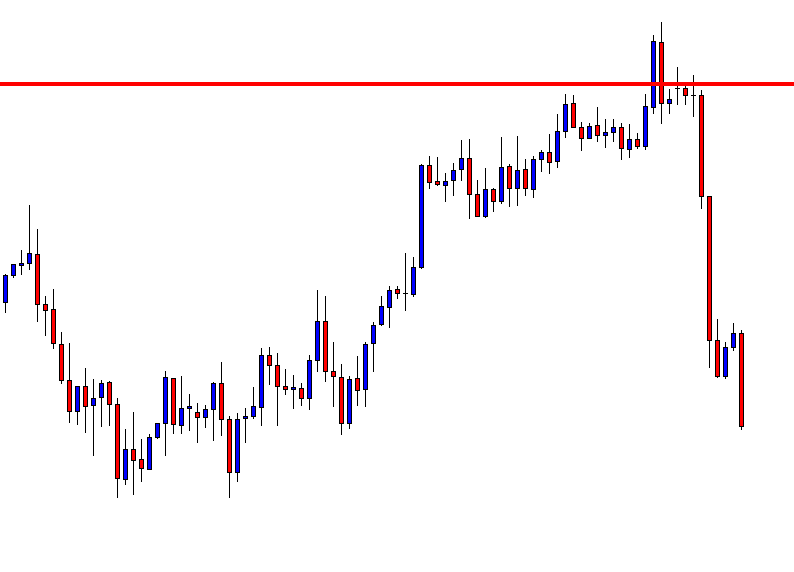
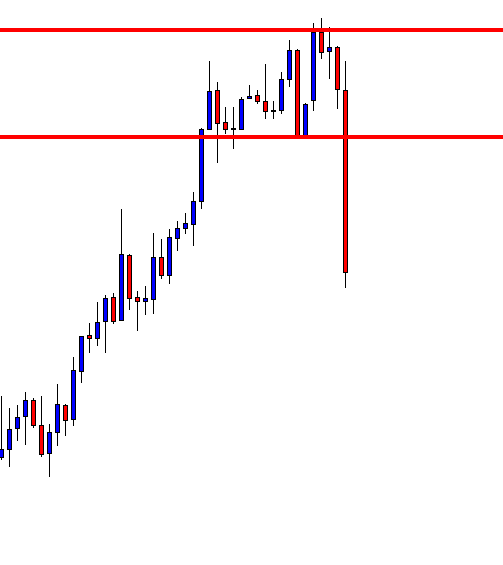
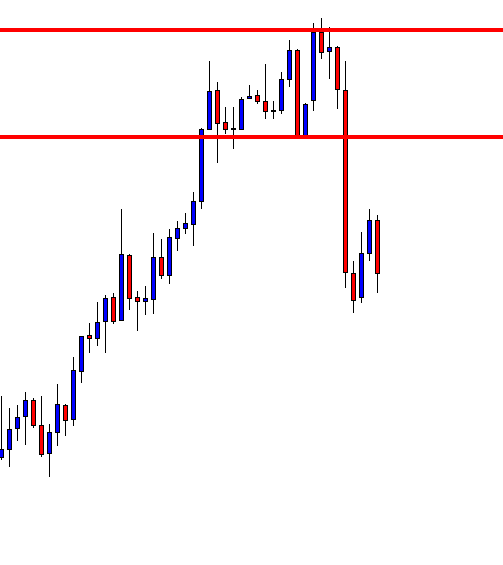
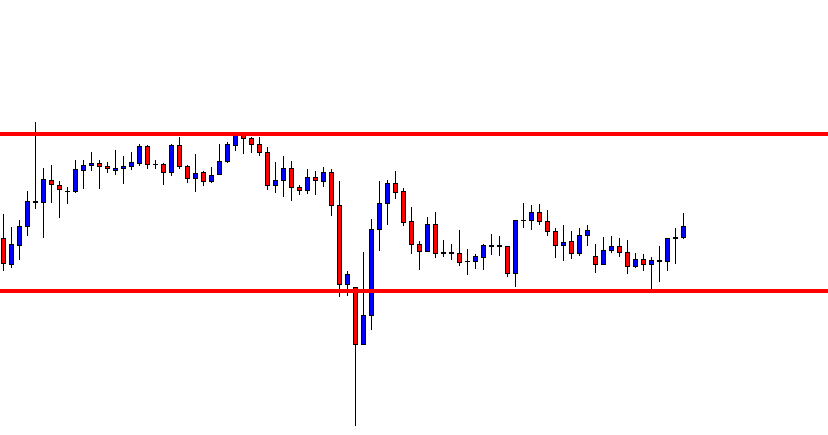
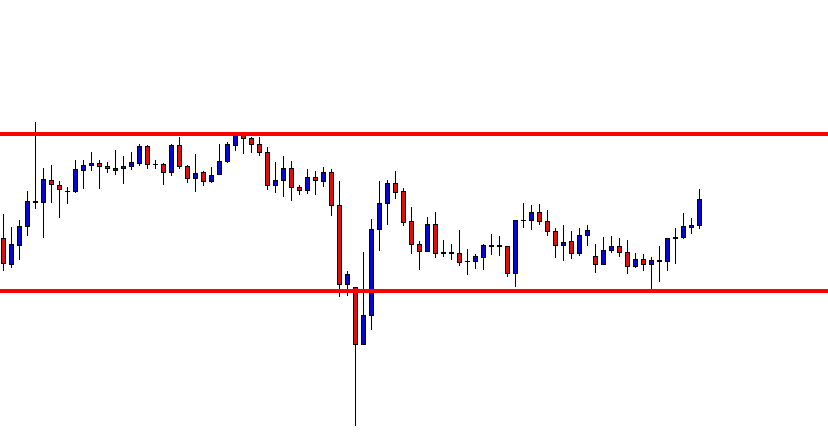
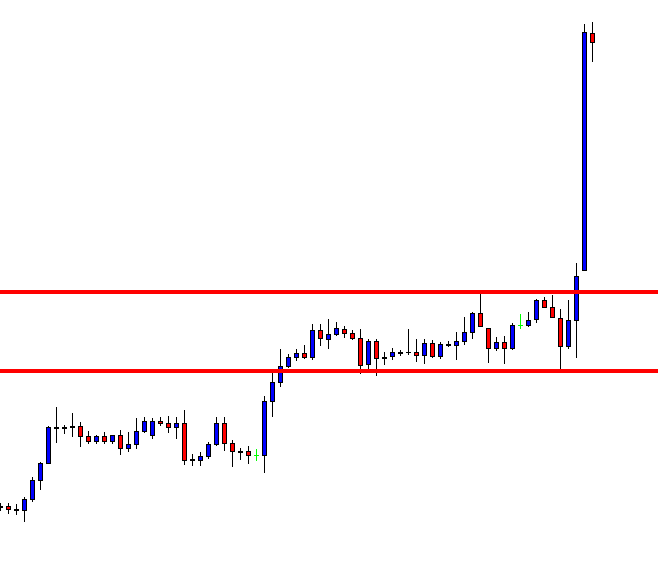
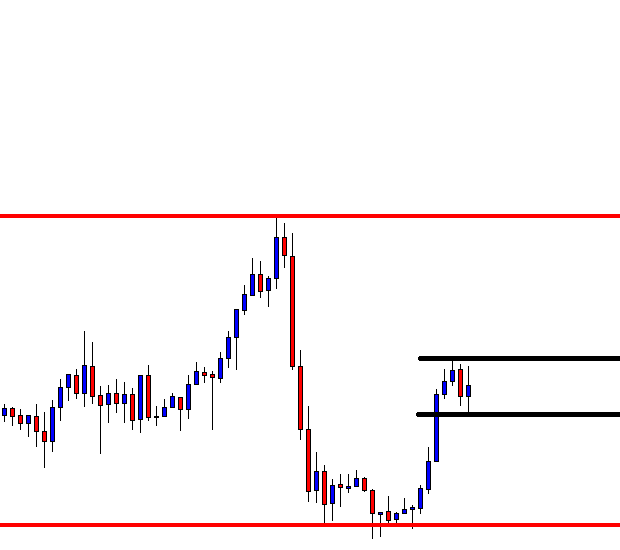
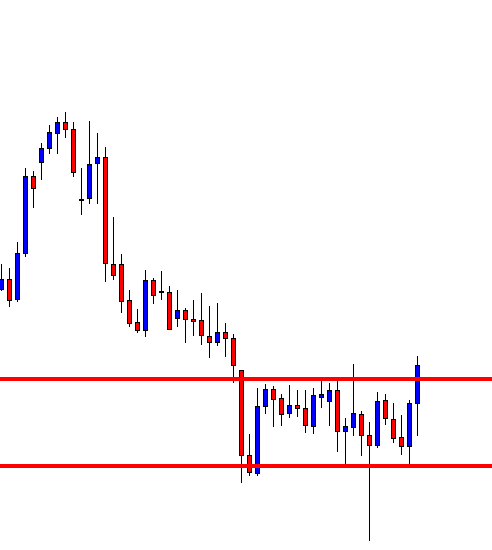
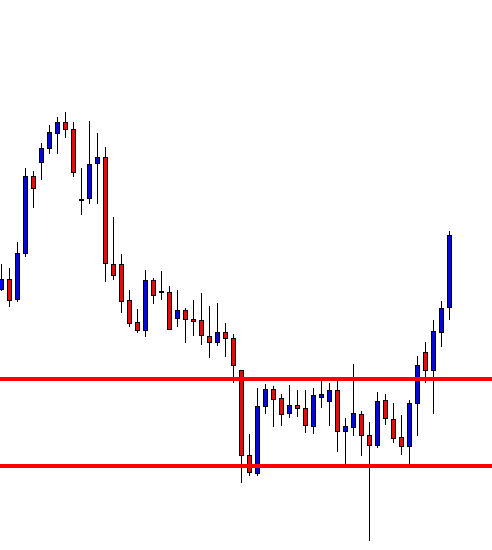
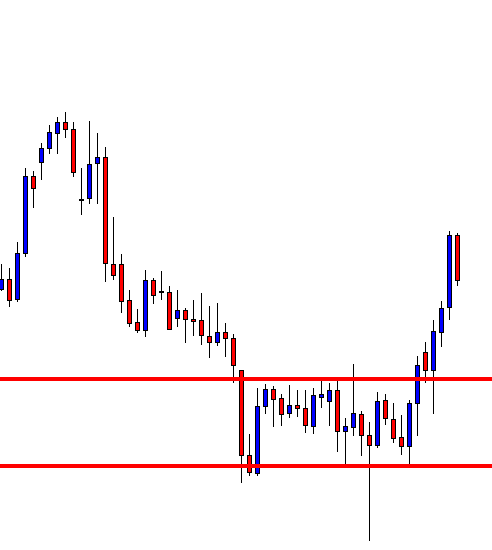
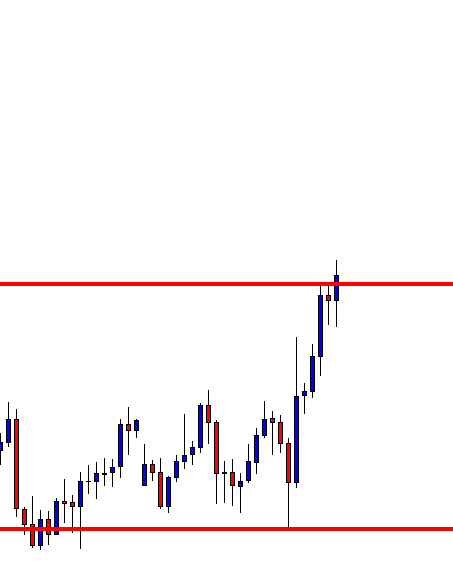
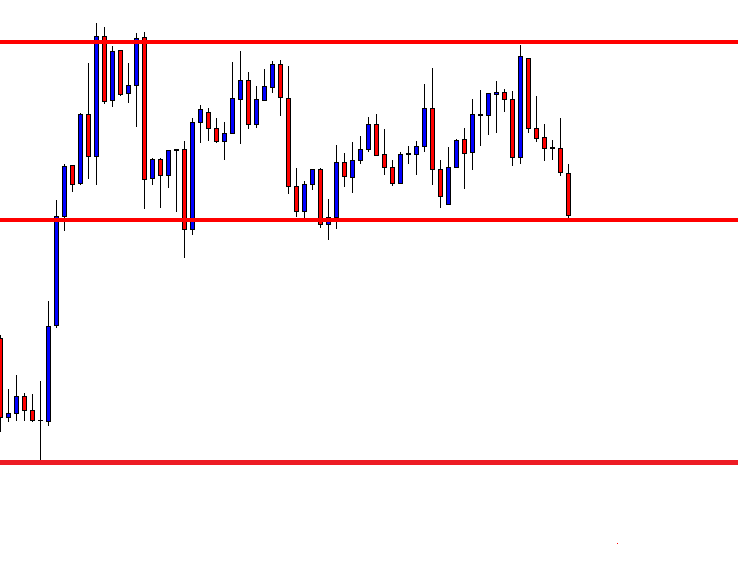
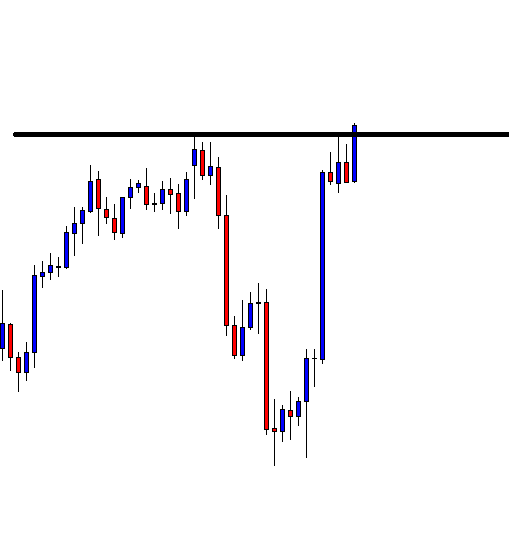
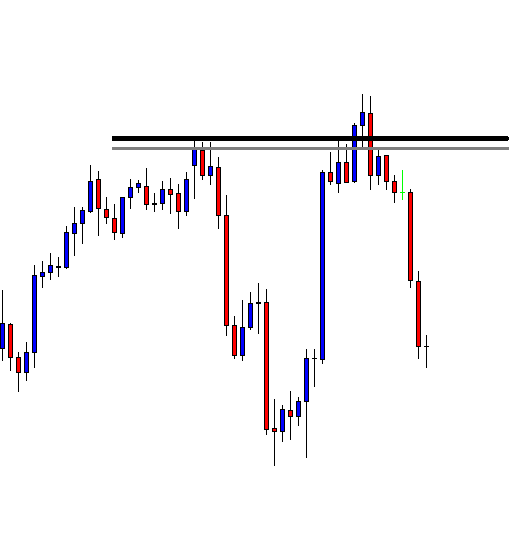
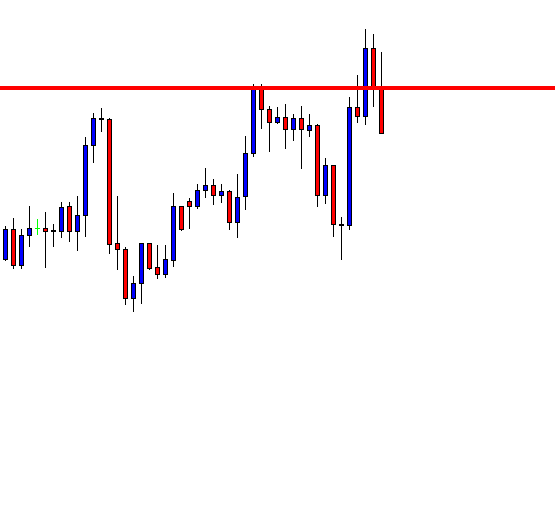
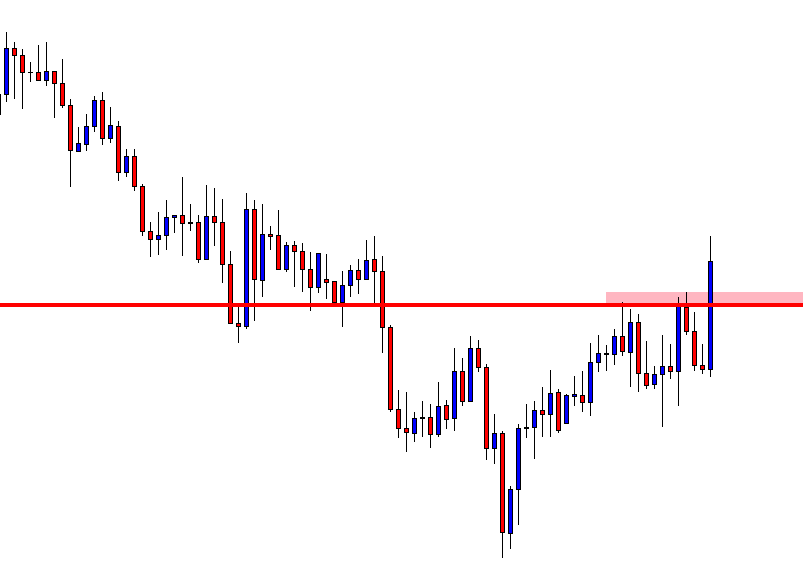
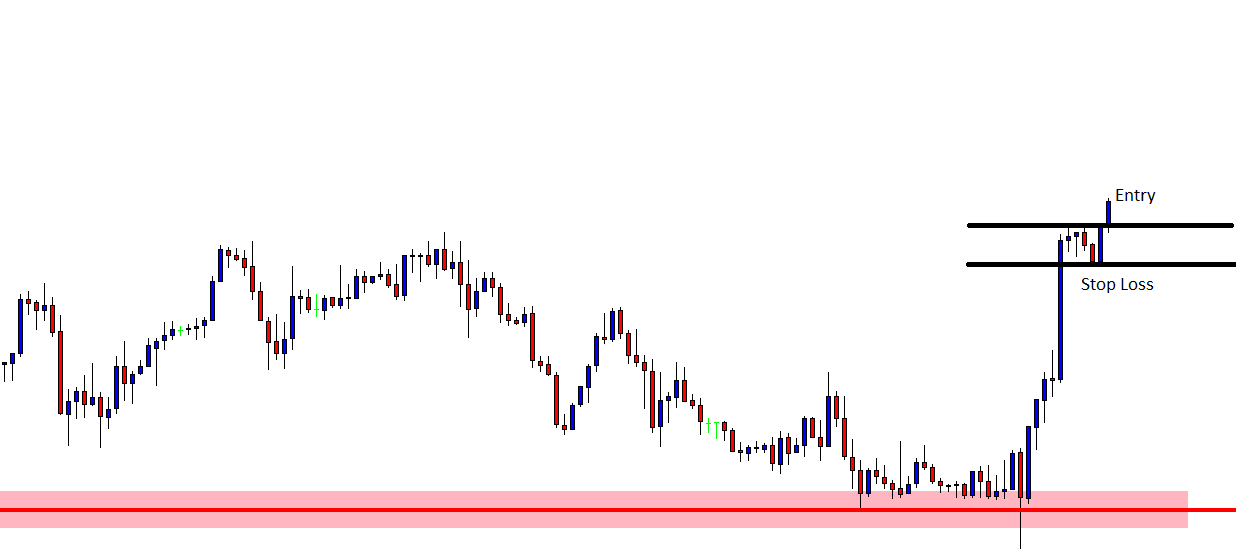
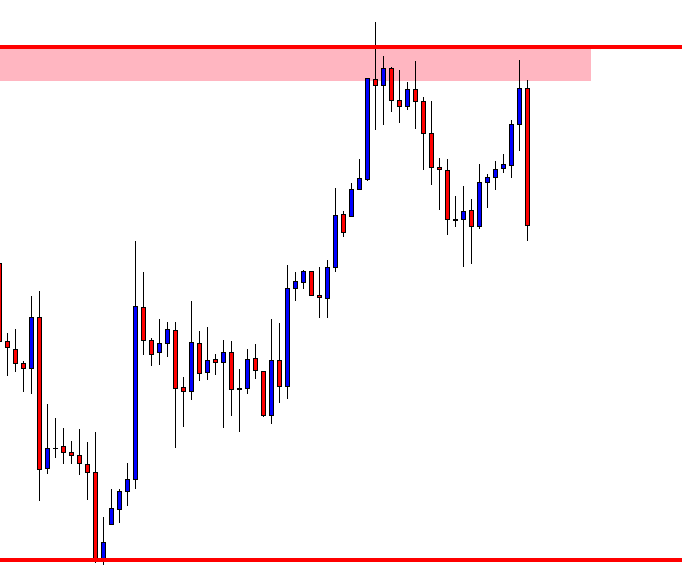
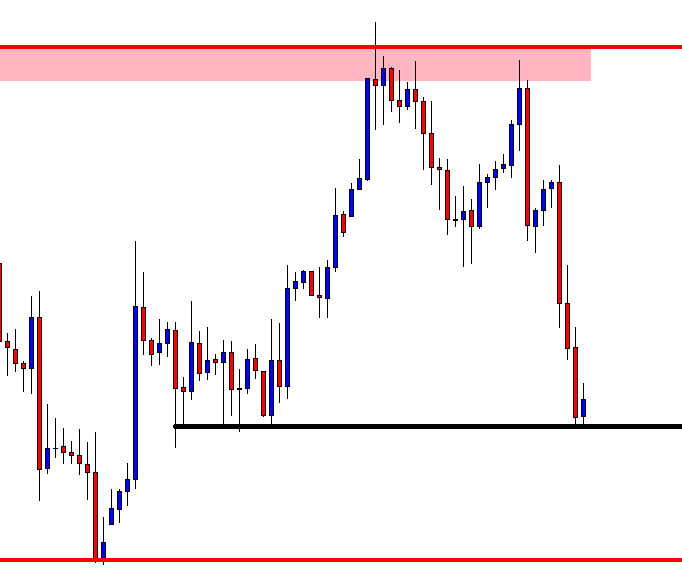
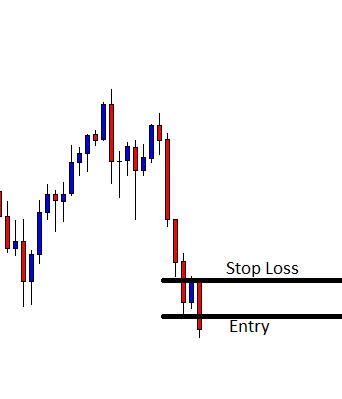
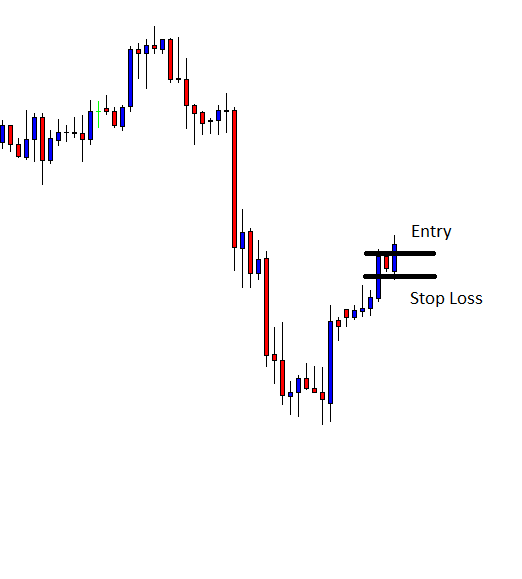
A trader should be entering the market when the price action holds at the significant support resistance area as it confirms that the levels are active to hold the prices. \

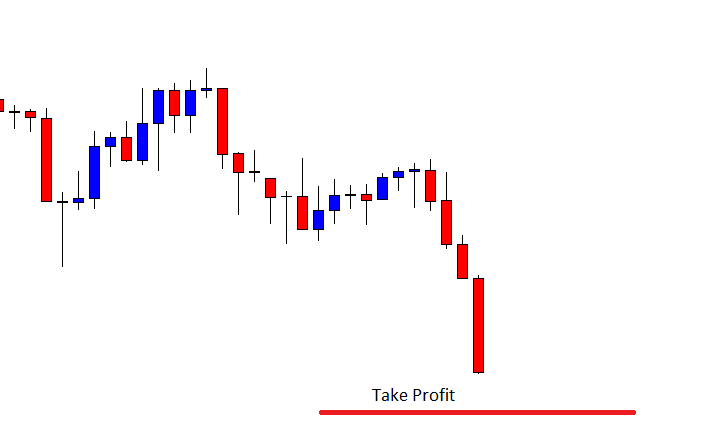
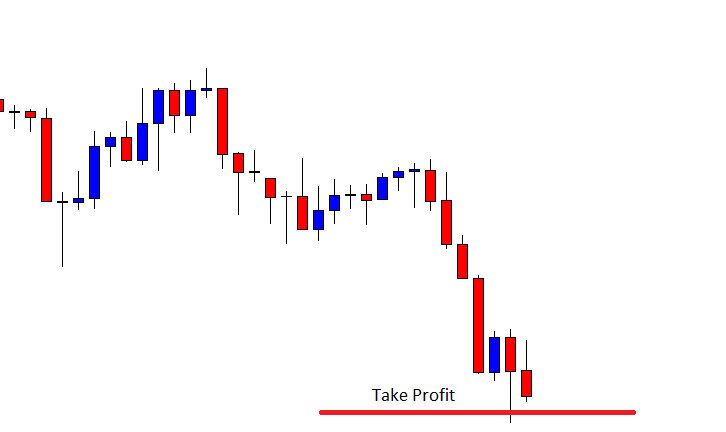
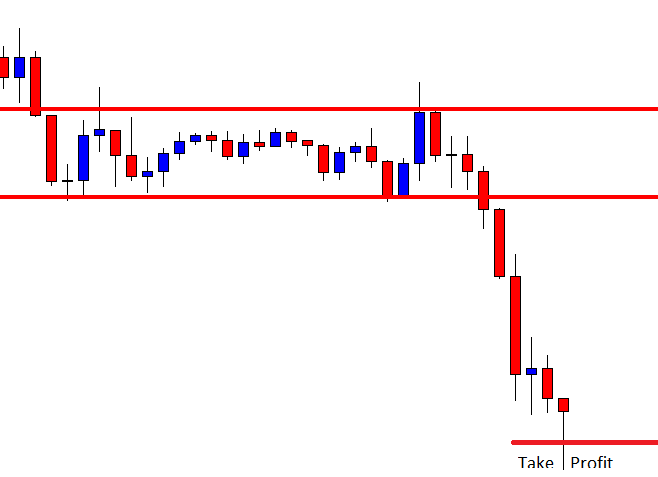
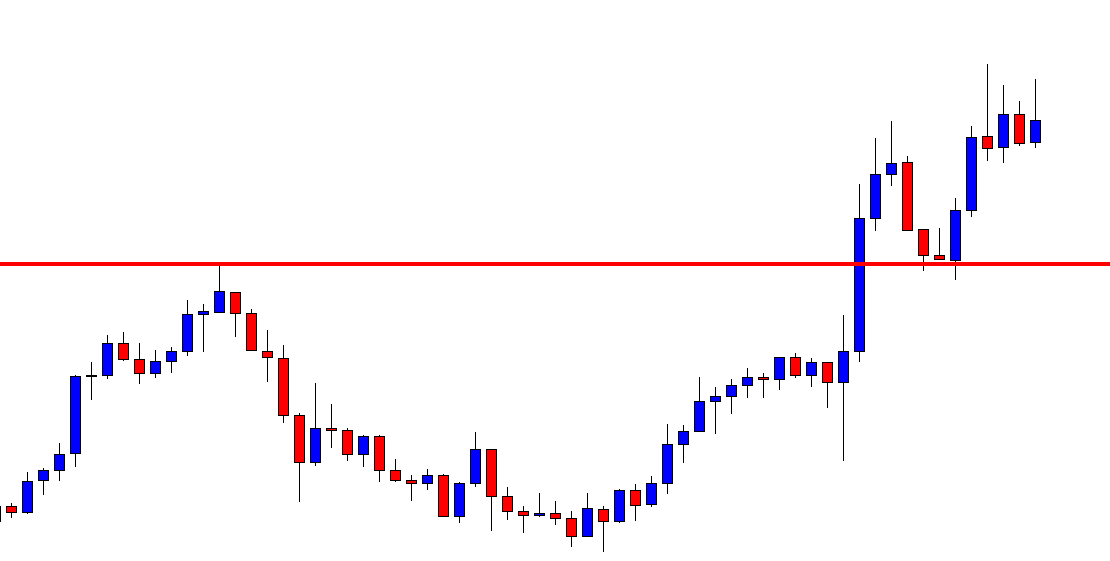
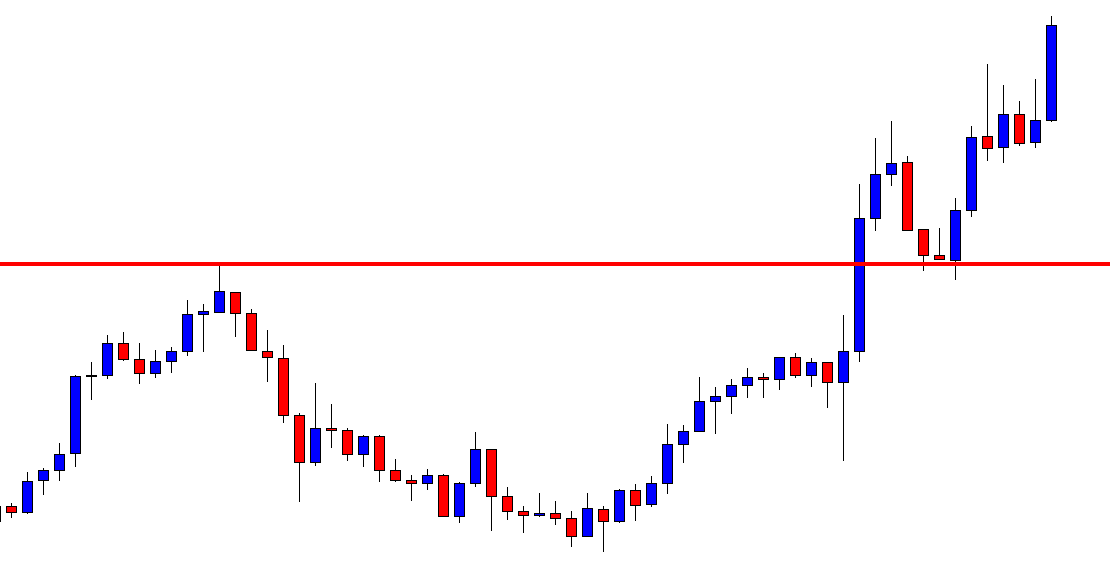
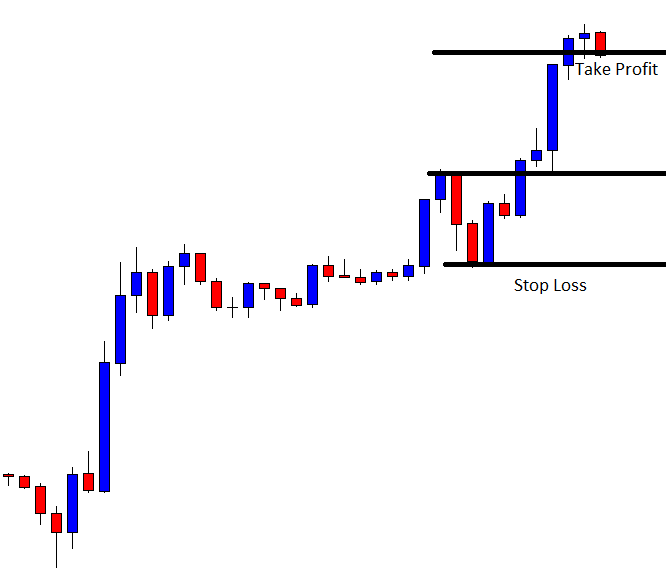
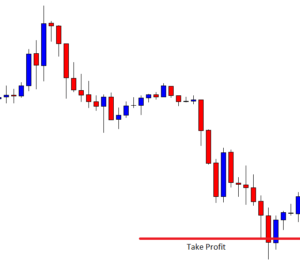
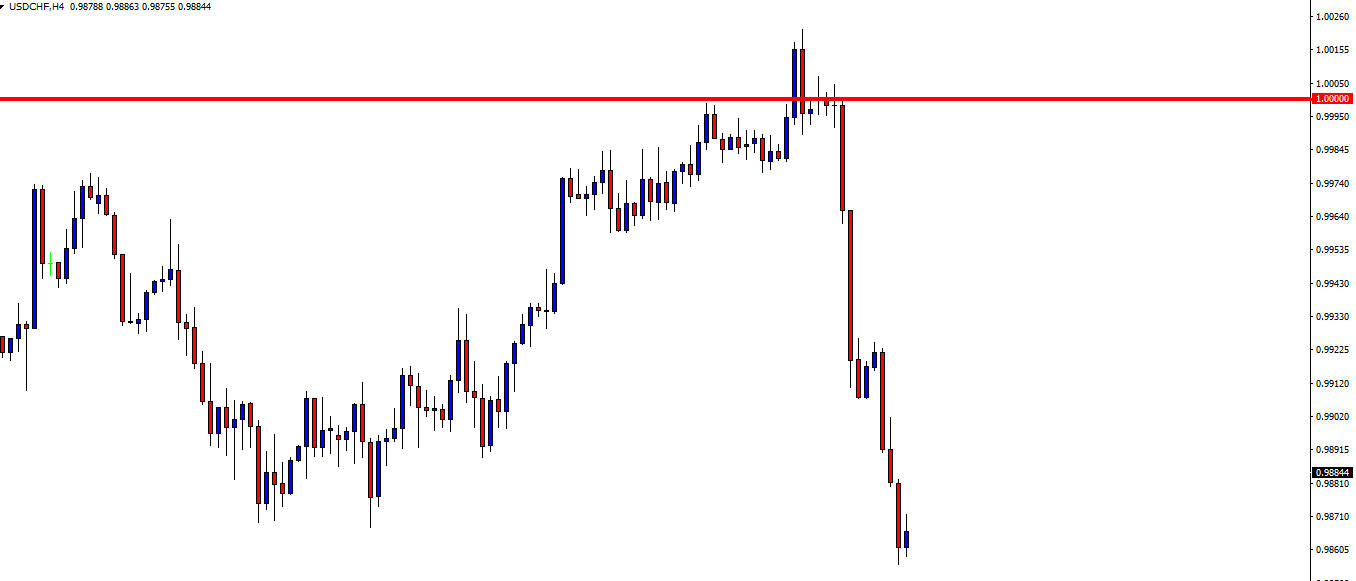
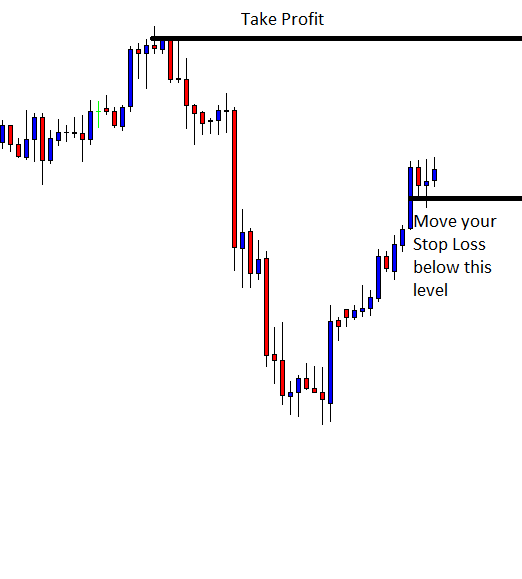
Take profit placement depends on your trading style. If you are an intraday trader, we suggest you close your position at a recent high. If you are a swing trader, look for another false breakout to load more positions. You can also use the recent high or any support resistance area of the higher timeframe to close all of your positions.

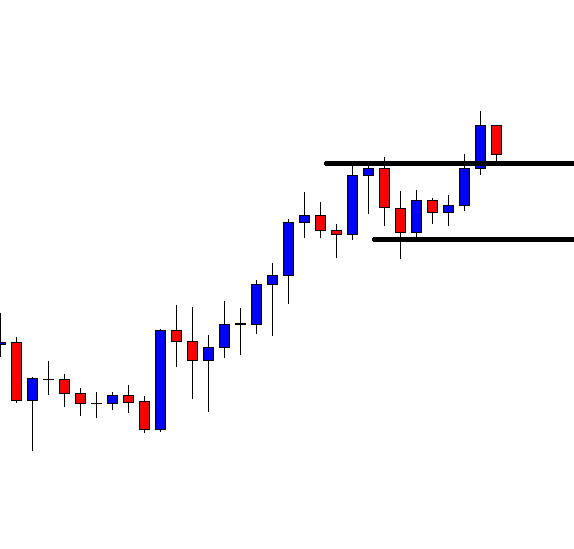
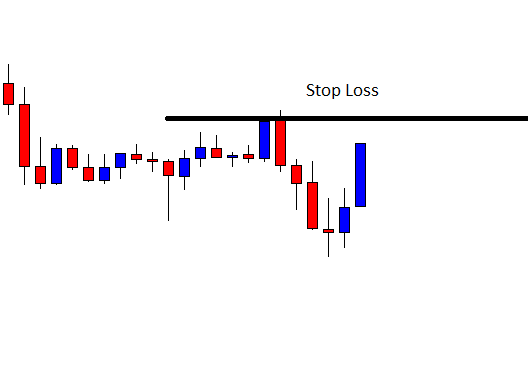
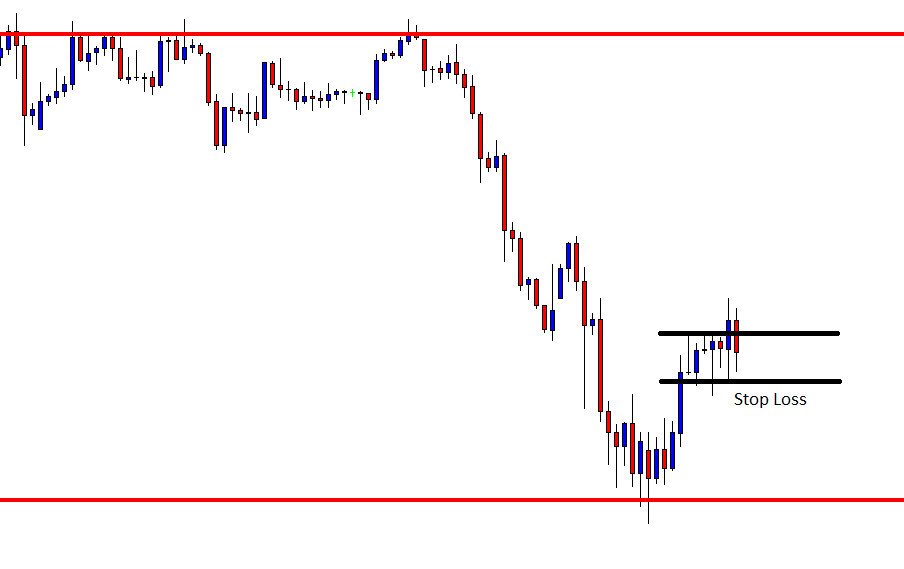
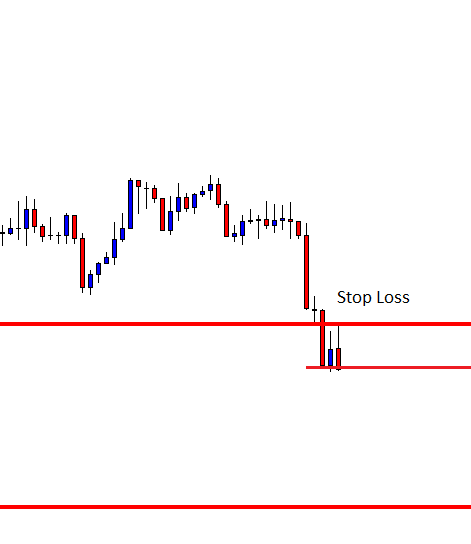
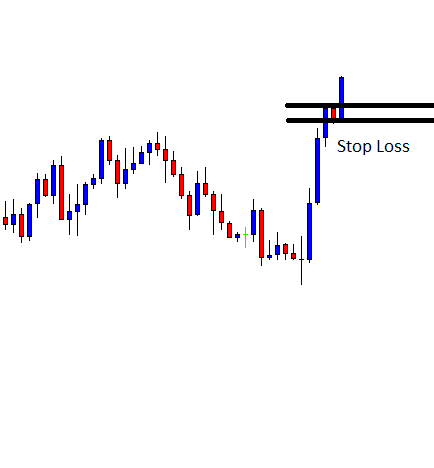
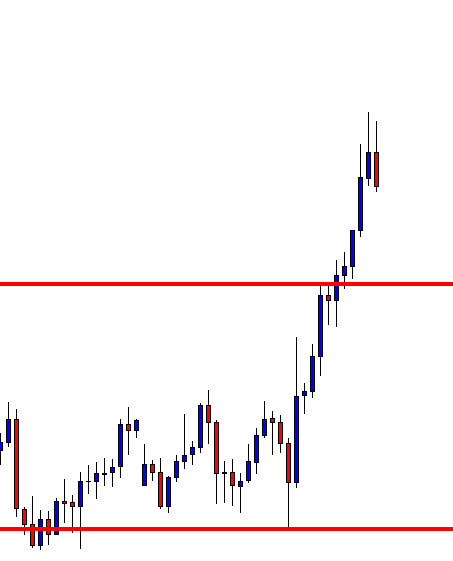
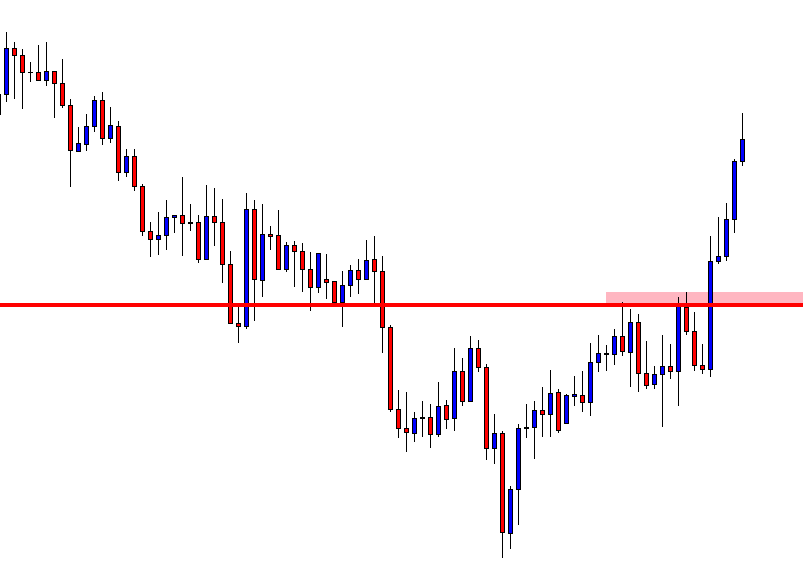
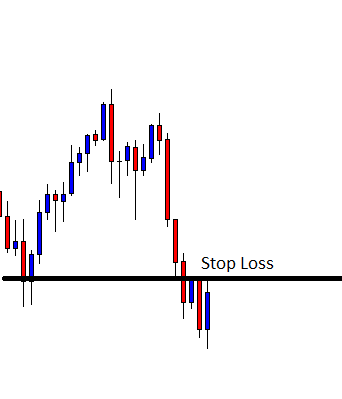
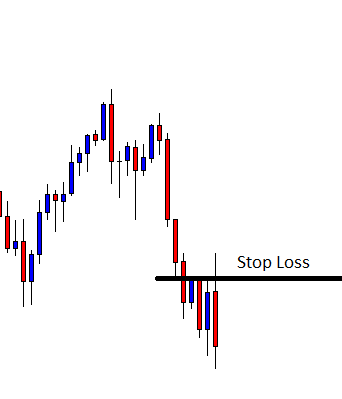
Most of the false breakouts are sure shot trades in the market. Place the stop loss just below the recent low, or at the closing of the most recent candle. If you are a conservative trader, then put stop loss bit spacious to your entry point.

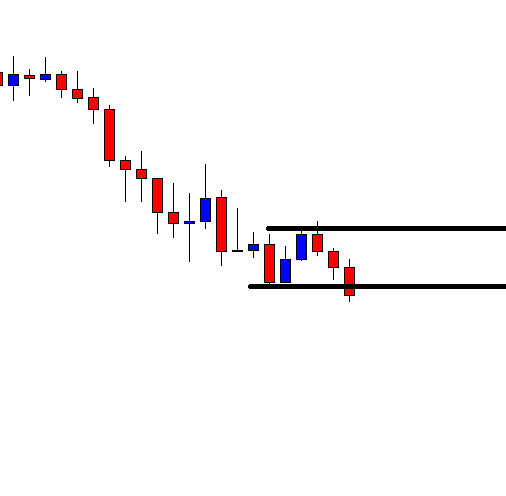
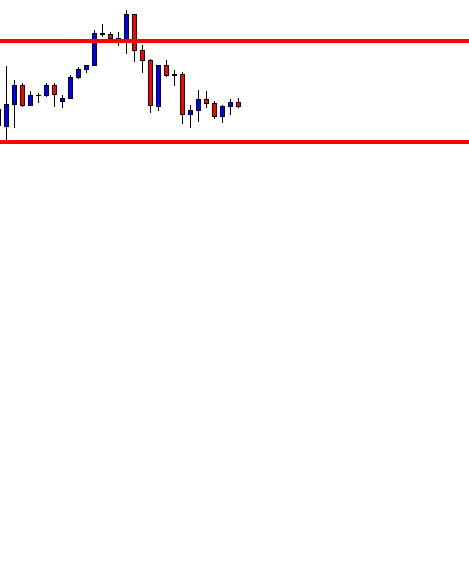
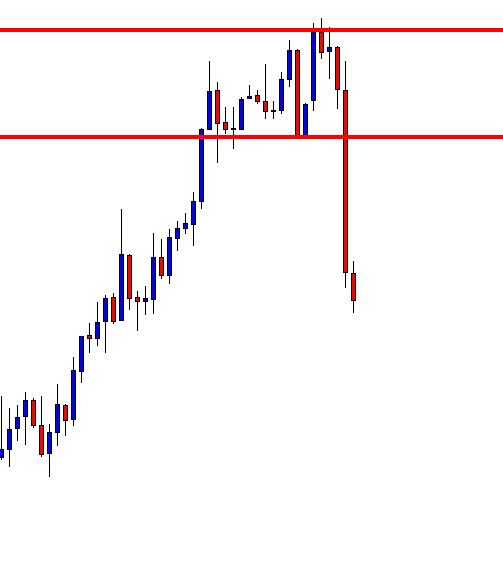
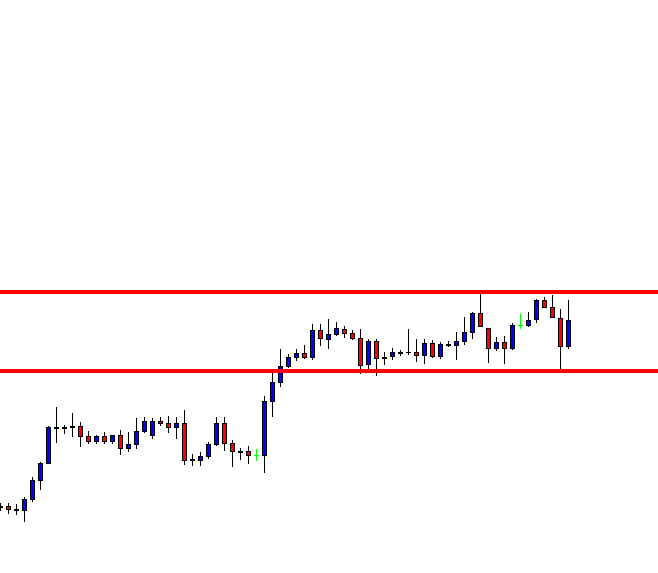
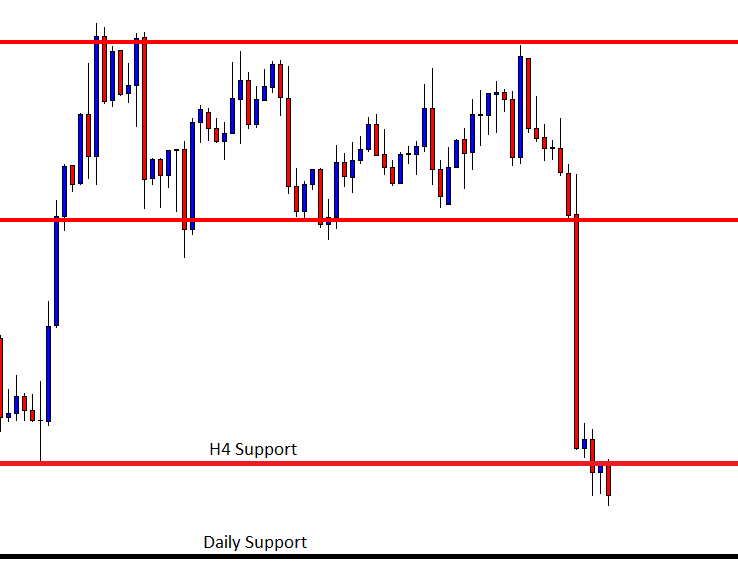
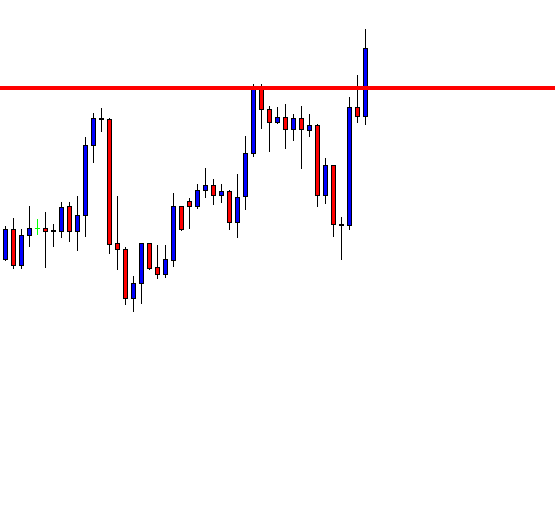
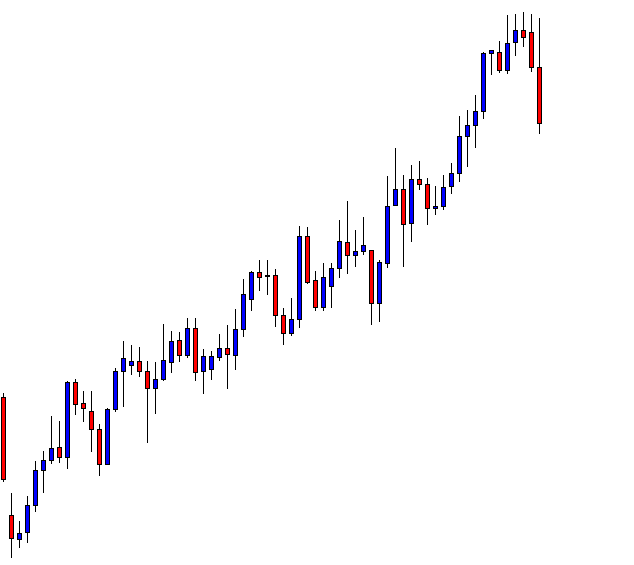
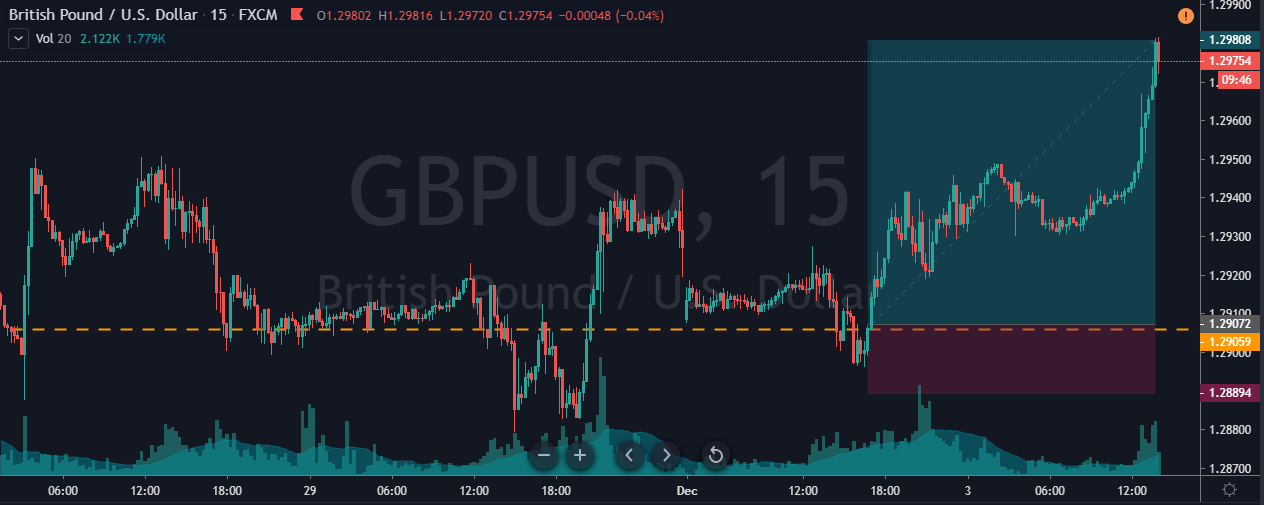
In the below image, we have placed the stop loss just below the closing of the recent candle, and we have captured the 4R trade in the market.

Bottom line

It is essential to learn the logic and psychology behind any false breakout. Most of the time, the risk is small in these types of trades, and it is important not to be greedy while placing more extended targets. If there is no momentum in the market, close your positions, and if the trend is healthy to go for longer moves. You can still trade the regular breakouts, but throw relatively less money when compared to the false breakout trades. Also, make sure to practice trading false breakouts in a demo account until you master it. We hope you liked this article. Cheers!

Categories
Forex Daily Topic Forex Price-Action Strategies

An Old Theory about Support/Resistance

Support and Resistance are the two extremely important components in financial trading. Price action traders rely on them as a critical component of their trading strategies.

Ideally, 90% of the indicators are able to reveal support and resistance levels. An ancient theory of support and resistance says that support becomes resistance and vice versa and interesting point is the theory still works nowadays as well as it did in the past. In today’s lesson, we are going to demonstrate an example of this long-used theory.

In the above figure, the price heads towards the North with good bullish momentum. It pauses at a level of resistance, where the price had a rejection earlier. The equation is simple here. If the price produces a bearish momentum and makes a breakout at the last swing low, the sellers are going to look for short opportunities. In case of an upside breakout, it remains buyers’ territory.

A bullish engulfing candle breaches the resistance. If the price confirms the breakout, the buyers keep dominating here. It seems that the sellers do not have any reasons to be optimistic soon.

The breakout level holds the next candle, as well. This move is a confirmed breakout. However, the buyers are to wait for price consolidation, which gives them a level of support to set stop loss and an upside breakout to trigger an entry.

Oh! No, a bearish Marubozu candle comes back in. All of a sudden, things look a bit different here. The buyers and the sellers both have chances. Let us find out what the price does next.

The price confirms the bearish breakout with an Inside Bar. Look at the last candle on the chart – a bearish engulfing candle forms at the resistance zone. The sellers may flip over to the H1 chart to take a short entry since it is an H4 chart.

The price takes some time to get bearish. It may have been consolidating on the H1 chart for several hours. However, it does get bearish in the end — the price heads towards the South with extreme bearish momentum. The last candle comes out as a Doji candle, which may make some sellers think about taking an exit. However, the way it has been heading towards the downside, most likely it may go towards the last swing low.

The Bottom Line

There are so many strategies, indicators, EAs in the market. It would be tough to suggest if you ask me which one works best. Then again, if I am asked to choose just one strategy, my choice would be “Sell at flipped over resistance; buy at flipped support.”

Categories
Forex Basics Forex Price-Action Strategies

A Story of a False Bullish Breakout

In today’s lesson, we are going to demonstrate an example of a short entry that is derived from a false breakout. It contains two lessons. Let us get started.

The price heads towards the North and makes an upside breakout. The buyers are to keep their eyes on the pair to go long upon consolidation and bullish reversal candle at the breakout level. Let us find out what happens next.

Wow! This is a copybook corrective candle, which closes right at the breakout level. A bullish reversal candle followed by a breakout at the highest high would get the buyers engaged in buying the pair.

The buyers might not have even thought about it. They are to let the sellers dominate in the pair, while sellers should wait for the breakout confirmation and a bearish reversal candle to go short on the pair. However, they have to calculate that the last swing low is not too far.

The price keeps going towards the South without having apposite consolidation. It consolidates just before the support. The price has been bearish but has not offered any short entry on this chart. Meanwhile, it has made another bearish breakout. The sellers shall be hopeful again. Look at the chart below.

This is an explicit breakout, and the next candle confirms it. The consolidation and the price breakout at the lowest low would be a signal to go short. Let see what the price does this time.

Price action traders have been waiting for this. The price consolidates and makes another breakout. By setting Stop Loss above the resistance, an entry may be triggered right after the last candle closes.

This is how it goes. The price produces consecutive four bearish candles. The very last candle comes out as an Inside Bar. Most traders may come out with their profit; some may still hold their trade by locking some profit.

 Lessons

We learned two lessons from here

  1. False breakout usually drives the price towards the opposite direction.
  2. Risk-reward is always a factor. It does not offer an entry within the first support since risk-reward is not lucrative. It offers an entry on the second breakout, where there is not support nearby.

The Bottom Line

In the beginning, it may sound too many things to remember in price action trading. It is right to some extent. However, if we practice hard, study with the recent price behavior on the chart with as many pairs as we can, surely it will get easy for us.

Categories
Forex Chart Basics Forex Daily Topic

Caution! A Big Round Number Ahead

In today’s lesson, we are going to demonstrate an event to find out what the price may do around the big round number. A big round number plays a significant role as far as traders’ psychology is concerned. The price usually gets volatile around a big round number. It may get tough for the traders to find out entries around the big round number. Let us now dig into USDCHF recent activities around the big round number 1.00000.

The price is heading towards the North with good bullish momentum. Look at the last candle. This is one good bullish candle, which states that the buyers are dominating the pair. Do you notice anything unusual here?

Here it is. The candle breaches through the level of 1.00000. As a trader, you must not miss such a big round number. Now that the price makes a breakout, you are to wait for the breakout confirmation and a strong bullish reversal candle to go long on the pair. This might be one of the best trades in your trading life if things go accordingly.

The price comes back in. However, it still looks all right for the buyers since if we consider the spikes at the last swing high. A bullish engulfing candle closing above the last bearish candle would be the buying signal. On the other hand, if it keeps going towards the downside, the sellers may take over the baton.

The price does not produce any bullish momentum. For the last four H4 candles, it could go either way. Traders are to wait patiently since this is the game around a massive round number.

Here it comes. It has now become sellers’ territory. The candle forms right at the level of 1.00000. The level could have been a level of support. It is now a level of resistance. The sellers on the minor charts keep going short; on this chart, they are to wait for consolidation and downside breakout to ride on the next bearish wave.

It consolidates and produces a sell signal after four H4 candles. The last H4 candle suggests it may be time for the price to consolidate again. An explicit bullish breakout at the level of 1.00000, did not work for the buyers. It could happen at any level, but when we deal with a massive round number, we happen to see it more often.

The Bottom Line

The market runs on many aspects, and traders’ psychology is one of them. Many traders set their Stop Loss and Take Profit at round numbers. Thus, the price may get extra volatility around a big round number. We may get breakout even on the H4 chart, which may turn out to be a fake breakout. We must remember this every time we see a big round number.


Categories
Forex Basic Strategies

No Breakout Confirmation or No Consolidation Means No Entry

Price Action traders crave for the breakout. Breakout is one of the most important components of price action trading. However, there is another equally important thing, which is breakout confirmation. Since the Forex market is very action-packed, it is often found that the price does not come up to the breakout level to confirm the breakout. It consolidates and produces a reversal candle to offer entry. The question is, does it always consolidate and offer an entry.

Let us find out.

The price headed towards the South and seems to have found its support. It has been heading towards the North now. The price is at the last swing high. Thus, the buyers are to wait for an upside breakout and breakout confirmation to take a long entry.

The price makes a breakout, but at the time of confirmation, it comes back in. Thus, the breakout is void. It goes towards the upside again. This time it gets rejected from the last swing high. Thus, the price does not make any breakout here.

This time it does. A huge bullish engulfing candle breaches the last swing high. That is a Double Top resistance as well. The buyers are to wait for the price to come back at the breakout level and get a bullish reversal candle right there. Alternatively, it may consolidate somewhere in between the highest high and the breakout level.

It keeps going up. Let us not give up but keep eyeing on the pair. It has gone too far up. It may not come back at the breakout level. It may rather consolidate. Let us find out what it does.

It keeps going towards the North. There is no sign of consolidation yet. A swing high on the chart is evident, which is nearby. As things stand, risk-reward is getting less lucrative.

As expected, the price has found its resistance before the level of the last swing high. The price action gets choppy. Traders are to wait for the price to give them the next direction. In a word, price action traders do not keep this kind of chart on their watch list.

The Bottom Line

A chart looked extremely good and was about to give us an entry ended up being a choppy chart. What more frustrating is it went towards the desired direction, but it did not offer us entry. Some traders may think it would be good if an entry is taken. At least some pips can be achieved. Please note, do not even think about it. After breakout, the price must confirm the breakout or consolidate. To sum up the whole equation, no confirmation or no consolidation means no entry.

Categories
Forex Basics Forex Daily Topic

A Breakout Brings More Momentum than any Other Trading Factor

A Breakout Brings More Momentum than any Other Trading Factor

A bearish engulfing candle at a Double Top or consolidation resistance is an excellent signal to go short. However, if a bearish engulfing candle closes right within the support level, it sometimes may create an upside momentum on the minor charts. In today’s article, we are going to demonstrate an example of that.

The price heads towards the North with strong bullish momentum. Ideally, traders are to look for opportunities to go long here upon consolidation, followed by upside breakout. The last candle comes out as a bearish candle. It may consolidate and make an upside breakout as things look. Let us go to the next chart to find out what happens next.

The pair produces a bearish engulfing candle. Several rejections and a bearish engulfing candle suggest that traders may want to go short on the pair. If they’re going to go short from here, they are to flip over to the H1 chart since it is an H4 chart. For a reason, I am not showing the H1 chart since the H4 chart itself tells the story that I want to share. Let us look at the H4 chart with another equation.

The candle closes right at a level where the price has bounced earlier. This is an explicit support level, which may play an essential part in the minor charts. Soon we find out how the pair reacts from here.

Look at the last candle. The candle comes out as a bearish engulfing candle. However, look at the upper shadow. It goes up to the consolidation resistance. With some brokers, because of the high spread factor, some traders’ Stop Loss may be swept away. The last candle, after having a strong rejection at around the resistance level, closes below the support. The sellers are to flip over to the H1 chart, wait for consolidation and bearish breakout to go short on the pair.

Again, I am presenting the H4 chart to show the next price movement.

The price does not look back this time. It heads towards the South with strong bearish momentum. The H1 chart may have offered some entries, as well. What lesson do we get from these examples?

  1. In an H4-H1 combination, after an H4 reversal candle, traders are to flip over to the H1 chart to take an entry.
  2. The last swing high or swing low on the H4 chart is to be counted.
  3. If the reversal candle closes right within the last swing high or swing low, it may push the price towards another direction, produce spike and sweep away our Stop Losses.
Categories
Forex Psychology

What Wastage of Time!

The H4-H1 combination is one of the best combinations to trade for intraday traders. The H4 chart is the most consistent intraday chart in the Forex market. The H1 chart integration with the H4 chart offers many reliable entries. However, it is often seen that the H4 chart doest its part, but the signal never comes on the H1 chart. In today’s lesson, we are going to demonstrate an example of an H4-H1 chart combination, which is about to give us entry, but it ends up not producing a trading signal. Let us find out how the story goes.

The price after being bullish on the H4 chart, it has several rejections at a level. The last bearish candle gets rejected at a Double Top resistance. The sellers are to flip over the H1 chart and wait for the H1 consolidation and H1 bearish breakout to go short. However, it is an Inside Bar. It may not attract the sellers that much. Let us proceed to the next chart.

This is the H4 chart, as well. The price does not head towards the South on the H1 chart. It rather produces an H4 bullish candle followed by an H4 bearish engulfing candle. This time it may attract more sellers to be keen on selling opportunities. They are to flip over to the H1 chart again. Let us have a look at how the H1 chart looks.

This is the H1 chart. The last candle comes out as a bearish engulfing candle. The sellers are to stick with the chart to wait for consolidation and to get a breakout to go short. The waiting game starts.

The price keeps going towards the South without having any consolidation. Since the sellers do not find new resistance, thus there is no entry for them yet. Let us not give up but wait for consolidation.

The consolidation starts, but it does not make any H1 breakout to make the new lowest low. It rather finds a level of support where it has several bounces. It is a ‘Double Bottom’ support. The way things look now, it may head towards the North if the price breaches the neckline. All anticipations and hopes have gone in vain. Some traders may think, “what wastage of time.”

If you think it is a wastage of time, you are far away from being a professional trader. 70% of your trade setup like this may end up not offering an entry. Never think it is a waste of time. Take it easy. Each potential setup does not offer an entry. Concentrate and find out more setups in other pairs. It must be round the corner.

Categories
Forex Psychology

Having the Mindset to Deal with a Frustrating Situation

Patience is one of the most essential components of Forex traders. Traders are to keep patience in every single second. Before triggering an entry, a trader is to find out a trend, key levels, momentum, news events, etc. After all this hard work, he may not be able to take the entry. It is frustrating, but for Forex traders, it is a usual thing. A trader must accept it simply. In today’s lesson, we are going to demonstrate an example of that.

The price heads towards the South; it consolidates and heads towards the North. The price breaches a level of resistance, which the buyers are to keep an eye at for a bullish reversal. Let us proceed to find out how the next chart looks.

The buyers were waiting for the red-marked level to hold the price and produce a bullish reversal. If the level had held the price and pushed the price towards the North breaching the highest high, the buyers would have taken a long entry. They must have waited eagerly, but all went in vain.

The price headed towards the South further and found its support. After finding the support, it heads towards the North again. On its way, it makes a breakout at the highest high of the last bearish wave. The buyers are to keep an eye on this pair again to find a long entry. To take the long entry, the price is to come back at the breakout level, to produce a bullish reversal candle, and to breach the highest high of the last wave.

This time it looks good. A candle closes within the level of support. The buyers are to keep an eye to get a bullish reversal candle first. This means they have to be patient again. Let us proceed to find out what happens next.

The level produced a bullish reversal candle, but it did not breach the highest high. It instead came down and breached the support level. In a word, all efforts have gone in vain. What wastage of time!

                   The Bottom Line

If you want to take trading seriously as a business or a consistent source of income, you must not think that it is a wastage of your time. It is an investment. Traders must be patient and not be frustrated when opportunities are lost or do not come as per expectation. They must deal with it professionally.

The bad thing is it does not come with practice or experience. The good thing is it is all about mindset. Even a beginner may have a mindset to deal with a situation like this, whereas it might frustrate a trader with five years of experience. We must remember that if it frustrates too much, it hurts trading performance.


Categories
Forex Basic Strategies

The H4-H1, an Action-Packed Combination

In today’s lesson, we are going to demonstrate an example of the H4 and the H1 chart combination for taking entries. Both are intraday charts. A large number of traders do the job using those two charts. Thus, it is an excellent combination to trade in the Forex market.

Let us get started.

This is an H4 chart. The chart shows that the price heads towards the North. On its way, it made an upside breakout, which may play a vital role in pushing the price towards the North further. Despite having a long lower shadow, the last candle comes out as an Engulfing candle. The price may start its correction this time.

As expected, the price comes down to the flipped support and produces a bullish engulfing candle. The last swing high is far enough to offer a 1:1 risk-reward. However, we do not take an entry right after the candle H4 closes. We rather switch over to the H1 chart.

This is how the H1 chart looks. It shows that the price starts having correction by producing a Doji candle. An engulfing bullish candle closing above the Doji candle is the signal to go long here. Let us wait for a Marubozu bullish candle.

This is one good-looking Marubozu bullish candle. However, it closes right at the resistance zone. Risk-reward is 100:0 here. We must wait for an H1 consolidation and breakout towards the upside to take a long entry.

Here they come. The price consolidates and produces an H1 bullish candle, which closes above the resistance. Traders may trigger a long entry right after the candle closes by setting stop loss below the last support. The H1 chart does not show any resistance nearby. Thus, the price may head towards the North with good bullish momentum. It may get us 1:2 risk-reward or even more. Usually, the price reverses once 1:1 risk-reward is achieved. Let us find out what happens here.

The price consolidates much earlier than our expectations. Our reward is not achieved. Thus, we keep holding our position. We are risking a loss here. However, we must keep our patience.

The price makes another upside breakout and heads towards the North. The wave gets us our expected reward and starts having a pullback. If we have not set our take profit, we may manually close it; or we may use a trailing stop loss. We will demonstrate some examples of using trailing stop loss in this combination in upcoming lessons.

The Bottom Line

The H4-H1 combination is an eventful combination. A Trader needs to have skill, expertise, experience, and patience to handle it. Once he learns it well, it may have his hands full in making money by trading.

Categories
Forex Basic Strategies Forex Daily Topic

A Story of an Early Exit

Risk-Reward is a factor, which every successful trader takes care of. Before choosing a chart to take an entry, the first thing that is to be considered is the trend, then the risk-reward factor. Once we have set our Take Profit and Stop Loss level, we shall leave the entry either to hit the Stop Loss or the Profit Target. However, today, we are going to demonstrate an example of an early exit.

This is an H4 chart. The chart shows that the price has found its support as well as a resistance zone. After having a final rejection, it makes a move towards the downside. Then, it heads towards the North now (see the next image). Another rejection and bearish reversal candle at the resistance zone may produce a short entry.

The last H4 candle is bullish. However, the candle closes within the resistance zone. It may go either way. The buyers may get an upside breakout; the sellers may get a bearish reversal. Let us proceed to find out what happens next.

In the above chart, we can see one good-looking bearish Marubozu candle. The candle suggests that the sellers may wait for consolidation and downside breakout to take a short entry. The candle forms at a Double Top resistance as well. The price may consolidate around the neckline level.

As expected, the price starts having correction around the neckline level. It needs to find its resistance and produce an H4 bearish reversal candle along with a breakout at the neckline.

Here it comes. The last candle engulfs all the candles by closing below the neckline. An entry may be triggered right after the candle closes. The price has enough space to travel down to the red-marked line, which allows an excellent risk-reward. However, there is a support level in between, that may hold the price for a while.

The price heads towards that level with good bearish momentum. The way it has been going, it may hit the red-marked level within four/five H4 candles. This means one more trading day may be required to hit the original Take-Profit level.

The in-between level is a vital level, which produces the H4 bullish reversal candle. The price has reacted several times at that level earlier. Usually, we must stick with our original Profit-taking target. However, it is also legit to close our entry right after the last candle closes. A question may be raised “why do we close our entry here?”

Reasons for Early Exit

There are two reasons

  1. The support level is significantly strong
  2. The current bar is the last H4 Friday’s candle, which means the market closes once the candle is finished.

The Bottom Line

When using the Weekly and the Daily charts, traders are to let their opened positions to reach the target during the weekend. However, intraday traders should consider closing their floating trade before the week’s end. Mondays often start with a big gap, which may hurt intraday Stop Losses.


Categories
Forex Basics Forex Daily Topic

A Winner is Not Always a Good Trade

Price action traders use chart combinations such as Weekly-Daily, Daily-H4, H4-H1, and H1-15M, etc. Intraday minor charts’ traders such as the H1, 15M, 5M do not have an undeviating relation with the daily chart. However, it is often seen that if the daily price action is choppy, it gets tough to find out a good entry for the intraday traders. Notably, on a choppy daily chat, it gets extremely tough for the H4 traders to find an entry with good risk-reward. Thus, even a trade that gets us profit may not always be a good one. Let us demonstrate an example of that.

This is a daily chart, which shows that the price action has been choppy. It gets caught within a bullish rectangle. The daily traders are to wait for a breakout. However, the H4 traders know the range. Thus, they are to wait for a daily bearish reversal at the resistance zone and bullish reversal at the support zone. Let us see where it produces the next reversal.

The chart produces an Inverted Hammer right at the resistance. The H4 traders are to flip over the chart; wait for consolidation and bearish breakout to take a short entry. The risk-reward looks good here.

The H4 chart shows the last candle comes out as a bearish candle. If the price consolidates with the support of the candle’s lowest low, a bearish breakout will be the signal to go short.

The next candle comes out as another bearish candle. The candle has a bounce at H4 support, as well. If the price consolidates and makes a bearish breakout, the sellers may take a short entry. There is still space for the price to travel towards the downside.

The price consolidates and makes a breakout at the support. The breakout candle looks good. By setting Stop Loss at the consolidation resistance, a short entry may be triggered right after the last candle closes. Take Profit shall be placed at the red-marked level. Let us find out whether it hits Take Profit.

It does. It gets us profit. The question is whether it is a good trade or not. As far as risk-reward is concerned, it is not a good entry. It gets us less reward than the risk. Thus, traders shall skip taking that entry in the first place.

The Bottom Line

Price action traders may find many trade setups that match with all the norms for taking an entry. However, they must consider risk-reward on every single trade. If it offers less than 1:1 risk-reward, they shall avoid taking that entry. In most cases, an entry offering less than 1:1 risk-reward has less chance to be a winning trade as well. In this example, it is a winner. However, considering entire facts, it is not a good entry.

Categories
Forex Psychology

Experiencing a Losing Trade

A losing trade hurts. Beginners find it tough to encounter losing trades. However, in the Forex market, losing is inevitable. The market is so action-packed that even an experienced trader often makes mistakes. Sometimes, even a good entry may not get us any profit. In today’s lesson, we are going to demonstrate an example of a good entry, which ends up being a losing trade in the end.

The price heads towards the North and makes a pullback. Traders are to wait for an upside breakout to take a long entry. A bullish Engulfing candle follows a Doji candle. As things stand, the buyers are to take the control soon upon an upside breakout.

Things are different now. The price comes down instead, by making a Double Top. It starts having the correction as well. Consolidation and bearish breakout shall attract the sellers to go short on the pair. Let us see the next chart.

The chart shows that the price is having a correction, where it had a bounce earlier. The equation is very simple here. A bullish reversal attracts the buyers, and a bearish breakout attracts the sellers to go short.

It makes a bearish breakout. The breakout candle looks good. As far as price action and candlestick pattern are concerned, this is an A+ short entry. Concentrate on the marked Stop Loss and Entry levels.

The next candle comes out as a bullish candle. The price may take out some of our entries because of the spread factor. With some brokers, traders pay more spread. Some of our trade (the same entry) may still survive. However, let us not get into this argument but proceed to the next chart. The following chart has an interesting scenario to present.

This should conclude the argument. The price hits the Stop Loss and heads towards the South again. The entry looks to be an A+ entry, but it has ended up bringing us a loss. As usual, beginners with average knowledge of price action may think that something must be wrong with his strategy.

This is not the case. An entry like this would bring us profit at least on 70% occasions. It hurts more since the candle, which hits our Stop Loss itself a strong bearish candle. This is how this market plays. We have to accept it. We must not let our losing trades occupy our thoughts. It is a game of probability of winning and losing. With knowledge, experience, and hard work, a trader can increase the likelihood of winning for sure.

Categories
Forex Basics Forex Daily Topic

Using Trailing Stop: An Art to Be Learned by Traders

Using a trailing stop is a way to lock a profit in trading, at least with some profit. A floating profit trade may not always hit its Take-Profit level. Thus, traders use Trailing Stop to lock-in some profits and let it run to hit the target. Otherwise, some trades may result in a loss instead.

In today’s lesson, we are going to demonstrate an example of that.

The price heads towards the North with good bullish momentum. The buyers are to wait for price correction and bullish reversal candle to go long on the pair. Let us proceed to the next chart to find more about the correction.

The correction looks very bearish. However, a flipped support level holds the price. Thus, it is going to be an interesting battle between the bull and the bear. Let us find out who wins. Does it make a downside breakout or a bullish reversal candle?

The chart produces a bullish reversal candle. We can see that this is an Inside Bar, which is the weakest reversal candle. A flipped support creates a bullish reversal candle but does not make any breakout. The buyers are to flip over to the trigger chart to get consolidation and breakout to go long on this. This is the daily chart. Let us flip over to the H4 chart.

The H4 chart looks suitable for the buyers. The level of support produces a bullish engulfing candle. It has started the price correction. An upside breakout from a good level of support is the signal to trigger a long entry.

The price goes upward and consolidates. Upon finding support, the last candle breaches the level of resistance. Setting Stop Loss below the level of support, an entry may be triggered right after the last candle closes. The Take Profit shall be placed at the highest high of the previous bearish wave.

The price continues to go towards the upside for a while. It has started having consolidation. The price has found its support. An upside breakout is to push the price towards the North further. On the other hand, a downside breakout may push the price towards the South and even change the whole equation. Thus, the buyers are to move their Stop Loss. Have a look at the chart below.

The buyers shall move their Stop Loss below the level of support and hope it makes another upside breakout to hit the Take Profit. Let us find out what happens next.

This is what Forex trading is all about. You never know what exactly happens next. The price comes down. It would hit the Stop-Loss, where it was set at the very outset. By using Trailing Stop, the buyers have made some profit. Otherwise, they would have to encounter some loss.

The Bottom Line

Using Trailing Stop is an art. It needs a lot of practice to be master at it. Without knowing how to use it properly, it may hurt a trader instead. Since it is an important trading feature to save us from encountering a loss with a profit trade, a trader must study/work hard on this.