
The Weekly high or Weekly low plays a significant part in the H4 chart traders. In today’s lesson, we will demonstrate an example of how last week’s high works as a level of support and pushes the price towards the upside by offering a long entry to the buyers. Let us get started.
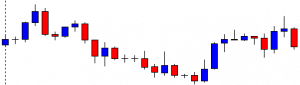
It is an H4 chart. Look at the vertical dotted line. The price starts its week with a spinning top having a bullish body. The price then heads towards the North and come down again. In the end, the price closes its week around the level where it starts its trading week.
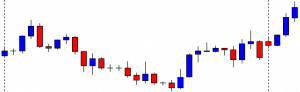
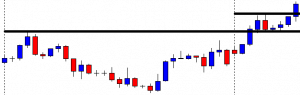
The pair starts its week with a spinning top having a bearish body this time. The price heads towards the North and makes a breakout at the last week’s high. The price usually comes back at the breakout level to have consolidation and ends up offering entry upon producing a reversal candle. Let us draw the breakout level to have a clearer picture.
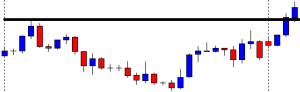
The drawn line indicates the last week’s high. Now, the H4 chart suggests that the price made a breakout, and the pair is trading above the level currently. The buyers are to wait for the price to consolidate and produce a bullish reversal candle to go long in the pair.
The chart produces a bearish candle closing within the breakout level first. The next candle comes out as a Doji candle. The buyers are to wait for a breakout at consolidation resistance to go long in the pair. Let us proceed to the next chart to find out what the price does next.
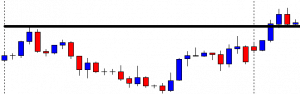
The chart produces three more bullish candles. One of the candles breaches through the level of resistance closing above it. The buyers may trigger a long entry right after the last candle closes. The buyers may set their stop loss below the breakout level. To set the take-profit level, the buyers may set their take profit with 2R. It is the best thing about this trading strategy. It offers at least 2R. Sometimes the price travels even more than 2R. Let us find out how the trade goes.
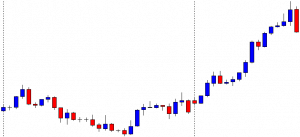
The price heads towards the North with good bullish momentum. Before hitting 2R, it produces a bearish inside bar. It continues its journey towards the North and travels more than 2R. The last candle comes out as a bearish engulfing candle. It suggests that the price may get bearish now.
The best things about using the strategy are
- Traders know where the price is going to consolidate.
- Which level is going to produce the signal candle.
- It offers an excellent risk-reward.