Introduction
In all the previous lessons of pivot points, we considered the traditional pivot points. But this is not the only type of pivot points that are existing. There are three other types to it as well. In this lesson, we shall cover the four different types of pivot points that exist.

Types of Pivot Points
The four types of pivot point are mentioned as follows:
- Traditional Pivot point
- Woodie Pivot point
- Camarilla Pivot point
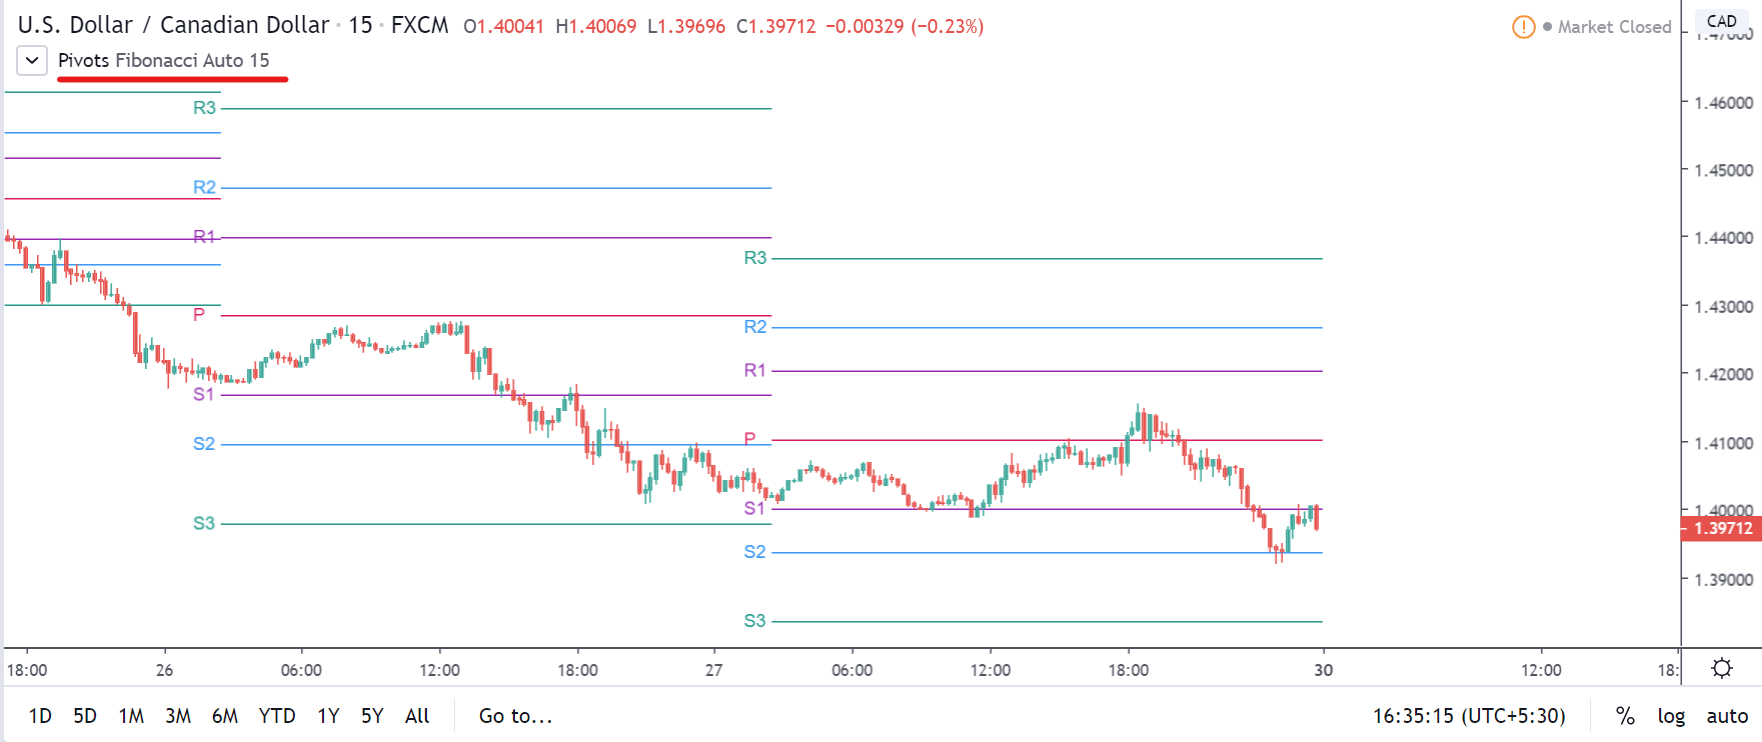
- Fibonacci Pivot point
Since we’ve already discussed the traditional pivot point in detail, we shall be concentrating on the rest of the types. Note that, in all the different types of pivot points we will be studying, the only difference is the calculation of the pivot point levels. As far as the concept to trade using these pivot points is concerned, it remains the same as the traditional approach.
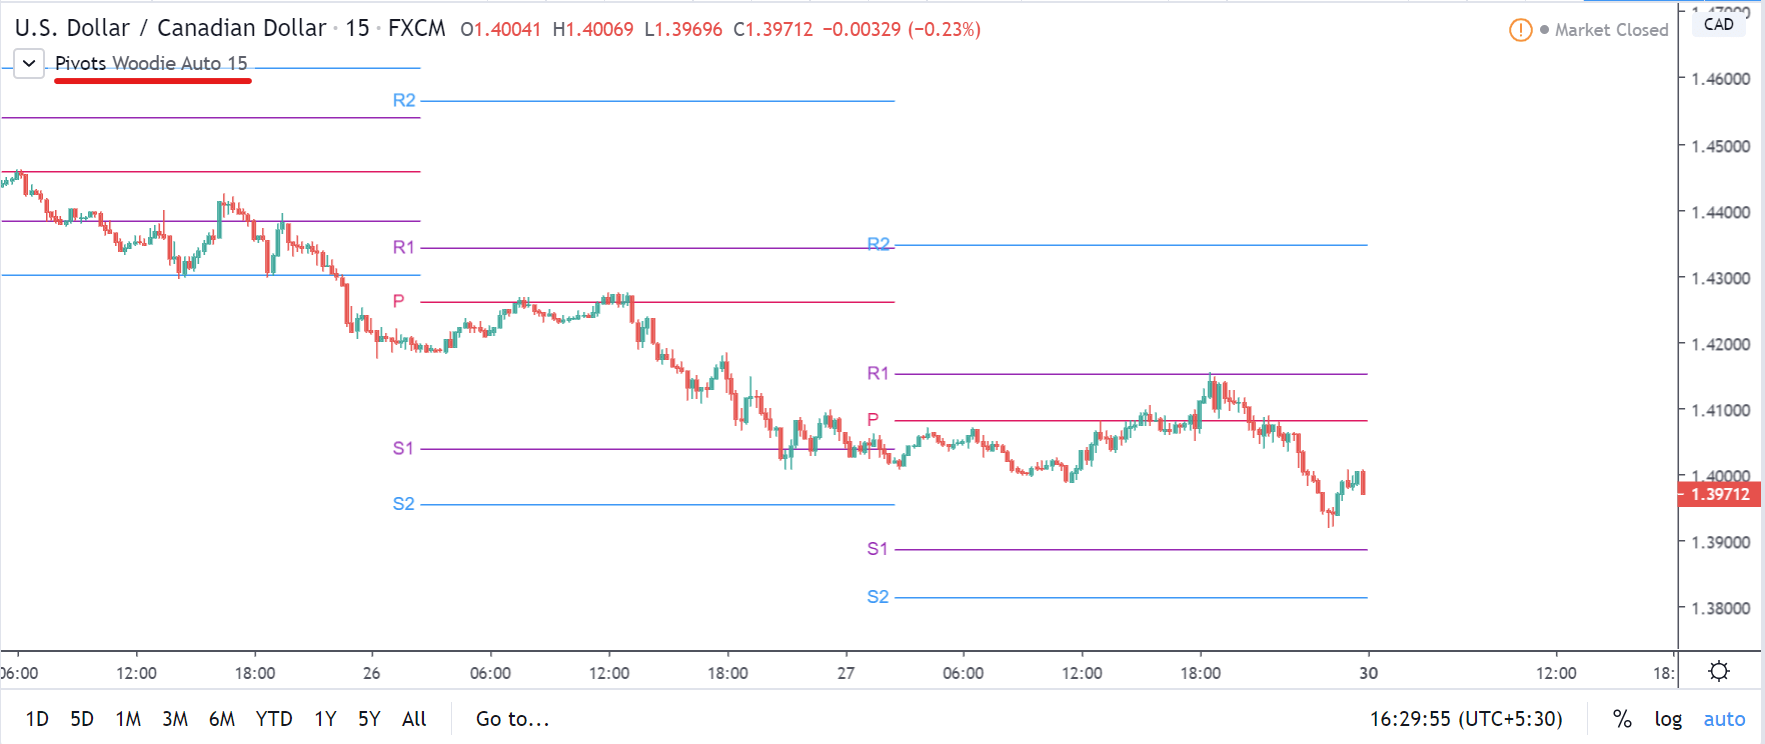
Woodie Pivot Point
The Formulae
Pivot point (P) = (High + Low + 2Close) / 4
First Resistance (R1) = (2 x P) – Low
Second Resistance (R2) = P + High – Low
First Support (S1) = (2 x P) – High
Second Support (S1) = P – High + Low
From the above formulas, we can notice that the way of calculations is pretty different from that of the traditional type. In the traditional, we considered the difference between High and Low to calculate support and resistance levels. But, in this case, consider the range as well as the close of the previous day. Some traders prefer this over the traditional pivots because it gives more weightage to the close price of the previous day.
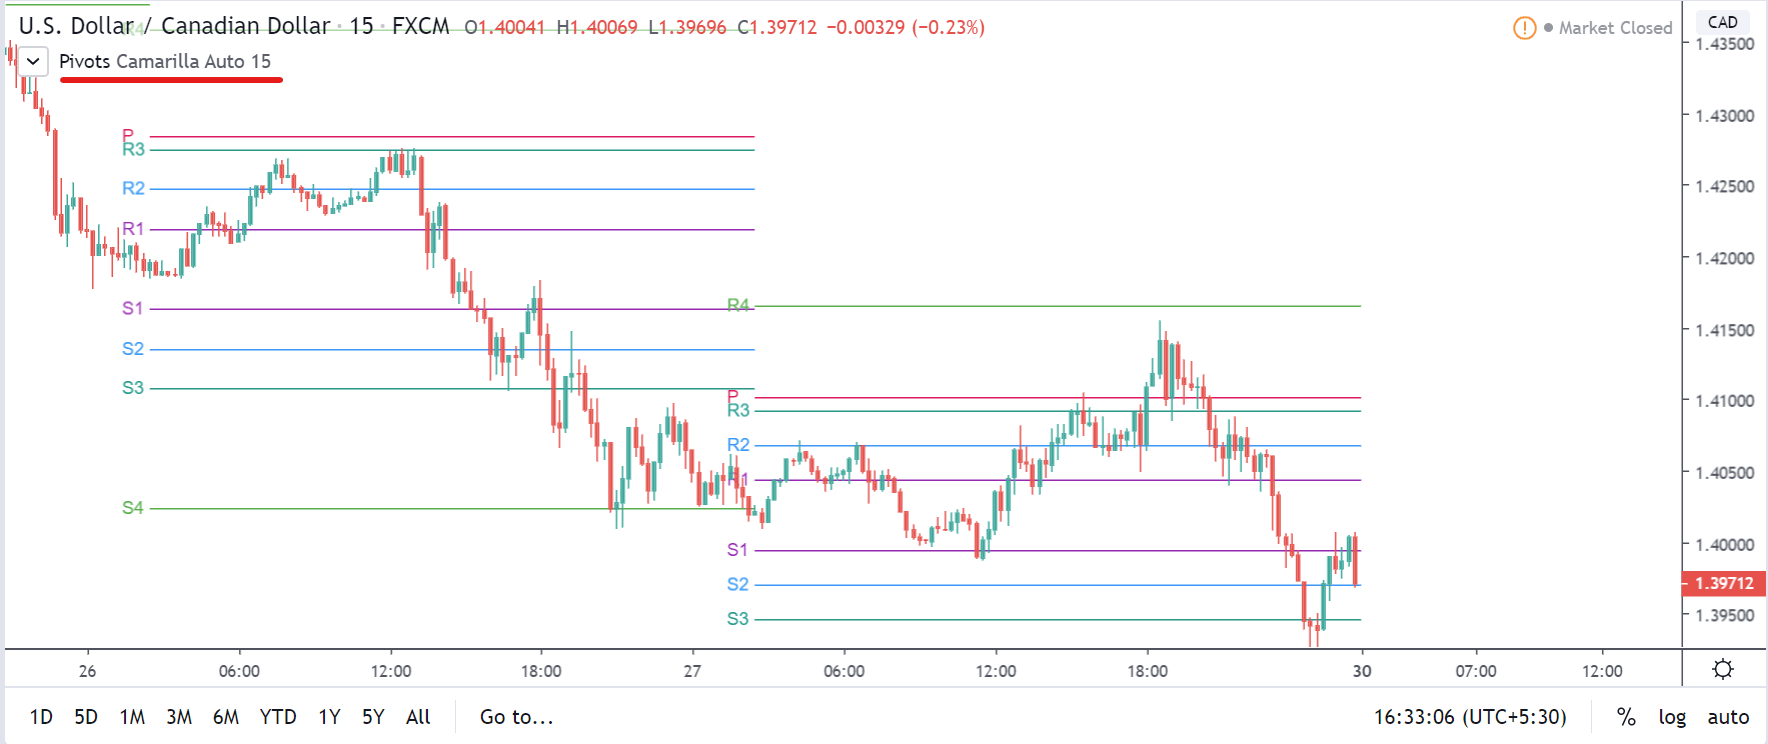
Camarilla Pivot Points
The Formulae
P = (High + Close + Low) / 3
S1 = Close – ((High – Low) x 1.0833)
S2 = Close – ((High – Low) x 1.1666)
S3 = Close – ((High – Low) x 1.2500)
S4 = Close – ((High – Low) x 1.5000)
R4 = Close + ((High – Low) x 1.5000)
R3 = Close + ((High – Low) x 1.2500)
R2 = Close + ((High – Low) x 1.1666)
R1 = Close + ((High – Low) x 1.0833)
If we look closely, we can infer that the support and resistance levels are calculated using the range and the close price similar to the Woodie calculation. The only major difference being, in Camarilla, four levels of Support and Resistance is calculated and is multiplied by a multiplier.
The theory with which Camarilla was created is based on the concept that the price has a natural tendency to return to the mean (here, close of the previous day). So, the simple strategy here is to sell when the price reaches the R3 or R4 level and buy when the price bottoms to S3 or S4 level. However, if the price breaches the S4 or R4 level, it indicates a strong trend in the market.
Fibonacci Pivot Points
The Formulae
P = (High + Low + Close) / 3
S1 = P – ((High – Low) x 0.382)
S2 = P – ((High – Low) x 0.618)
S3 = P – ((High – Low) x 1.000)
R3 = P + ((High – Low) x 1.000)
R2 = P + ((High – Low) x 0.618)
R1 = P + ((High – Low) x 0.382)
For calculating Fibonacci level, the pivot point level is calculated using the traditional method. Then the Support and Resistance levels are obtained by finding the product of the previous day’s range and the corresponding Fib level. The most used Fib levels are 38.2%, 61.8%, and 100%. Finally, adding/subtracting this value with the pivot point yields the Support and Resistance levels.
All of these indicators will be available with most of the brokers and charting tool software. Consider trying all of these pivot points on a demo account and use the ones that work the best for you. This hence brings us to the end of this lesson as well as the concepts involved in the pivot points. In the next lesson, we’ll summarize this topic and move ahead with another interesting technical analysis tool. Cheers! [wp_quiz id=”70131″]