Introduction
In the previous six lessons, we discussed pivot points right from understanding what they are, to the strategies one can apply to trade the markets. Now, let’s summarize what we’ve learned so far and move on with another exciting tool for analyzing the markets.
Pivot Point Basics
A pivot point is a technical indicator in technical analysis trading, which determines potential support and resistance levels in the market. This indicator is stationary, unlike the other indicators that move with the change in price.
The pivot points are levels that are essentially determined using the previous day’s high, low, and close price. So, every trading day, we can obtain one set of the pivot point.
What is the pivot point made up of?
There are up to six levels that make up the pivot point levels. One of the levels is the pivot point level, and the rest are support and resistance levels. The six pivot levels are symbolized as follows:
Pivot Point (PP/P)
First Support (S1), First Resistance (R1)
Second Support (S2), Second Resistance (R2)
Third Support (S3), Third Resistance (R3)
Fourth Support (S4), Fourth Resistance (R4)
Fifth Support (S5), Fifth Resistance (R5)
Note that, most of the time, we stick to the levels until S3/R3 because the price does not usually touch the levels beyond it.
How are the pivot levels calculated?
As mentioned, the pivot points are calculated using the close, high, and low of the prior trading day.
For example, the Pivot Point, First Support, and First Resistance are calculated as follows:
PP = (High + Low + Close) / 3
S1 = (2 x PP) – High
R1 = (2 x PP) – Low
Similarly, one can calculate levels until R5/S5. However, these values need not be calculated practically. There are trading platforms that automatically calculate these values.
Types of Pivot Points
There are four types of pivot points based on how the levels are calculated.
- Standard
- Woodie
- Camarilla
- Fibonacci
Most of the time, the standard pivot point levels are used.
Strategies using Pivot Points
There are several ways through which one applies pivot points. In our course, we have listed out three strategies.
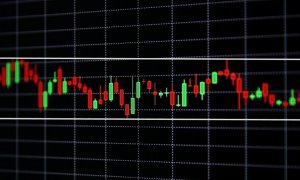
According to this strategy, one can consider buying when the support level of the pivot points coincides with the support level of the range. A similar strategy can be applied for shorting as well.
As the name pretty much suggests, traders can consider going long or short when the price breaks above the resistance or below the support level.
Measuring Sentiment
Traders can use the pivot point level (PP) to determine the trend of the market. If the market breaks above the PP, it indicates a buyer’s market and vice versa.
Summing it up
The pivot point is that indicators that can be used every level of traders from beginners, intermediate to the advance trades. However, this indicator is not a standalone indicator. It must always be used in conjunction with other indicators and tools to have higher odds of favoring you. We hope you enjoyed this series on pivot points. Happy trading!


