Dominate Price Action To Amplify Your Trading Arsenal
In this video presentation, we will be looking at price action. If you want to be a successful forex trader, you need to understand what price action is. If we had to strip forex training down to 1 single most important feature, then price action would be it. Today we are going to show you how it is applied in forex trading.
All areas of the financial markets capture the movements of any specific asset, including Forex, on a chart and where this is recorded historically. These movements can be represented as candlesticks, line charts, or bar graphs, And can be observed over varying time periods from 1-minute or 5-minute time frames, all the way up to monthly charts. This data reflects the beliefs of market participants at any given time, whether they are human or algorithm-based traders, which is shown on the charts in the form of price action.
Price action is the methodology of applying all your decisions from a price chart while adhering to some basic trading principles. Price action is often called naked trading because traders rely on the price itself in order to denote when to enter and exit trades. However, by adding a couple of moving averages and some support and resistance lines, it becomes much more easy to identify key levels of support and resistance to trade around. Ideally, as a trader, we want to try and identify tops, bottoms, and trends. And this methodology is an extremely important feature in identifying these key areas.
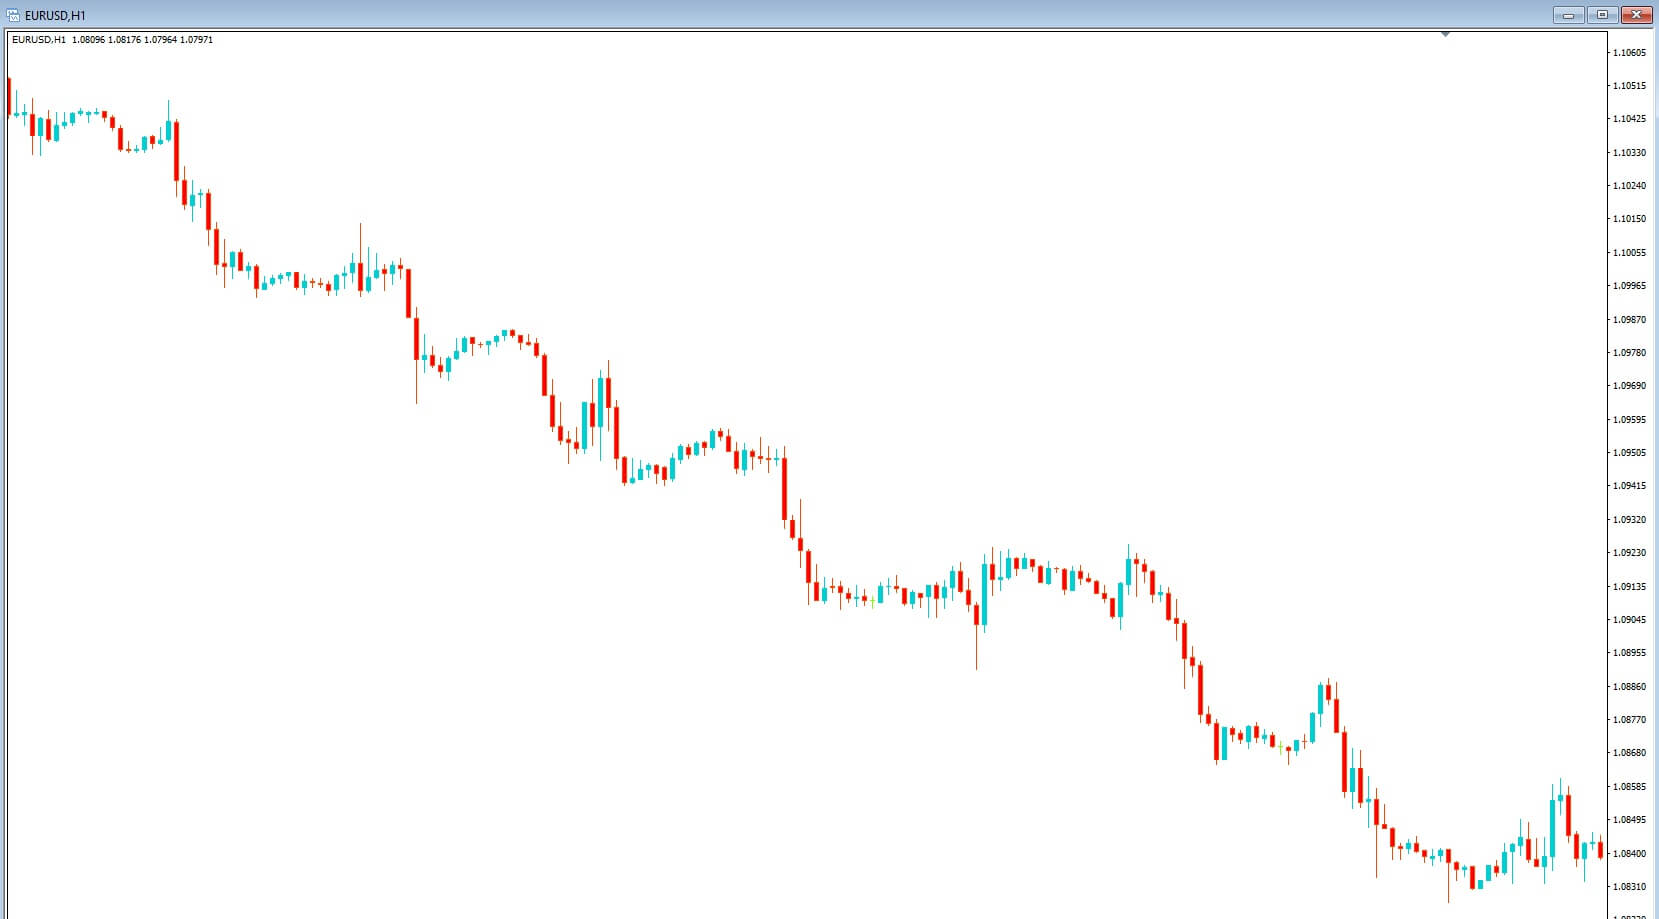
A couple of old adages come to mind which lends themselves very nicely to forex trading: the first one is that sometimes you can’t see the wood for the trees, and where that can be applied to Forex in so far as sometimes traders overload their screens with technical tools and they cannot really clearly identify what is happening with the price action because they are too focused on too many technical tools. And the other adage is sometimes less is more, and that applies for the same reason: by stripping away technical tools, we can only rely on price action itself, which is a key leading indicator in its own right. While in this example of the EURUSD pair, we can quite safely say that during this period of the 1-hour chart, the general trend was to the downside, but how can we pick this out by utilizing price action itself?
Example B, the Price action of a pair is in continuous motion apart from interruptions during the weekends. Otherwise, price is consolidating or moving in a sidewards direction, or it is trending higher or lower. As traders, we should be looking at what is happening with price action at any given time and then try to establish if the price is trending, or if it is in a period of consolidation, or even a pullback before a trend continuation.
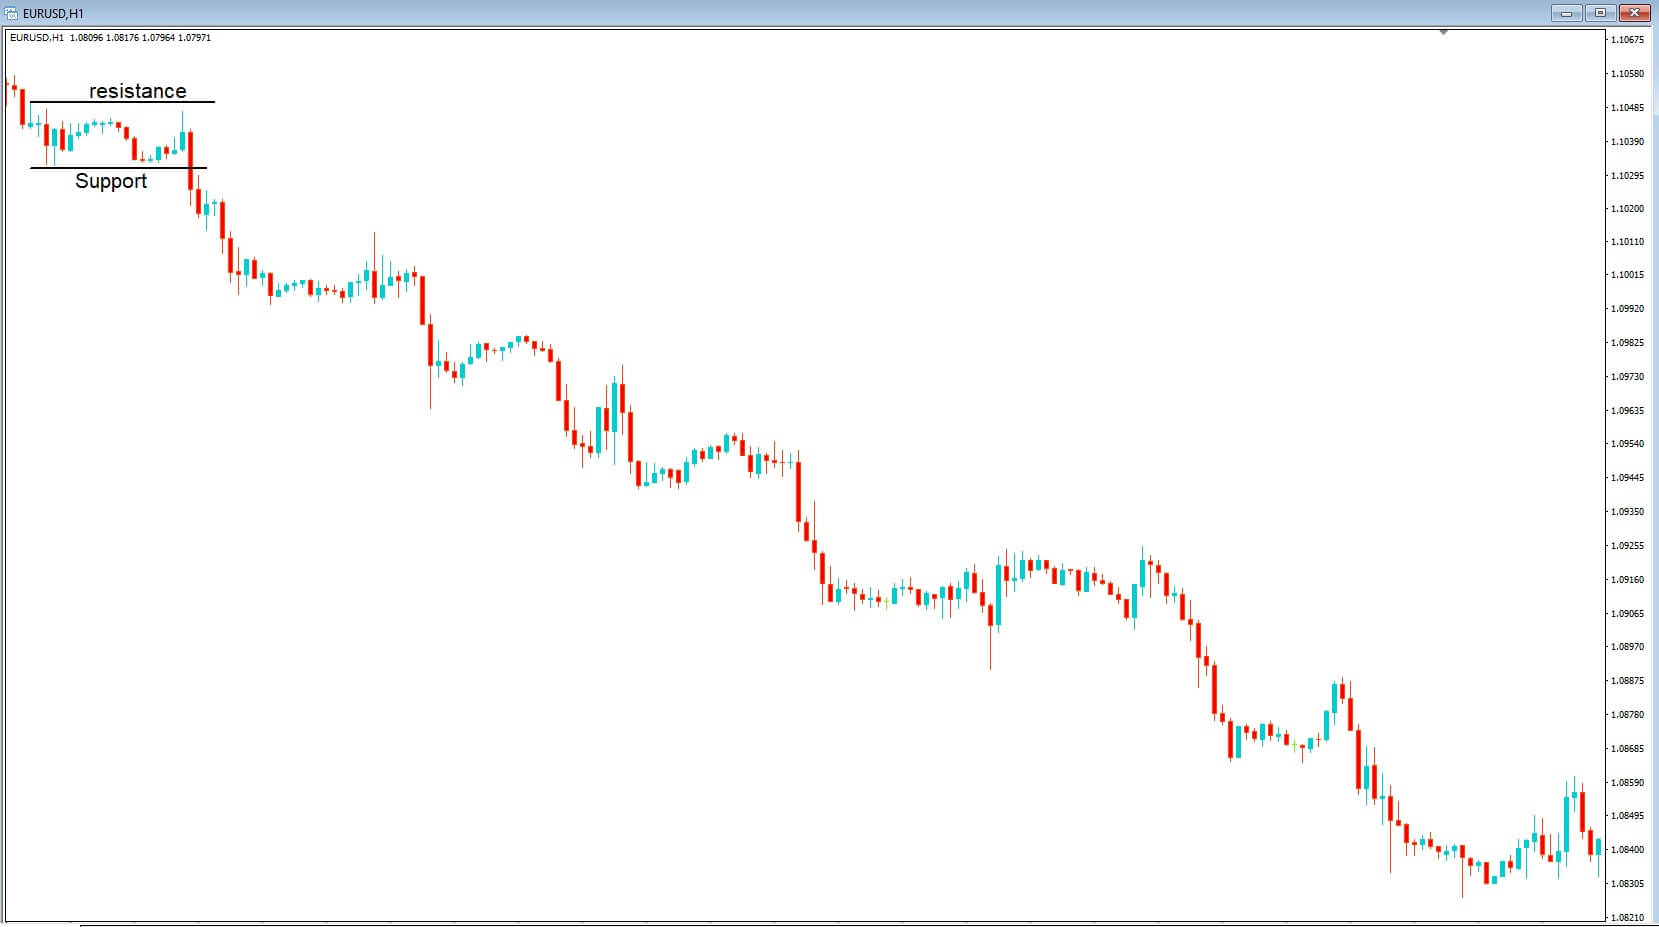
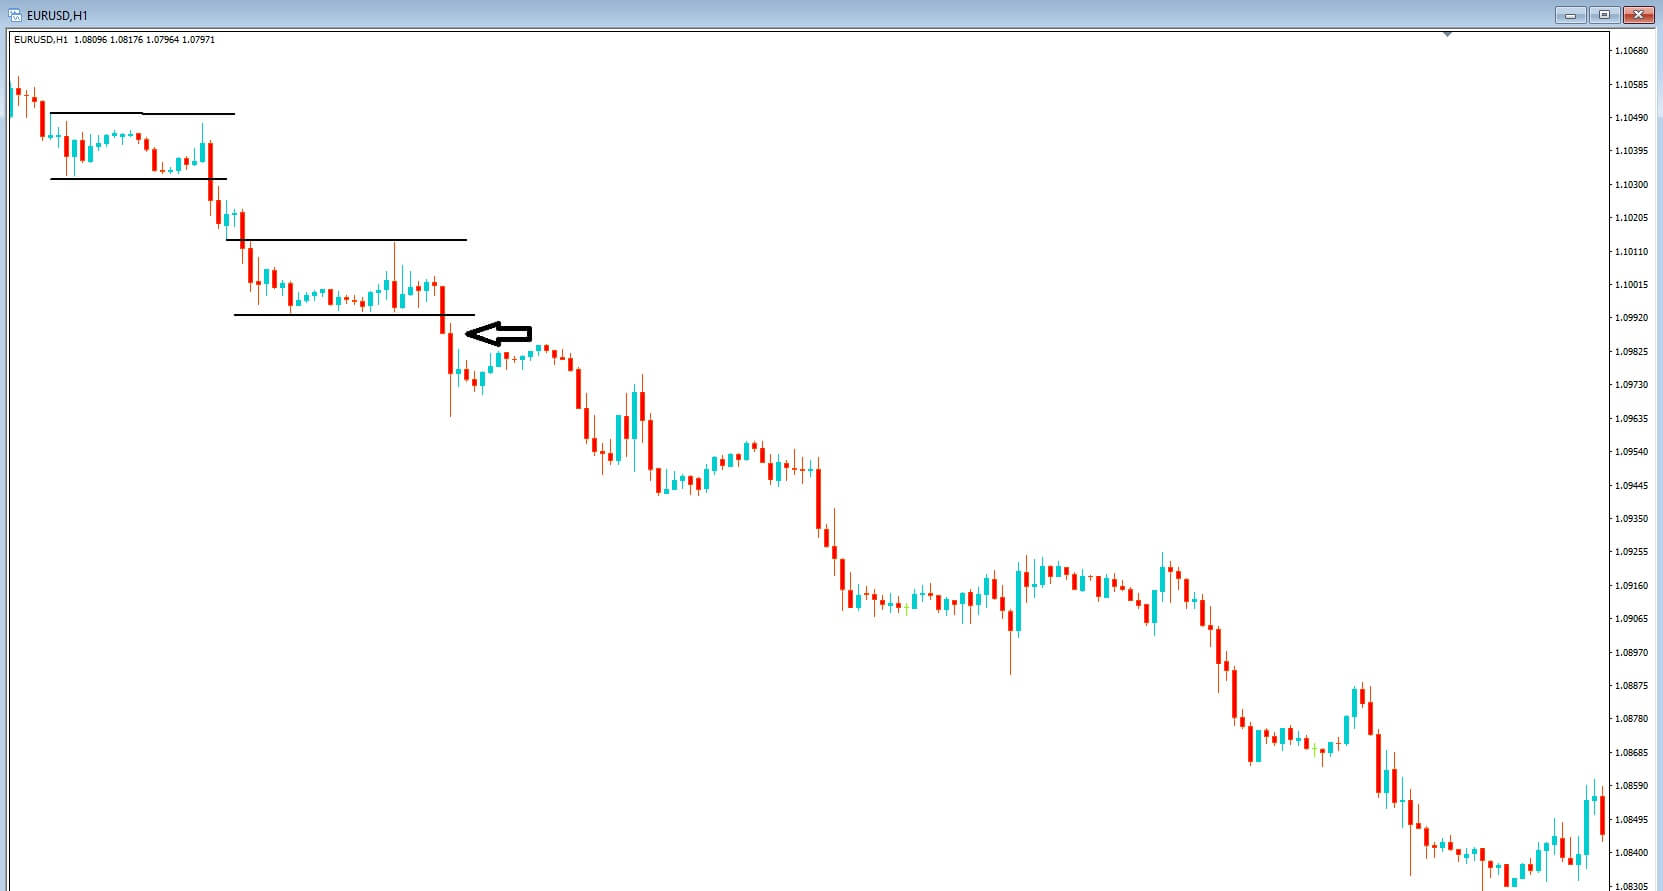
Price action alone can help us determine these areas, but by adding a couple of visual supports such as some trend Lines, it just makes it more easily identifiable. For this example, we have just added two very simple lines that help us to more clearly identify levels of support and resistance. Here we can see a period of consolidation, which is qualified by price action touching, or is very close to touching at least two areas of support and resistance, which are clearly identifiable such as drawn onto our chart.
One thing is for sure that price action will breach this area at some future point. This is a key area of interest for traders.
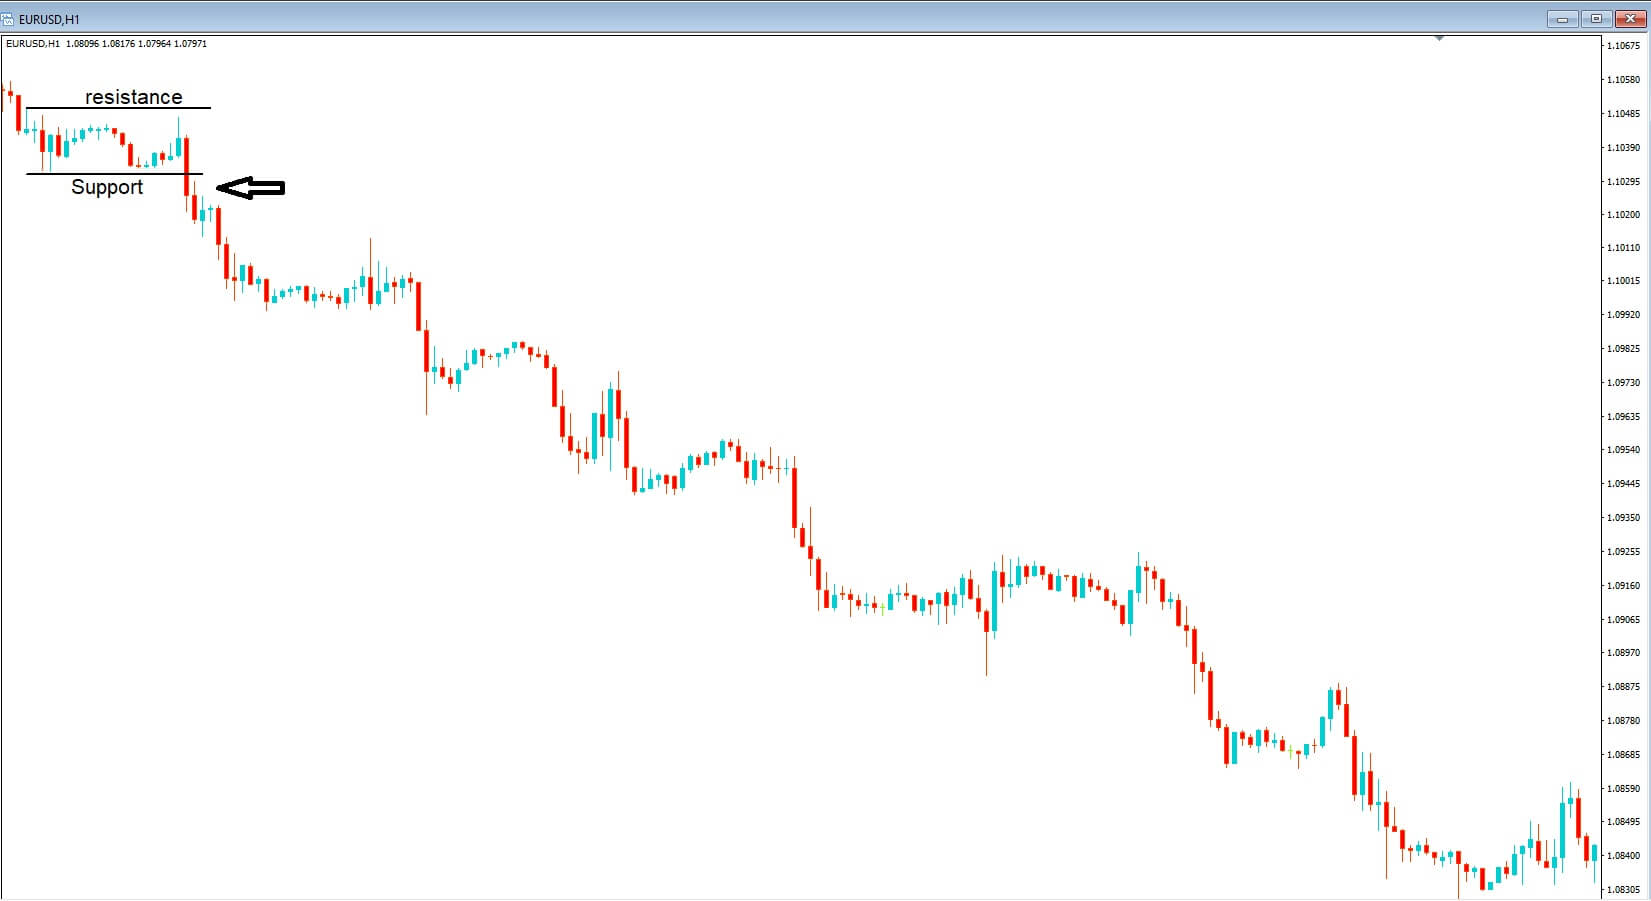
Example C, Here we can see that the support line has been breached by a strong bearish candlestick. Traders will jump on this opportunity to go short on the pair at this point.
Example D, We subsequently see another area of consolidation and a further breach to the downside, and where traders would expect that a downtrend is in process, and they would be looking for opportunities to go short.
Whilst stochastics, MACD, and moving averages are widely used throughout the trading community, many traders feel that price alone can be relied on for identifying trade opportunities, and certainly, these couple of examples would support that.
But of course, as cautious traders, we like to stack the odds in our favor, and if that means adding a couple of extra visual technical tools that will help us well, what’s the harm in that?
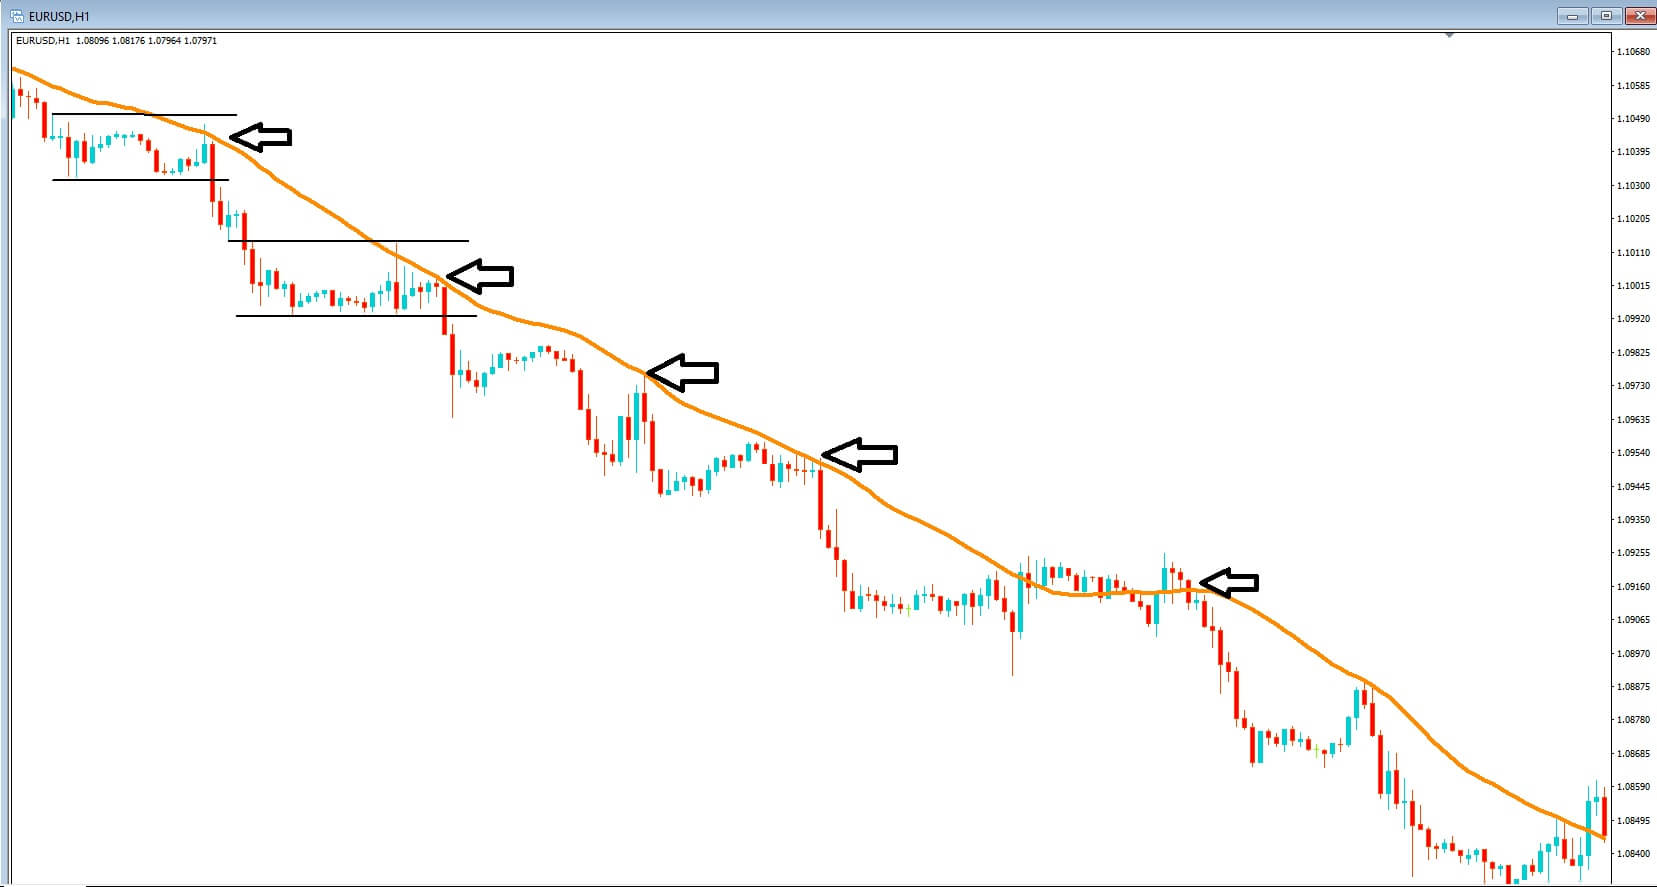
Example E, Here, for example, we have added a simple 30 period moving average. Notice how the price action tends to bounce lower off of this line, while price action continues in its trend lower.
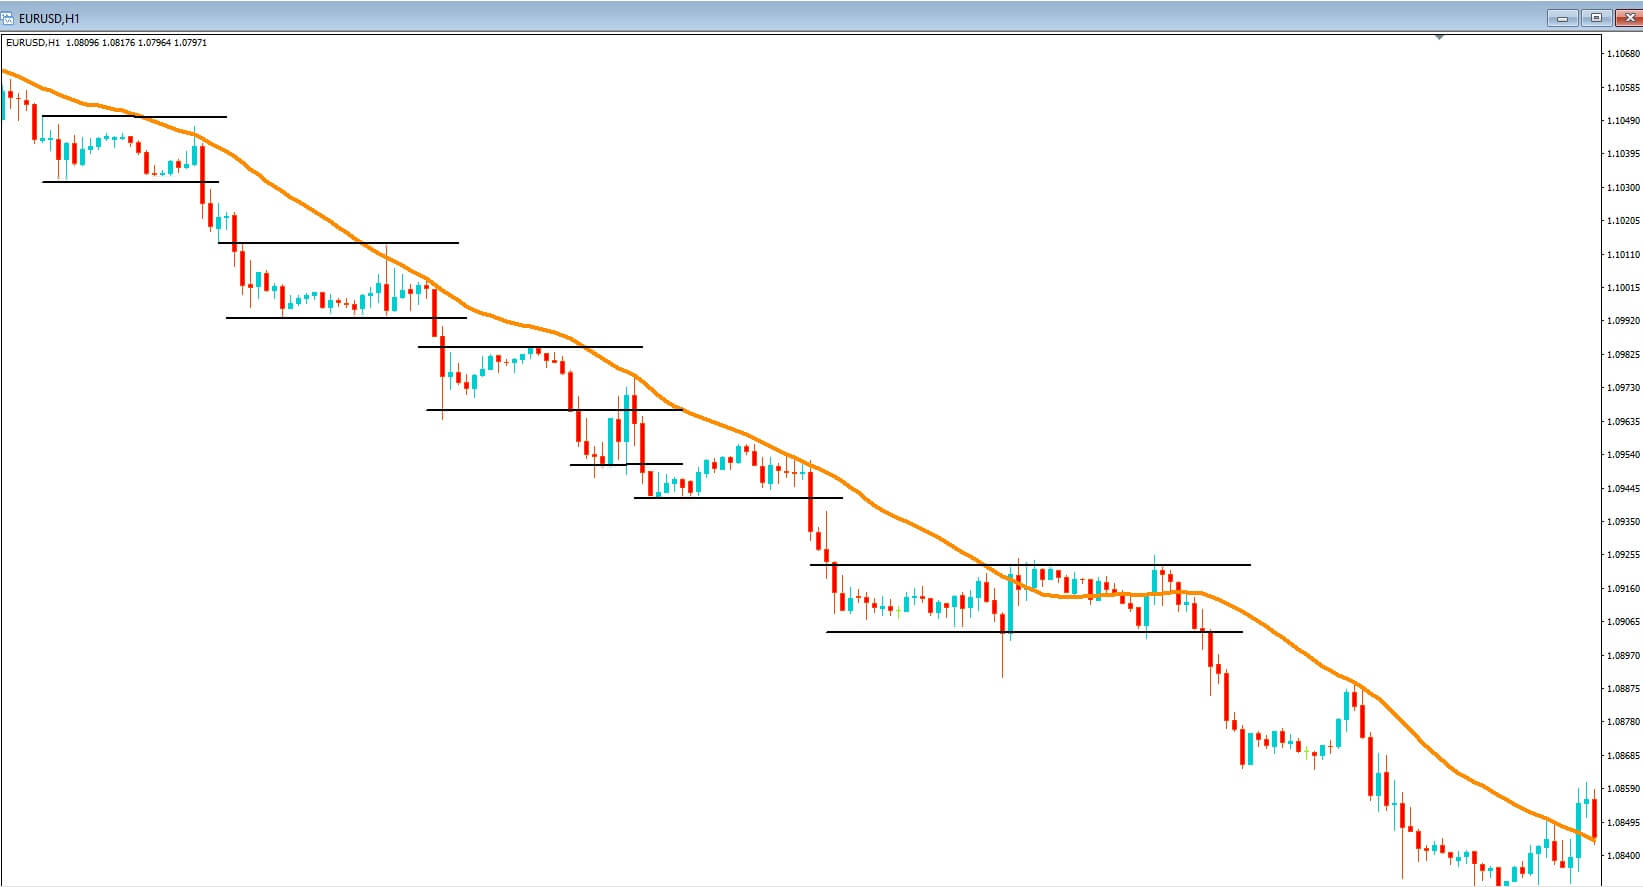
Example F, I know the world price continues to consolidate and punches lower through support lines and where support lines become lines of resistance, but all the while price is bouncing lower from the 30-period ma.
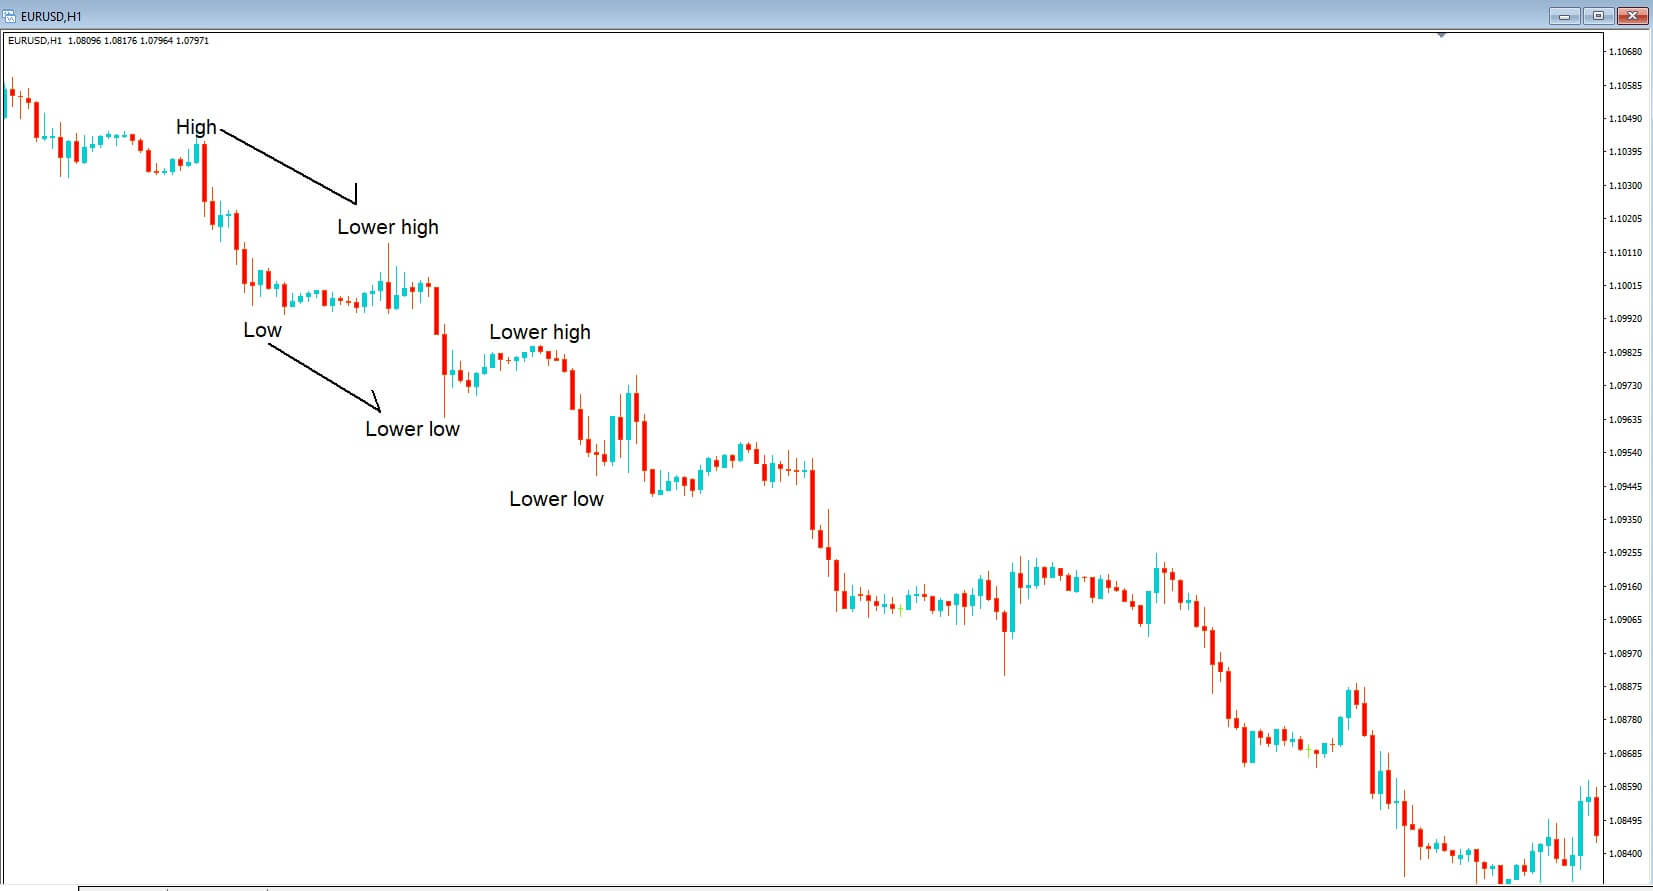
Example G, Price action also throws up another favorite for traders: highs with lower highs and lows with lower lows which identify a downtrend, and where the opposite would apply for an uptrend, where they would be looking for highs with subsequently higher highs and lows with subsequent higher lows. But again, these key areas are clearly evident on the screen, even with price action alone.
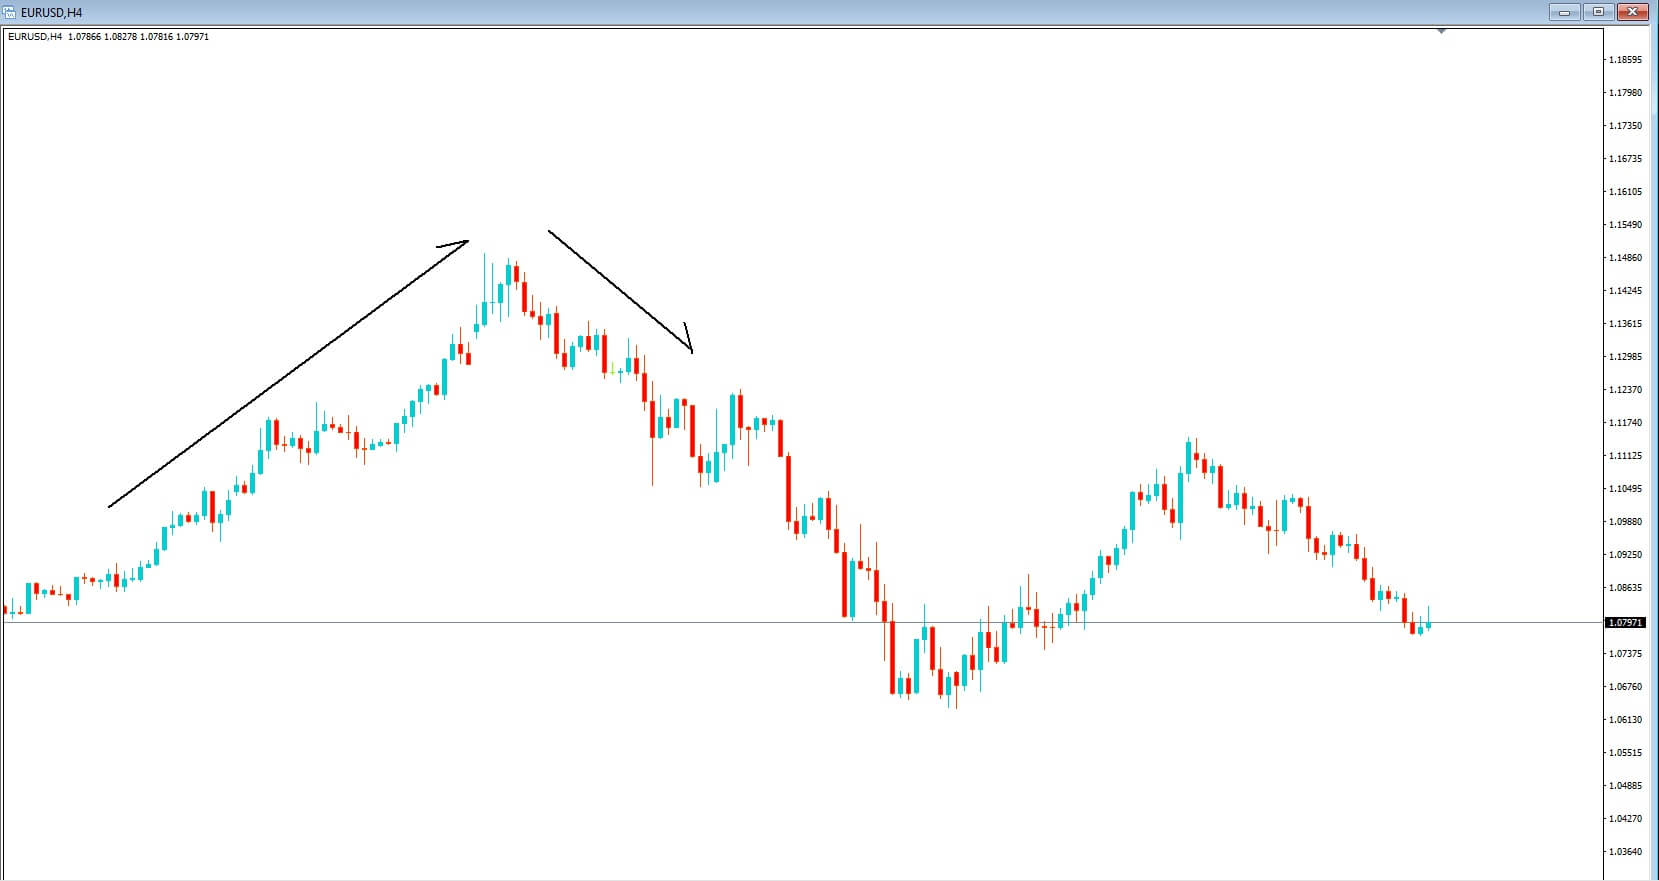
Example H, Price action Traders will also observe higher time frames, in this example, we are looking at a 4-hour chart of the EURUSD pair, traders try and establish what is going on with price action on the longer time frames because this will filter through to the lower time frames and where they will look for opportunities to jump on the overall trend should there be one.
Price action becomes repetitive, and this is because human nature in trading tells us that certain things are likely to happen at certain levels, typically key levels or round numbers, and if these things are recurring on a regular basis, human emotion would suggest that they are likely to continue to recur and therefore trading sometimes becomes a self-fulfilling prophecy where certain price action events, in the absence of fundamental reasons, is likely to continue in this vein. Price action levels become significant because market participants give significance to them.
In summarising price action who is the most significant aspect of Forex trading, and where by just using the minimum amount of technical tools you can more easily see areas of price consolidation, within resistance and support levels, and when these areas are breached we may see a continuation in price action in the direction of the breach, and by incorporating a simple moving average it can more easily help us to identify a trend. And that these very basic mechanisms are highly favored by professional and institutional traders.