Naked Trading – Is this all you really need for trading?
So what is naked trading? Well, it is certainly not sitting at your screen trading in your underwear! It has only really been since the advent of the internet that trading by technical analysis has really taken off. Before that, traders managed perfectly well without technical analysis, so how did they cope? Really good traders, including pit traders in the Futures markets,, knew where prices of certain assets should be in their head. They waited for levels where a Futures contract was oversold or overbought, and because they had a clear picture in their mind, from past experience, they knew when to buy or sell.
This was fairly similar in the early days of the forex market; currency exchange rates moved much more slowly than they do nowadays. Institutional forex brokers would squawk prices to the banks and institutional clients who, again, pretty much knew the levels in their heads. Some traders would simply write the exchange rate price changes on a piece of A5 paper, or a notebook, and they could then see by the changes if prices we’re moving up or down, and at what levels they had stalled, and would then trade accordingly.
Nowadays, price action in a volatile market can be so fast-moving it is almost difficult to keep up with it on a PC screen when using technical analysis. However, many profitable traders do not use lots of indicators on their charts. Some trade naked, relying only on the price action. Just like the days before the internet really took off, they take advantage of price movement on their screens only to tell them when a currency pair is overbought or oversold. Because essentially, this is what trading is all about, markets are pushed as high as they can possibly go in one direction, and when they run out of steam, because of a lack of buyers or sellers, they turn around and move in the opposite direction.
These moves can sometimes be limited to just a few pips, and sometimes the moves are much larger. This depends on the time of day and is also dependent on the number of market players; because the more traders are in the market simultaneously, the greater the liquidity in the market. And this also depends on things like fundamental reasons leading up to economic data releases, or market sentiment, and also forthcoming speeches by financial policymakers.
Example A

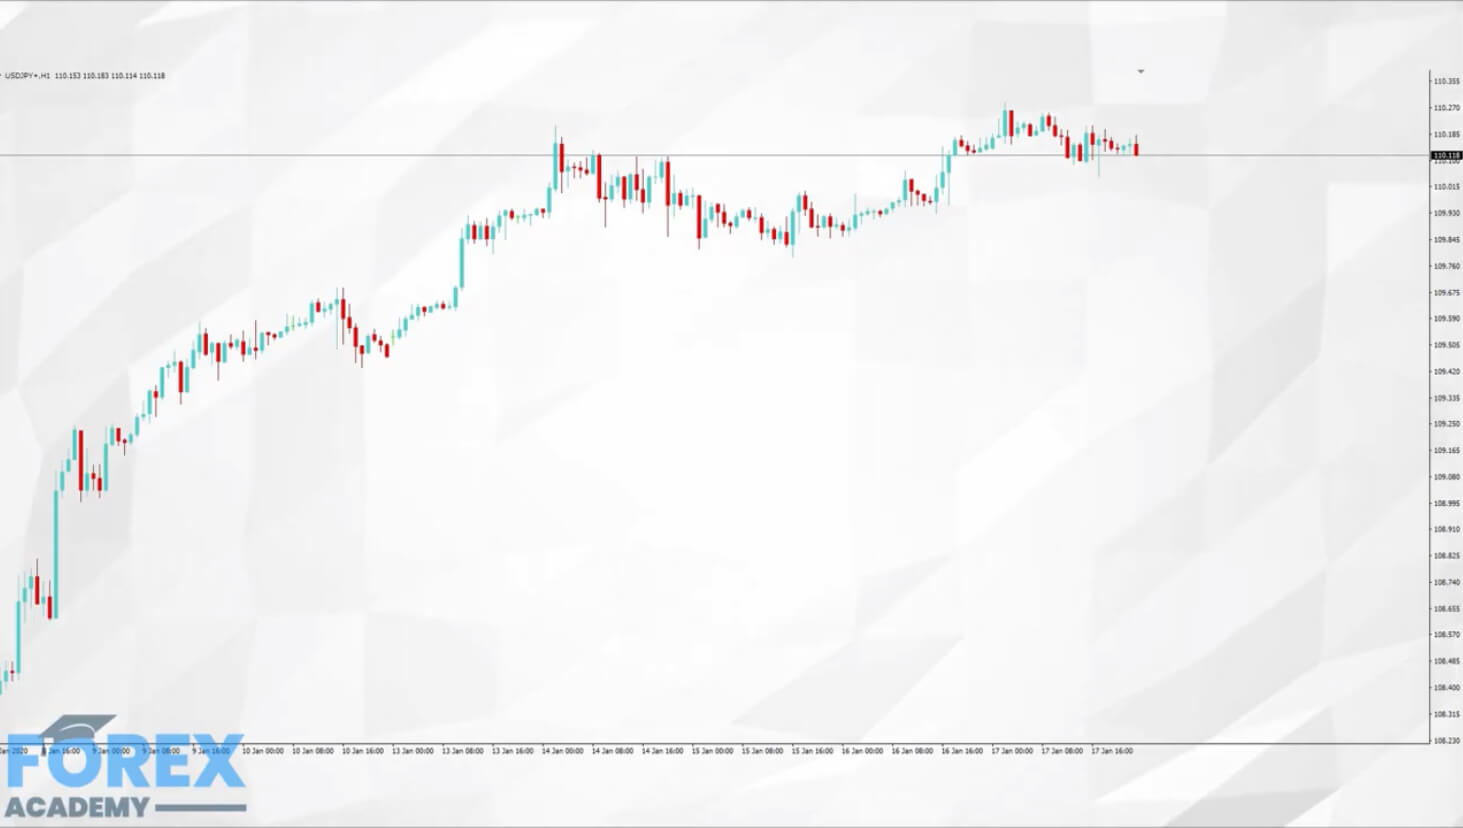
Let’s look at example A, and try and gauge how naked traders operate. This is a one-hour chart of the USDJPY pair, using only price action, in the form of Japanese candlesticks, to try and determine future price action. On its own, we can see that price is generally bid from the beginning of the chart, which we always read from left to right because it tells us a story.
Example B

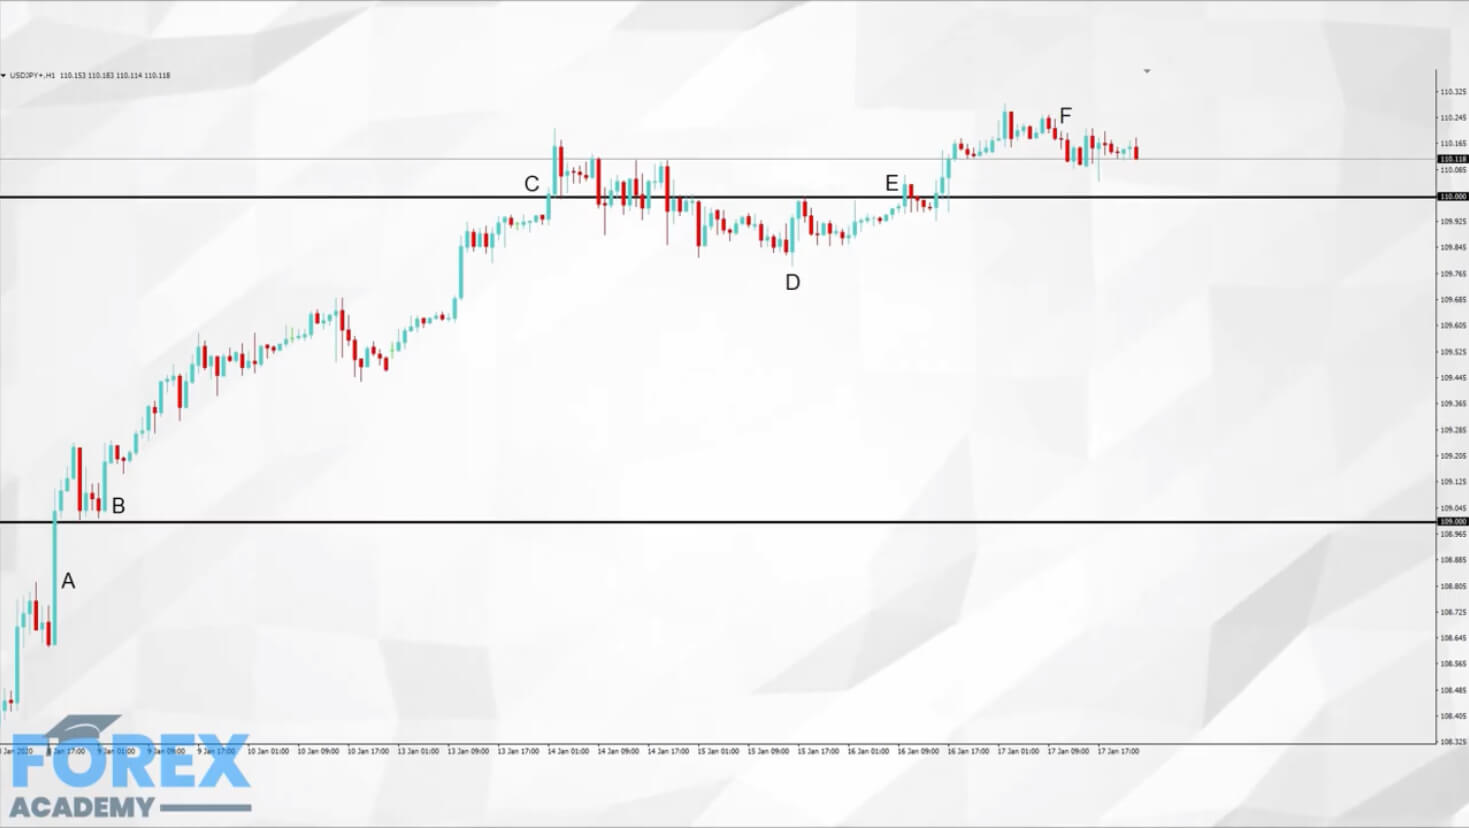
Now let’s look at example B, where we have just added a couple of horizontal lines which help to give us a clearer picture of what is going on. Simply by adding two horizontal lines, we can now see the price action of this particular pair is centered around two levels: 109.00 and one 110.00.
Firstly at position A, we can see a bullish candle that takes the price to just above the 109.00 level, only for price action to come down and be supported at position B by the 109.00 level. And when Traders could not push the pair any lower, price action begins to move up to the next key level at position C, which is the 110.00 level. Something we see quite often in the market is price action floating around key levels, or round numbers, and that’s exactly what happened here. Price moves down to position D, but fades out because of a lack of sellers, and then moves up to position E, before pushing above the 110.00 key level to around 1:1030. Here the market runs out of buyers and price action would appear to be gravitating back down to the 110.00 level again.
Sometimes new traders rely on too many technical indicators, which means they spend too much time looking at them all and cannot see the wood for the trees. Price action is king when trading Forex. So let it be your number one priority during technical analysis.


