If you choose to trade while naked, that’s entirely your business. Don’t let us stop you! What we’ll be talking about today, however, is a different form of naked trading – naked chart trading. When carrying out technical analysis, it is possible to make key decisions using what is referred to as a “naked” chart, but should you?
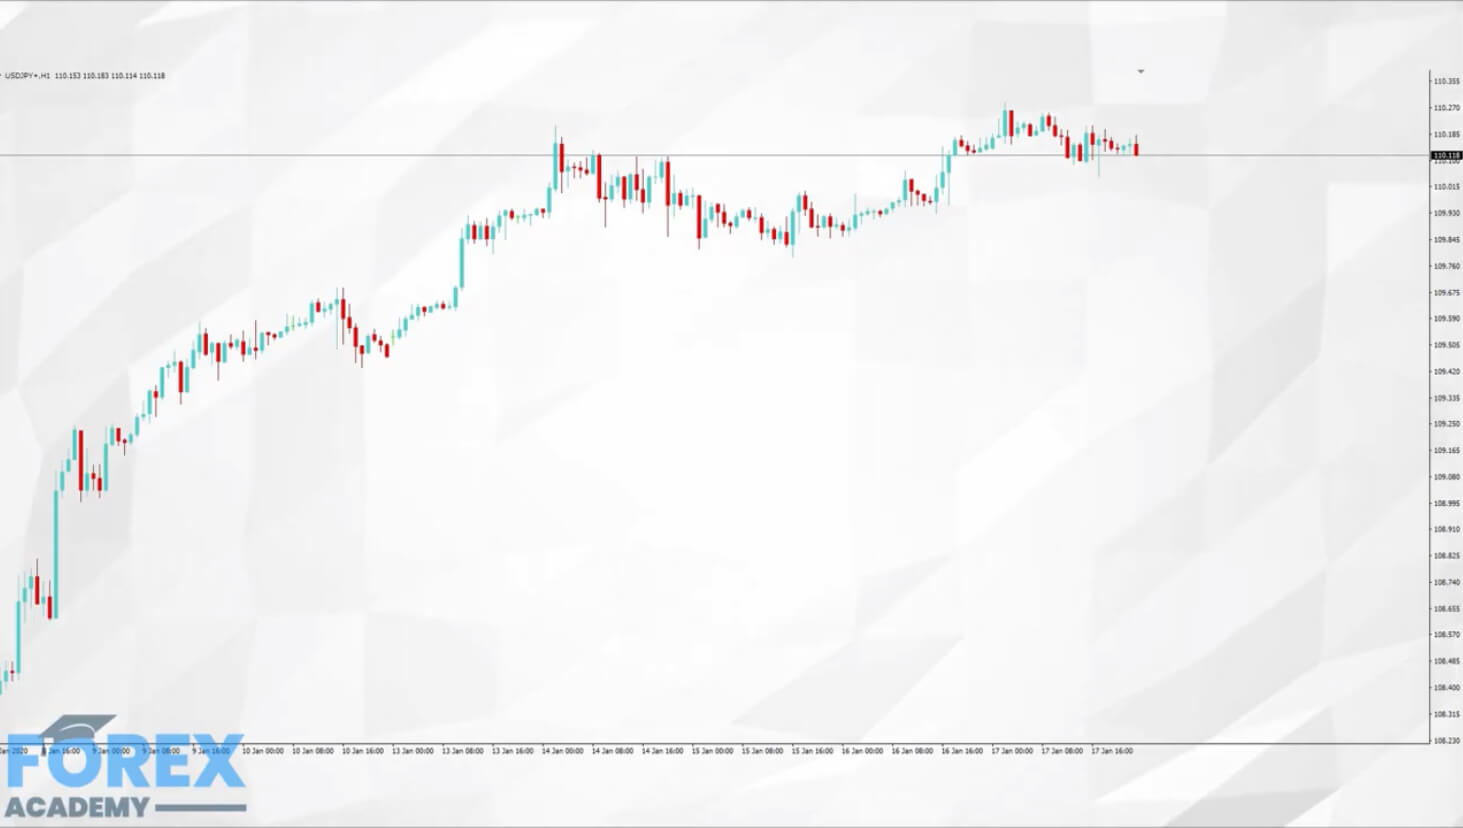
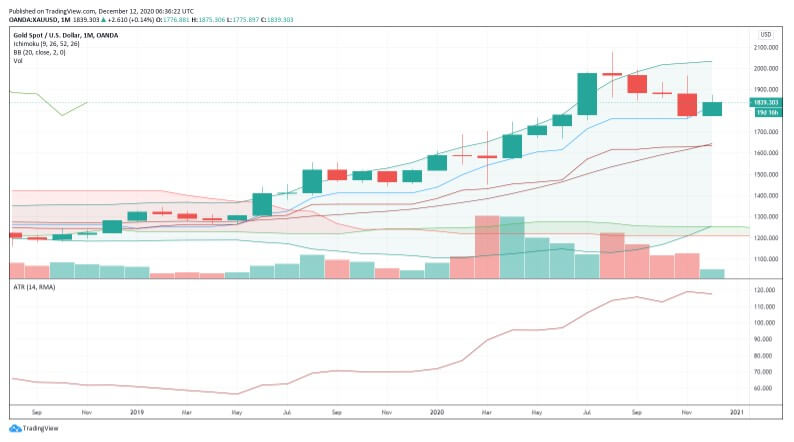
Look at the chart below:
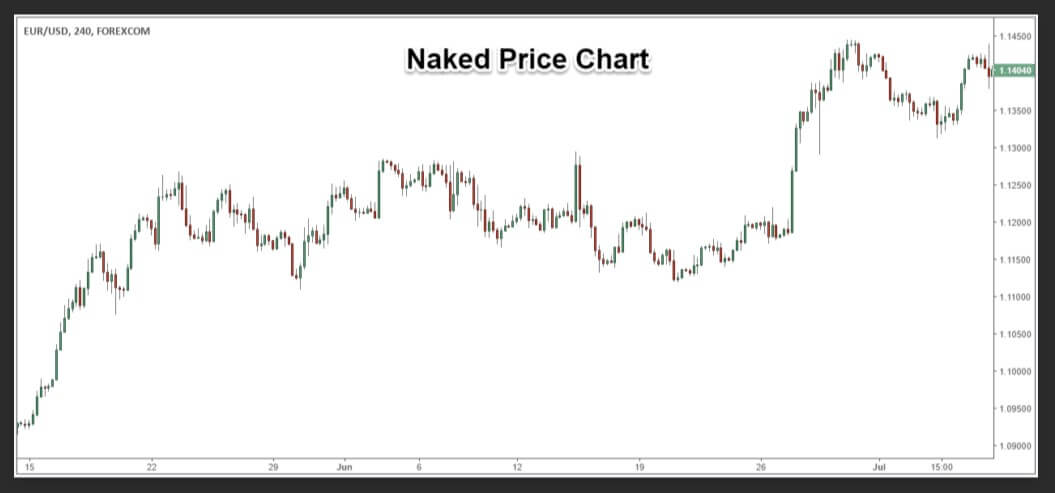
Now, compare it with this one:
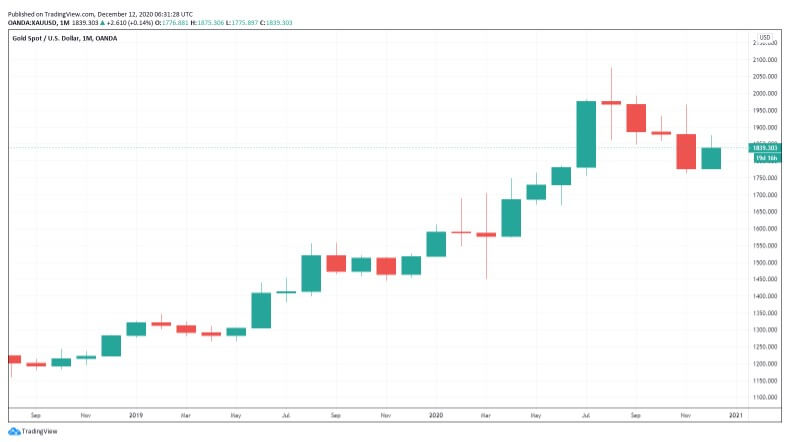
What is the main difference? – The second chart is “indicatorless“ or, in other words, indicators are not used here to analyze the trade.
There are usually no moving averages, no ATR, no volume, or any other additional piece of information that we would normally use in technical analysis.
This, what we see in the second chart, is what we call a naked chart.
Markets: What can we trade with naked charts?
Naked chart trading or naked chart reading can be used in any trading market that involves charts (e.g. ETFs, stocks, forex, among others).
Purpose: Why do traders use naked charts?
Naked charts are used to have a simplified and clearer view of what is happening in the market. When a chart is decluttered, traders can escape information overload and focus on what really matters – the price.
Technical traders vs. naked traders: What is the difference?
Technical traders primarily rely on technical tools to obtain information from the chart. Owing to the indicators they use, these traders can see whether a certain trade would be a good opportunity to take. Naked traders, on the other hand, focus on the candles that tell them what is happening right now. They are only interested in price action signals, which is why we call this type of trading price action trading as well.
Use: How do we use naked charts?
- To identify the market
Naked charts help traders grasp the momentum or what is going on with the price at a specific moment. Traders, thus, first need to understand the overall market direction with the help of the highs and lows. Based on this information, traders can discover important facts concerning the trade:
- bullish trends
- bearish trends
- emerging trends
- ranges between highs and lows
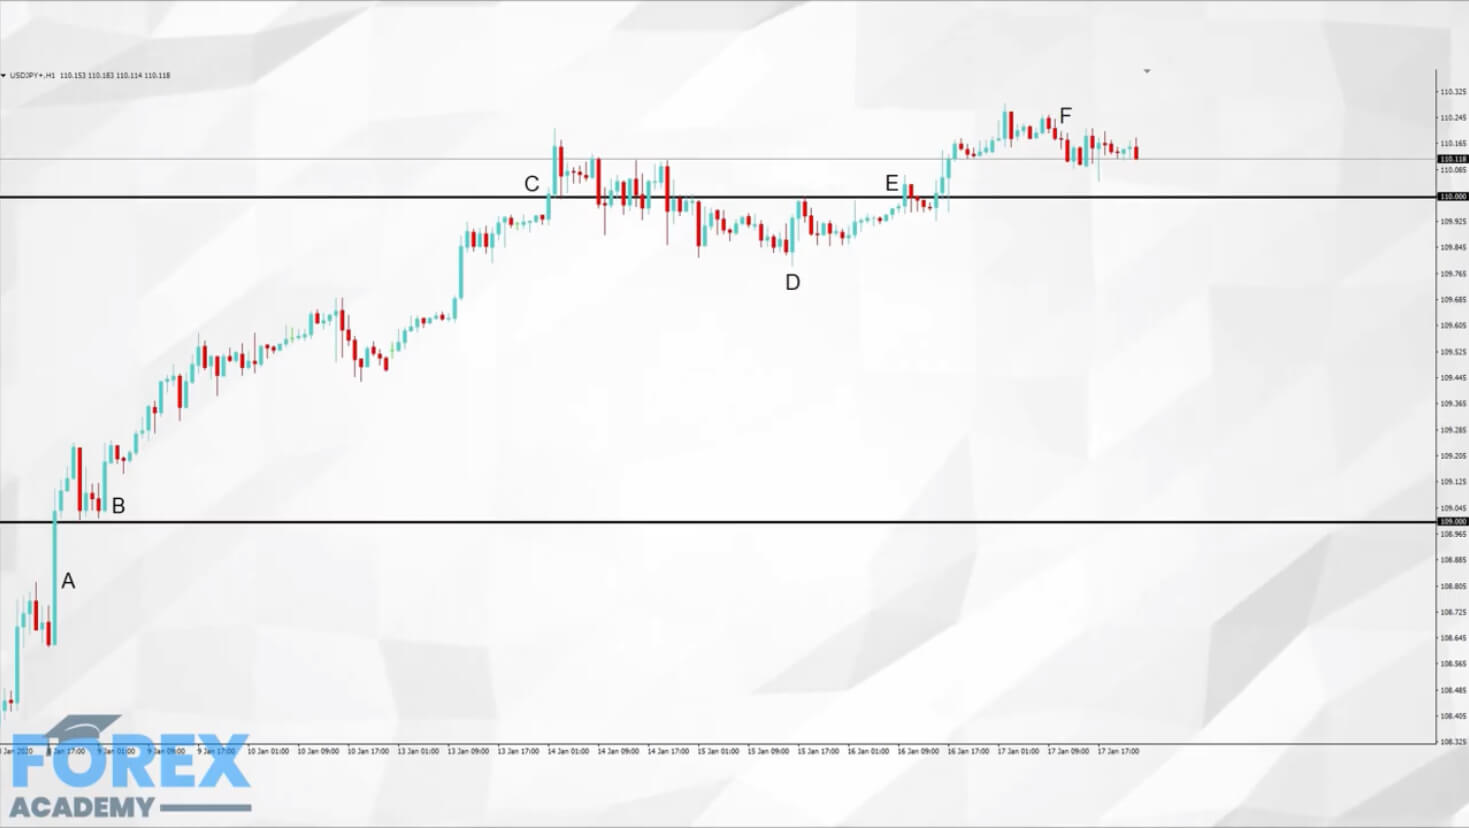
Support and resistance traders often rely on swings, differentiating between four different types – higher highs, higher lows, lower highs, and lower lows. These allow them to determine which of the following scenarios is currently taking place:
- uptrend – a series of higher highs followed by higher lows
- downtrend – a series of lower lows followed by lower highs
- consolidation – a lack of a specific pattern
To see how the market is moving, we can apply a simple chart analysis, without having to rely on any indicators. That is why it is easy to determine whether a market is trending. Also, when we see a bullish trend with a continuation of higher highs and lows, we know that this is a signal to buy. Bearish trends, however, will create a series of lower highs and lower lows, signaling a sell.
When a price gets trapped between two levels, both highs and lows will keep happening at the same levels. Without any specific boundaries, traders can face difficulties understanding price action. That is why neutral markets require special attention and more caution.
- To spot reversals
People who trade reversals often use horizontal levels, trend lines, pivot points, and Fibonacci levels. Support and resistance levels are believed to be particularly suitable for revealing the key points of reversals:
- When the price keeps moving along major support levels which then turn around.
- When the price retraces along with the previous support level, making it the new resistance to get reversed.
Uptrends and support and resistance levels are important areas in naked charts because those are the places where we are likely to see turning points.
- To identify trade signals
We can identify buy and sell signals in naked charts by determining the candlestick reversal pattern. The most common signal to sell is a bearish rejection candle.
Time frames: Do time frames affect trading with naked charts?
Instead of using a daily chart, traders can actually switch to lower time frames to see what is happening with the structure more closely. Some traders ever resort to using multiple time frames to make a better decision. To generate a better approach, you can ask yourself a question such as the one below:
Is a more bullish trend indicating a greater chance of a resistance fail?
Exits: Can we get a sign to exit a trade in naked chart trading?
After the price breaks out, trades pile into the trade, often wondering if it is overbought or oversold. This question is, in fact, not important for naked chart reading because it allows traders can rely on the resistance sitting above the current run in the price.
Resistance, or support, levels will not tell us if the price will fail to continue running, but traders should remain vigilant once the price reaches this level. Here, you should actually be attentive to what the price is doing. These are important areas because you can see from the price action what it is about to do.
Being alert and practicing the ability to read the forming structure can give you a profit exit long before everyone else rushes to the exits.
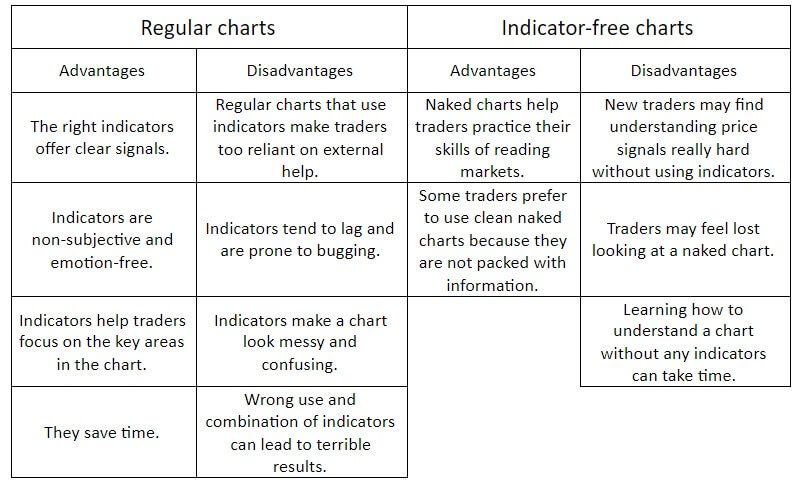
Different charts: What are their advantages and disadvantages?
Fuzzy logic: Application in trading
Traders are essentially people who are prone to making subjective evaluations. We often encumber our decision-making with notions such as intuition and emotions that obstruct clear thinking. Unfortunately, technical trading cannot sustain vague structures, so some traders need a definite yes or no to interpret signals and have a clear vision of our next step.
The black-or-white approach will alleviate many of the challenges we face in trading because it is the gray area that makes trading susceptible to mistakes. What this means is that traders need to learn how to approach messages whose interpretation may vary.
No indicator is 100% accurate, but we all know that, for example, the RSI below 30 is a sell and above 70 is a buy. A lot of false signals occur if we blindly follow this crisp logic. However, by combining other information about the market we could decide to open smaller or bigger positions. Our brains are used to fuzzy thinking, we feel how much we need to push the brake and how much to step on the gas, and accidents happen. Takes a lot of time to master and safeguard our portfolio.
Conclusion: Naked charts or technical analysis
Traders who are apt at interpreting naked charts are also at a significant advantage because they can understand what is happening in the market without needing to rely on any particular indicator. With the rise of automated trading (expert advisors), there seems to be a greater need for ready-made solutions, and learning how to read charts tends to be a factor that makes many people give up early. However, we must understand that the basics of interpreting any chart are also the essential items of knowledge every trader should acquire, regardless of the market or strategy he/she chooses. In the end, whether you decide to use specific tools or opt for naked chart trading, make sure that you know everything there is about your preferred style of trading to eliminate mistakes, prevent losses, and make good decisions, as these will inevitably determine how successful your trading is no matter the approach.